
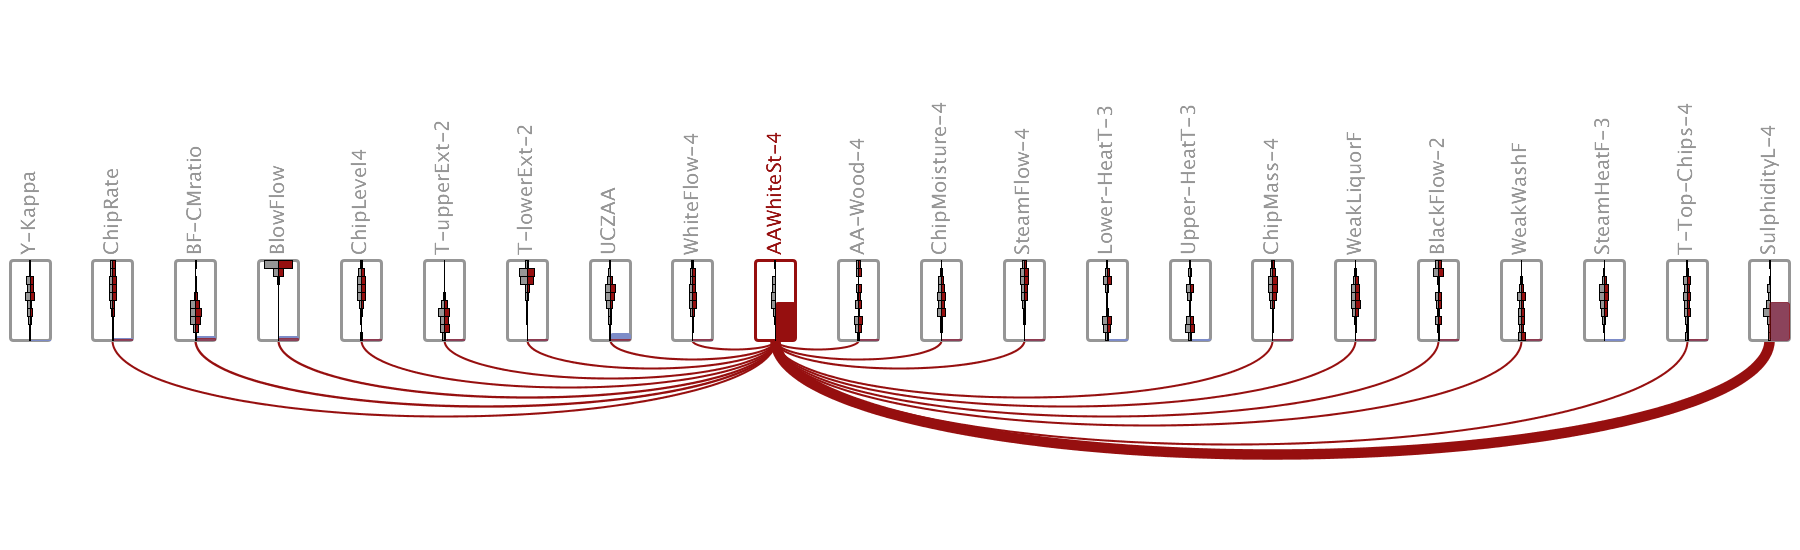
Data sets with missing values, commonly known as incomplete or missing data, are a frequent challenge in data analysis across a range of domains. They are known to cause issues such as biased, uncertain and unreliable results. A large number of statistical methods have been developed for dealing with missing values, which are mainly focused on replacing missing data with plausible values (known as imputation). Meanwhile, the visualization and visual analysis of missing data have until recently been a largely overlooked topic, even though visualization has great potential to support understanding and knowledge generation from incomplete data. The awareness of the existence of missing values and the patterns relating to these missing values can be improved by visualization, and through this many potential issues and data uncertainties can be highlighted. In addition to supporting identification of issues arising during data generation and pre-processing, visualization of missing data can reveal important patterns, such as patients missing appointments in medical studies where the missingness may highlight a health issue.
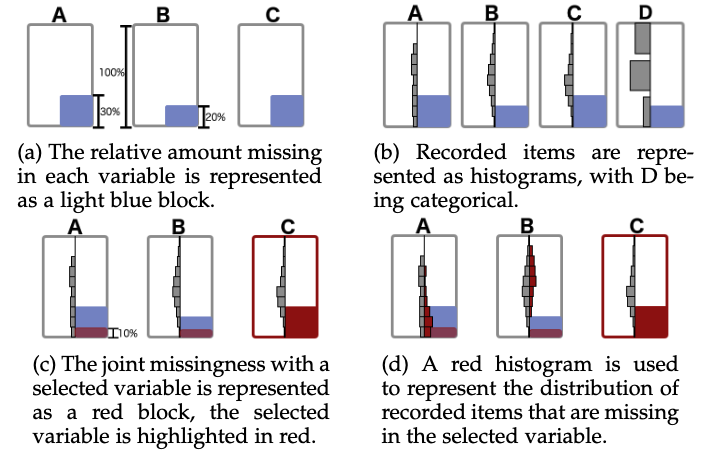
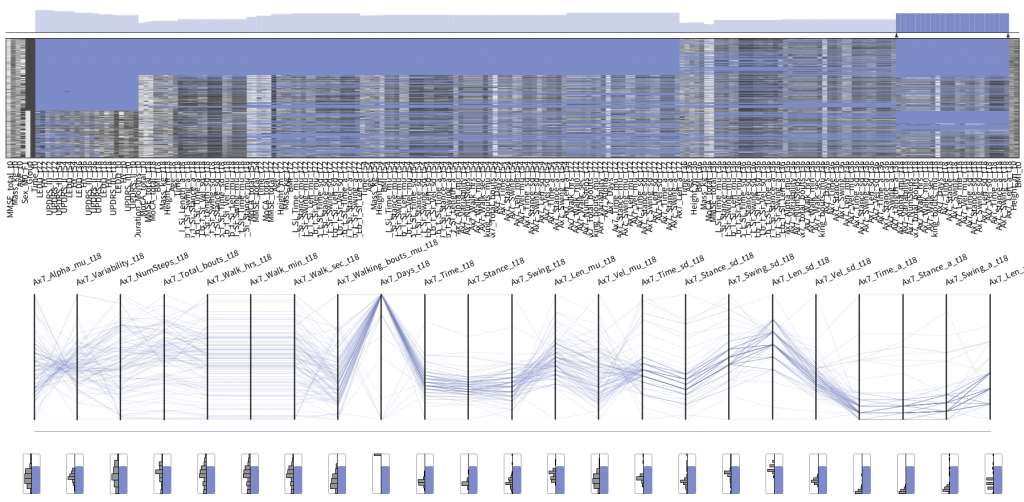
This project research visualization approaches to investigate structural missingness in large incomplete data sets. We have defined missingness patterns of relevance for data analysis and exploration of missingness structure, and contributed the novel MissiG visualization method and metrics to support investigation of structures of interest.
Team
- Dr Sara Johansson Fernstad (researcher), Newcastle University
- Dr Jimmy Johansson Westberg (researcher), Linköping University