The 6th #VizTIG Symposium will be held on the 5th of September, in the Catalyst, Newcastle.
About the event
This symposium is an initiative from the Visualization Turing Interest Group (VizTIG).
This one day symposium will explore the latest science and engineering in data visualisation, including guest speakers, lighting talks, and posters from leading UK researchers and practitioners, and a forward-thinking keynote from an international speaker.
This event is suitable for individuals who are interested in the following areas of data science and AI:
- Visualisation and visual analytics experts
- Data engineers seeking to design data systems and ETL pipelines without bias
- Data scientists seeking to understand the operation of analytics and machine learning.
- Business and financial analysts seeking insights to live and historical data streams.
- High-level decision-makers seeking accurate, timely summaries of complex uncertain events.
Attending
The free registration is through Eventbrite: https://www.eventbrite.co.uk/e/981672237087?aff=oddtdtcreator.
Agenda
Thursday 5 September 2024
10:00 – 10:20
Registration
10:20 – 10:35
Welcome and introduction
Daniel Archambault
10:35 – 11:45
Session 1: AI, Perception and Techniques
Chair: Xinhuan Shu
Atlas of AI Risks: Enhancing Public Understanding of AI Risks
Edyta Bogucka
Fears and Hopes of AI: An Interactive Visualization Platform for a Comparative Analysis of Perspectives on AI
Edyta Bogucka
Zoomable Level-of-Detail ChartTables for Interpreting Monte-Carlo-style stochastic model outputs
Aidan Slingsby
Comprehension errors using logarithmic plots
Nick Holliman
11:45 – 13:00
Lunch and demonstrations
13:00 – 14:10
Session 2: Biological Data and Medicine
Chair: Sara Johansson Fernstad
The biological data visualisation communities: VIZBI, BioVis & VCBM
Jim Procter
Patient History Visualization for Structured Medication Reviews: a design study
Layik Hama
PedCan: Multi-omics Visualization Design for Pediatric Cancer Patients
Lama Alsmmahi
How do people want their mobility data over time visualised? Adapted Delphi study with patients
Jack Lumsdon
14:10 – 14:30
Refreshment break
14:30 – 15:40
Session 3: Public Engagement and Communication
Chair: Alma Cantu
Exploring the grammar, vocabulary, and metaphor of data visualization at The North Jesmond Knowledge Exhibition
Murray Dick
Interactive Pattern Explanation for Network Visualizations
Xinhuan Shu
Visualization Atlases: Explaining and Exploring Complex Topics through Data, Visualization, and Narration
Jinrui Wang
Pieces of Peace: Women and Gender in Peace Agreements
Jenny Long
15:40 – 16:00
Refreshment break
16:00 – 17:00
Keynote
Christophe Hurter
17:00 – 17:10
Closing remarks
Keynote
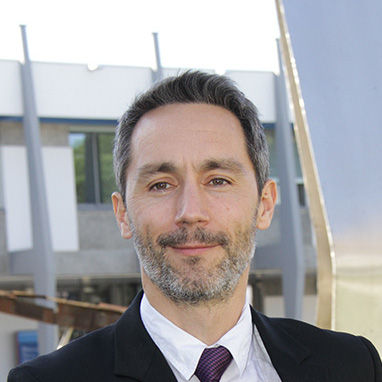
Christophe Hurter is a Professor at the University of Toulouse in France, where he leads the Interactive Data Visualization group (DataVis) at the French Civil Aviation University (ENAC). His research expertise encompasses several pivotal areas, including Explainable Artificial Intelligence (XAI), Big Data and Information Visualization (InfoVis), Immersive Analytics, and Human-Computer Interaction (HCI).
Christophe will present his work on explainable AI and visualization, including two European projects, CODA and TRUSTY. The CODA project aims to create a collaborative human-machine system by integrating prediction models for task allocation, neurophysiological assessment to monitor operator mental states, and adaptable AI systems for safety. TRUSTY leverages artificial intelligence (AI) to enhance efficiency and safety in the global deployment of Remote Digital Towers (RDT).
Call for Presentations/Posters
Call for presentations are now closed.
Location
Workshop Room
The Catalyst
3 Science Square
Newcastle Helix
Newcastle upon Tyne
NE4 5TG
UK
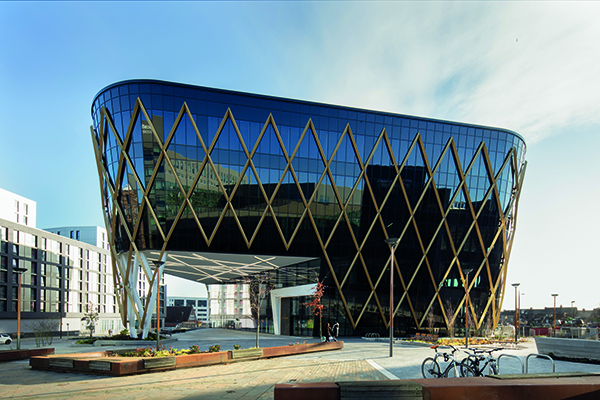
The Catalyst is our new ground breaking facility that is home to the UK’s National Innovation Centre for Ageing (NICA) and the National Innovation Centre for Data (NICD). The building hosts a suite of bespoke facilities and a range of flexible office space. This enabled the creation of a tightly coupled and supportive ecosystem between the innovation centres and commercial organisations with a focus on either delivering new insights through data analytics or delivering new products and services which help us to age well, for longer.
Organisers

Professor Daniel Archambault
Newcastle University

Dr Sara Fernstad
Newcastle University

Dr Alma Cantu
Newcastle University

Dr Xinhuan Shu
Newcastle University
and VizTIG organisers.
Contact
For any questions, please contact nova@newcastle.ac.uk.
Previous Events
- The 1st #VizTIG Symposium, 13 September 2019, at the Alan Turing Institute
- The 2nd #VizTIG Symposium, 8 September 2020, virtually
- The 3rd #VizTIG Symposium, 7 September 2021, virtually
- The 4th #VizTIG Symposium, 14 September 2022, at King’s College London
- The 5th #VizTIG Symposium, 14 September 2023, at King’s College London

