
One graph has been feted as determining government policy in the UK in respect of early years education, and the need to focus on deprivation early in life. It offers an impressive example of the impact of social science and the importance of investment in large longitudinal studies without which the underpinning analysis could not have been done. But it also raises some awkward questions about how to communicate analyses of these kind without making statistical oversimplifications or the wrong message being taken away.
Leon Feinstein’s graph, seen below, appeared in Economica in 2003 and was soon appearing in Cabinet Office seminars and has been reproduced in many other publications. In the end, it attracted a number of criticisms, although they have deployed new data or new methods to deal with problems thrown up, but it made a mark on a number of politicians. The problem is that the political message taken was one which was not a feature of the analysis but an unintended artefact of the presentation.
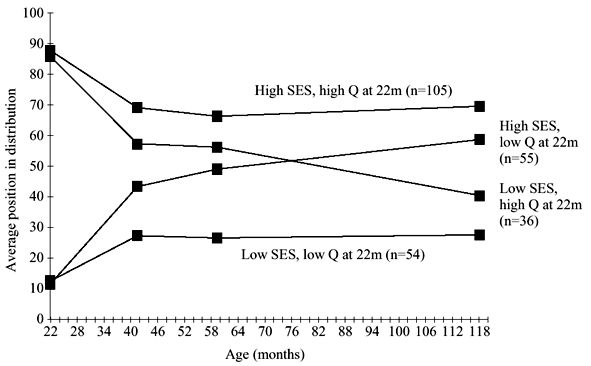 The graph shows four lines, representing cross classification of rich and poor, smart and dull, as they develop over their childhood, using data from children born in 1970. The groups are identified early on and then their average score on tests is marked to form time series, with the low-low and high-high groups being extreme as might be expected. But what focused the attention of everyone was that the other two lines crossed over, smart poor kids were overtaken by dull rich kids in middle childhood, and you could read off an age when this occurred from the graph.
As the groups chosen were exemplars, they did what they were meant to do which was to capture the imagination. But their specific paths, rather than the trends of the cumulative effects of disadvantage, caught attention in a way which was not intended and unfortunately was not statistically robust. Poor children do fall behind their richer peers, but the extent to which the graph appeared to show this was an exaggeration due to a number of factors (Bynner et al., 2015).
Measurement error is a difficult issue, and one which is confusing, as in this case it gives rise to a phenomenon termed ‘regression to the mean’, despite there being no bias in the data. The principal problem is that selecting the smart and dull groups requires the identification of groups of children at the extremes of the distribution. While these children are expected to have more extreme values of the underlying trait, they also have more extreme values of measurement error as these reasons for extreme scores are invisible in the measurement.
Another problem is that children were selected using measurements taken at age 22 months, as younger children see larger error, with tests having fewer and simpler items. Thus the random error can be a larger determinant of the starting point, causing trends to gravitate back to the average, or regress to the mean. However, this point was actually considered in the Economica paper, with grouping by the second observation presented as an alternative. Statistically more sensible, due to much greater reliability, would be to make the groups with the measurements when the children are oldest, but this would quite obviously lose the compelling narrative.
The point of offering a second position was that the effect of measurement error in the grouping should affect only that measurement, so patterns afterwards will be unaffected. And it is clear that the trend is present after the second time, but also that it is much less than the jump up between the first and second measurements. These point to the inference of persistent effects of disadvantage being justified and a social problem needing government attention but the analysis may have distorted government attention.
Subsequent reanalyses have shown an effect was apparent (Jerrim & Vignoles, 2011), but it has not proven possible to replicate in more recent data. Jerrim & Vignoles (2013) found children born in 2001 did not show a strong pattern when trying to control one aspect of cognitive development with another. Bradbury et al. (2015) found inequalities arising by the first measurement (typically age 3 or earlier) and persisting, but not changing, throughout development. Thus it is possible that the large observed differences were due to poorer measurement instruments, or that progressive social policies have improved the experience of poor children in school.
Part of the problem of presenting the analysis in Feinstein’s work was that inequality is a property of a distribution. While saying things are unequal and early advantages persist is true, and this is the experience of the majority, it is more compelling to look at the mobility question, even though this involves fewer children. This speaks to the current spasm about grammar schools, that there are bright poor children being let down by the system, which drowns out a wider view of the continuum of inequality, seen as a social gradient in educational outcomes.
The fact of lines crossing at a certain age is unhelpful for several reasons: while adjusting these lines statistically they will not cross, it is possible to take a slightly less extreme selection which would. But it also focuses the attention of intervention on needing to act at or by a certain time, which is strongly at odds with the consistency of the trend observed. Yet underlying this is the correct interpretation, that poorer children who start well do not reap the rewards of their early attainment.
So the question arises of what would be an appropriate presentation of the results of an analysis of the paths followed by these groups, or a more complex picture of how social disadvantage affects children’s development throughout childhood. The point is to get across politically salient information without obscuring detail or offering undue certainty about specific inferences. The reaction to this graph holds lessons that such research can have an influence, but presentational detail is a critical concern.
References
Bradbury, B., Corak, B., Waldfogel, J. & Washbrook, E. (2015) Too many children left behind. New York: Russell Sage.
Feinstein, L. (2003), Inequality in the Early Cognitive Development of British Children in the 1970 Cohort. Economica, 70: 73–97. doi:10.1111/1468-0335.t01-1-00272
Bynner, J., Feinstein, L., Jerrim, J., Vignoles, A., Goldstein, H., French, R., Washbrook, E., Lee, R. & Lupton R. (2015), Social class differences in early cognitive development. Longitudinal and Life Course Studies, 6: 331-376. doi: 10.14301/llcs.v6i3.361
Jerrim, J. & Vignoles, A. (2011), The use (and misuse) of statistics in understanding social mobility: regression to the mean and the cognitive development of high ability children from disadvantaged homes. Department of Quantitative Social Science Working Papers, 11-01.
Jerrim, J. & Vignoles, A. (2013), Social mobility, regression to the mean and the cognitive development of high ability children from disadvantaged homes. Journal of the Royal Statistical Society: Series A (Statistics in Society), 176: 887–906. doi: 10.1111/j.1467-985X.2012.01072.x