Multi-omics Data Visualization for Paediatric Cancer Care
Nov. 2022 – ongoing
This PhD project focuses on improving the usability of complex biological networks through interestingness measures and interactive visualization.
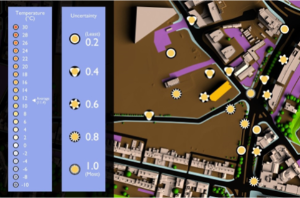
Using Shape for Uncertainty Representation in Multivariate Visualization
Sept. 2021 – ongoing
This PhD project focuses on using variations in shape to represent different levels of uncertainty.
Visualising data profiles and analysis pipelines
This project investigate how visualisation techniques are and should be exploited for key aspects of data profiling.
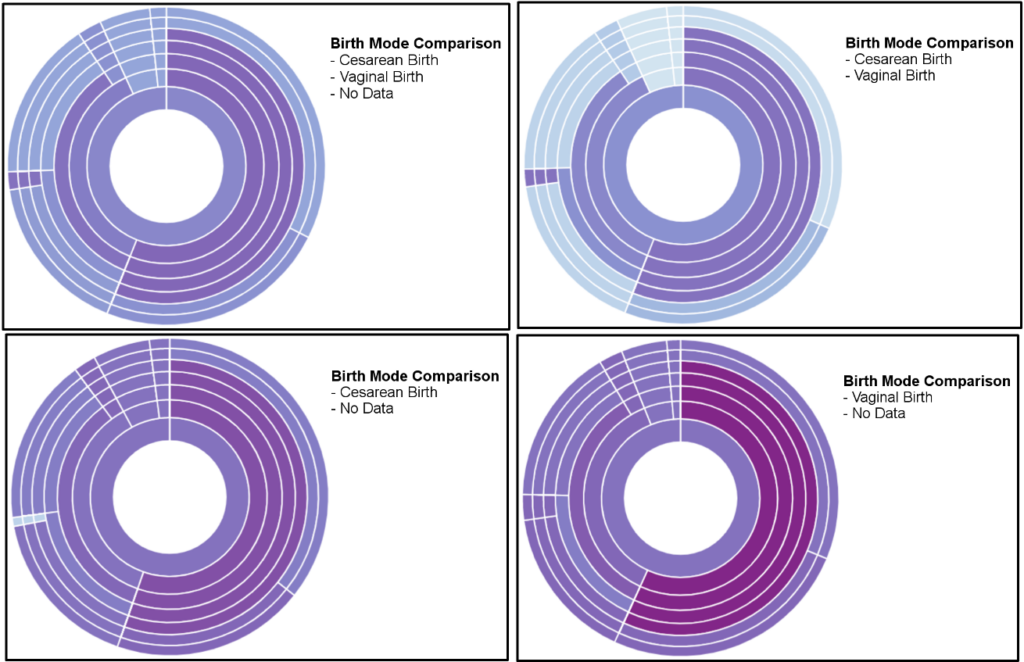
Mobilise-D: Exploring mobility data to support health monitoring
Apr. 2019 – Jun. 2024
This project explores how to represent heterogeneous mobility data to support health monitoring.
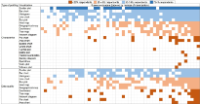
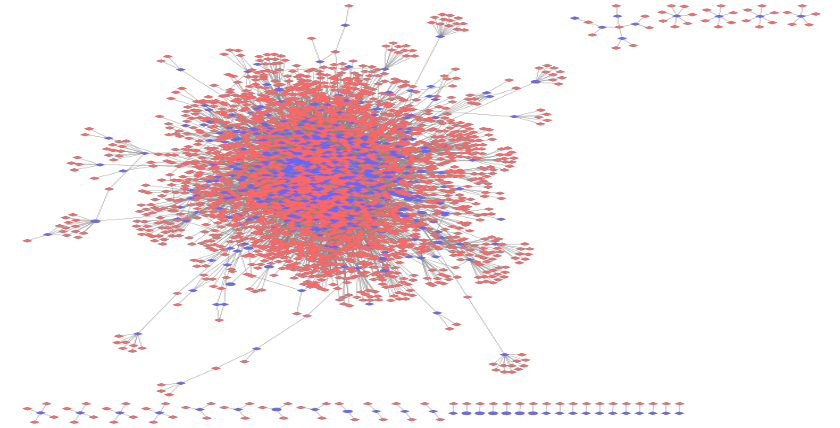
Improving the usability of complex biological networks
Jan. 2020 – Apr. 2024
This PhD project focuses on improving the usability of complex biological networks through interestingness measures and interactive visualization
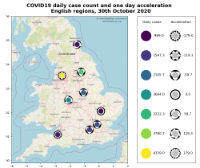
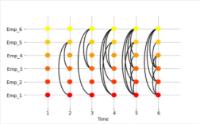
Temporal Network (Re-)Design Strategies for Early Epidemic Containment
This project developed a system that provides a real-time recommendation to minimise the infection rate/propagation of COVID-19 in Saudi Arabian firms.
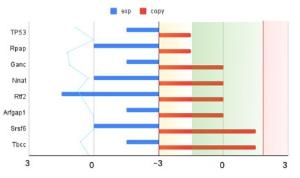
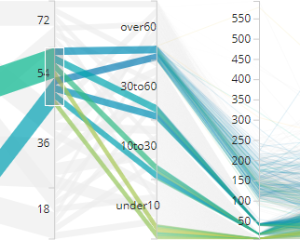
Hierarchical Visualization of High Dimensional Data
Sept. 2017 – Apr. 2022
This PhD project looked to support the user-driven exploration and analysis of high dimensional ‘omics type data.
Visual Entropy and the Visualization of Uncertainty
The aim of this project was to develop and evaluate a system of glyphs that included the visualisation of uncertainty in the data using visual entropy.