Information of our papers and where to find the data products are found here. If you want to look up results on an object-by-object basis see the Sample page.
- Njeri+26: “The Quasar Feedback Survey: Revealing the importance of sensitive radio imaging deeper into the radio quiet regime“
In this paper we introduce QFeedS-2, an extension of QFeedS-1 down to lower radio luminosities. It constitutes 29 new targets, for which we obtained Very Large Array (VLA) data in both he C-band and L-band. We find widespread evidence of AGN-driven synchrotron activity. Nearly 31% exhibit resolved radio structures on ~0.1- 10 kpc scales consistent with compact jets or wind-driven outflows, and ~90% display steep spectra indicative of optically thin synchrotron emission. - Njeri+25: “The Quasar Feedback Survey: zooming into the origin of radio emission with e-MERLIN”
This paper presents high resolution (~10-100pc) high frequency radio images of the 42 targets in the Quasar Feedback Survey. This pushed the resolution a factor of 3-10 times higher than previously possible. We investigate the spatial distribution of the radio emission and the brightness temperatures. We used the combined analysis to assess the origin of the radio emission, in this sample of pre-dominantly radio-quiet quasars. - Girdhar+24: “The Quasar Feedback Survey: molecular gas affected by central outflows and by ~10 kpc radio lobes reveal dual feedback effects in `radio quiet’ quasars“
This paper presents spatially-resolved CO(3-2) measurements from ALMA for 4 of the QFeedS targets, which have radio lobes on >10kpc scales. All four are classified as `radio quiet’ by traditional methods, but have known radio emission associated with the AGN. We investigate the distribution and kinematics of the molecular gas on both the central ~kpc scales and the larger ~10kpc scales.
- Molyneux+24: “The Quasar Feedback Survey: characterising CO excitation in quasar host galaxies“
This paper presents CO SLEDs for 17 Type 2 AGN from the survey, which also have MUSE data. Emission-line fluxes are obtained from ALMA/ACA and APEX, for CO(1-0), CO(2-1), CO(3-2), CO(6-5) and CO(7-6), although not all targets are covered in all transitions. Overall we find that the CO SLEDs are similar to low-redshift Ultra Luminous Infrared Galaxies, in line with their typical star-forming properties and are less excited that high redshift quasars.
- Silpa,S.+22: “The Quasar Feedback Survey: Revealing the Interplay of Jets, Winds & Emission Line Gas in Type 2 Quasars with Radio Polarization”
This paper looks at the spatially-resolved radio polarization measurements in five of the QFeedS targets, with four showing polarization. The polarization structures are compared to the ionised gas. We detect 0.5−1 per cent fractional polarization in the radio cores and a high fractional polarization (10−30 per cent) in the lobes of these sources. The current work demonstrates that the interplay of jets/winds and emission-line gas is most likely responsible for the nature of radio outflows in radio-quiet AGN.
- Girdhar+22: “Quasar Feedback Survey: Multi-phase outflows, turbulence and evidence for feedback caused by low power radio jets inclined into the galaxy disk”
This paper is a extensive multi-wavelength study of one target. Despite the powerful quasar, it is the small jets, inclined into the disk, that are driving outflows and high levels of turbulence in the interstellar medium. Evidence for feedback by the jets on the stellar kinematics is also observed.
- Jarvis+21: “The Quasar Feedback Survey: Discovering hidden Radio-AGN and their connection to the host galaxy ionised gas”
This paper introduces the full survey and presents VLA imaging for 42 quasars. The prevalence of radio emission associated with AGN is high, despite the sample being classified as ‘radio quiet’ using traditional classification schemes.
- Jarvis+20: “High molecular gas content and star formation rates in local galaxies that host quasars, outflows, and jets“
APEX CO(2-1) and CO(6-5) for 9 pilot quasars
- Jarvis+19: “Prevalence of radio jets associated with galactic outflows and feedback from quasars“
VLA+eMERLIN+GMOS/VIMOS data for 10 quasars (9 of which are part of the final Quasar Feedback Survey sample). These data reveal a high prevalence of radio jets interacting with the host galaxy ionised gas (despite the sources being traditionally classified as ‘radio quiet’).
- Lansbury+18: “Storm in a Teacup: X-Ray View of an Obscured Quasar and Superbubble“
Chandra data for Teacup AGN (J1430+1339). Signatures of hot gas bubbles are observed and the AGN appears to be more powerful than previously thought.
- Harrison+15: “Storm in a “Teacup”: A Radio-quiet Quasar with ≈10 kpc Radio-emitting Bubbles and Extreme Gas Kinematics”
VLA+VIMOS data for Teacup AGN (J1430+1339). This revealed the first evidence for giant radio bubbles and an inner ~kpc radio structure (jet?), causing high levels of disturbance in the ionised gas.
More Detail On Specific Publications
Njeri+26
“The Quasar Feedback Survey: zooming into the origin of radio emission with e-MERLIN”
MNRAS (2026), in press, arXiv:2601.09218
DATA: all of the radio maps, spectral index maps and sets of figures for individual targets are available at: https://doi.org/10.25405/data.ncl.c.8110946
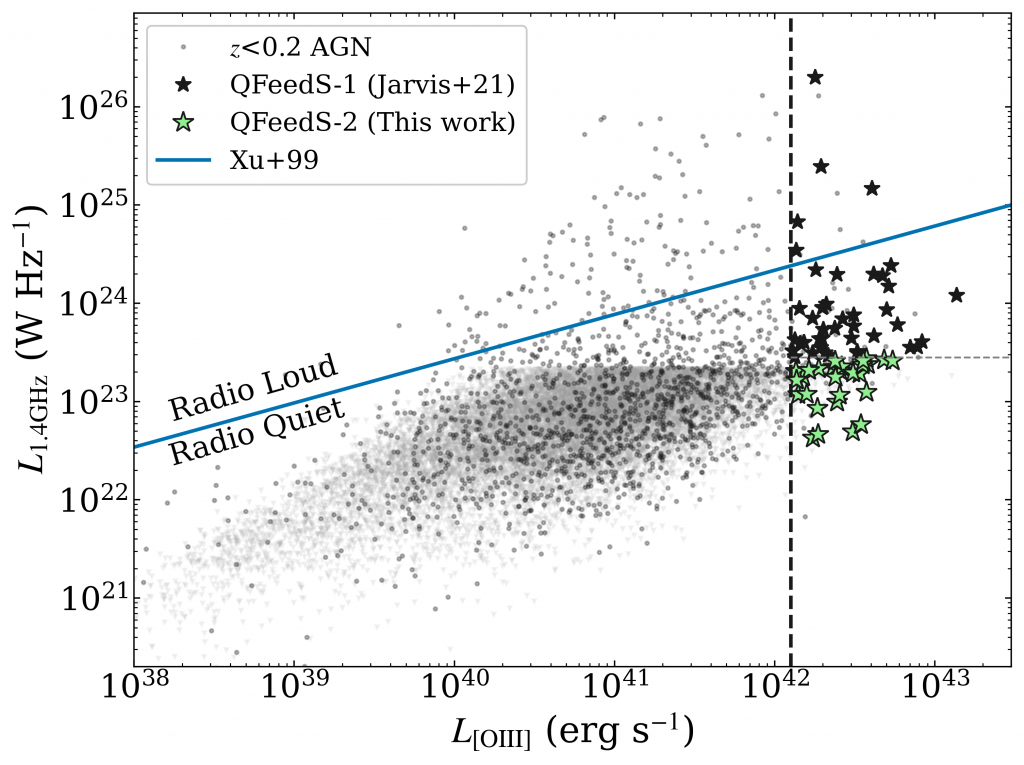
This paper expands the Quasar Feedback Survey to lower radio luminosities. This new part of the survey, QFeedS-2, pushes down much deeper into the radio quiet regime of optically-selected AGN compared to the original part of the survey (QFeedS-1, which was fully introduced in Jarvis+21). We keep the primary selection of Type 1 or Type 2 AGN identified in SDSS spectroscopy (from Mullaney et al. 2013), a low redshift of z<0.2, and a high [O III] luminosity (>1042.1 erg/s). The new sample of 29 sources means we now have a combined sample of 71 targets across the whole survey.
We observed the QFeedS-2 sample with the Very Large Array (VLA) at both 1.4GHz (L-band) and at 6GHz (C-band), with the A-array, reaching ~1 arcsecond and ~0.3 arcsecond spatial resolution, respectively. We find a range of morphologies on these scales. The majority (~70 per cent) are compact, showing no visible structures, but ~30 per cent show resolved structures on 0.1-20kpc scales, consistent with compact jets or wind-driven outflows.
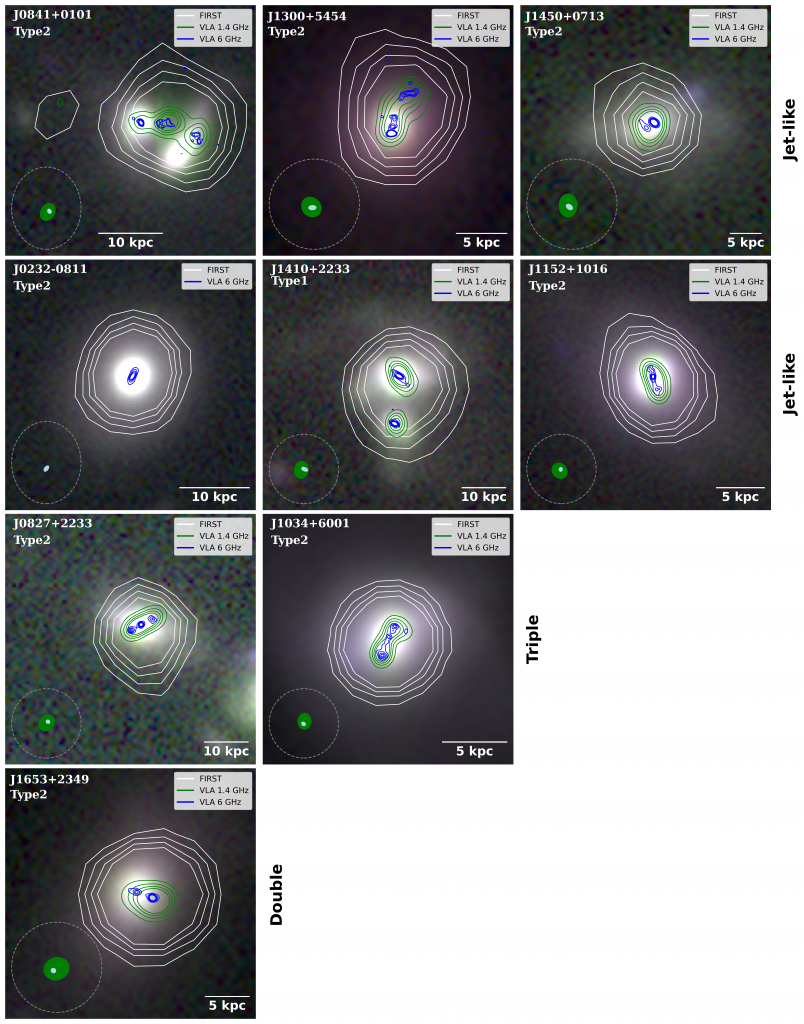
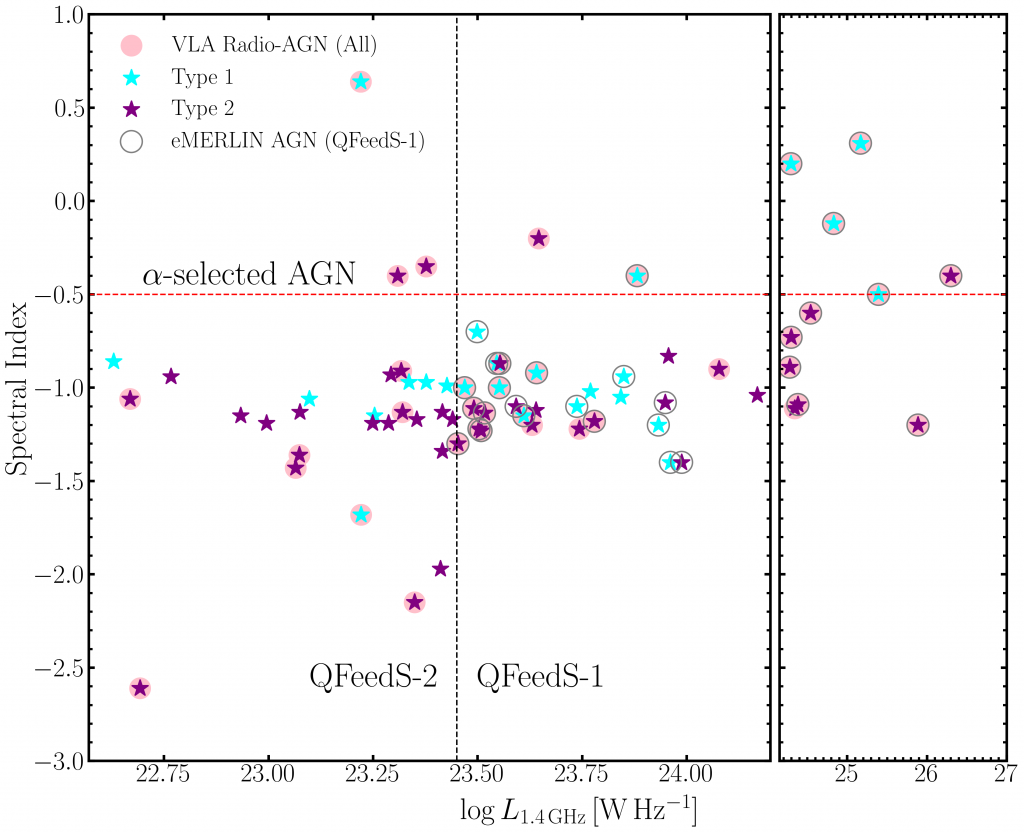
By combining an analysis of brightness temperatures, radio morphologies and spectral index measurements, we conclude that at least ~38 per cent of the QFeedS-2 sample contain radio AGN signatures. For the other ~62 per cent we lack the required sensitivity or multi-wavelength data to rule our AGN-related processes driving the radio emission. Looking at the combined QFeedS sample, both sub-samples (QFeedS-1 and QFeedS-2) are dominated by steep spectrum emission; however, flatter-spectrum sources are more common at higher luminosities (QFeedS-1), for the Type 1 quasars, consistent with an increased contribution from compact AGN-related cores. Furthermore, based on follow-up observations of QFeedS-1 with the higher spatial resolution e-MERLIN, we could expect more AGN to be found in QFeedS-2 with higher resolution observations.
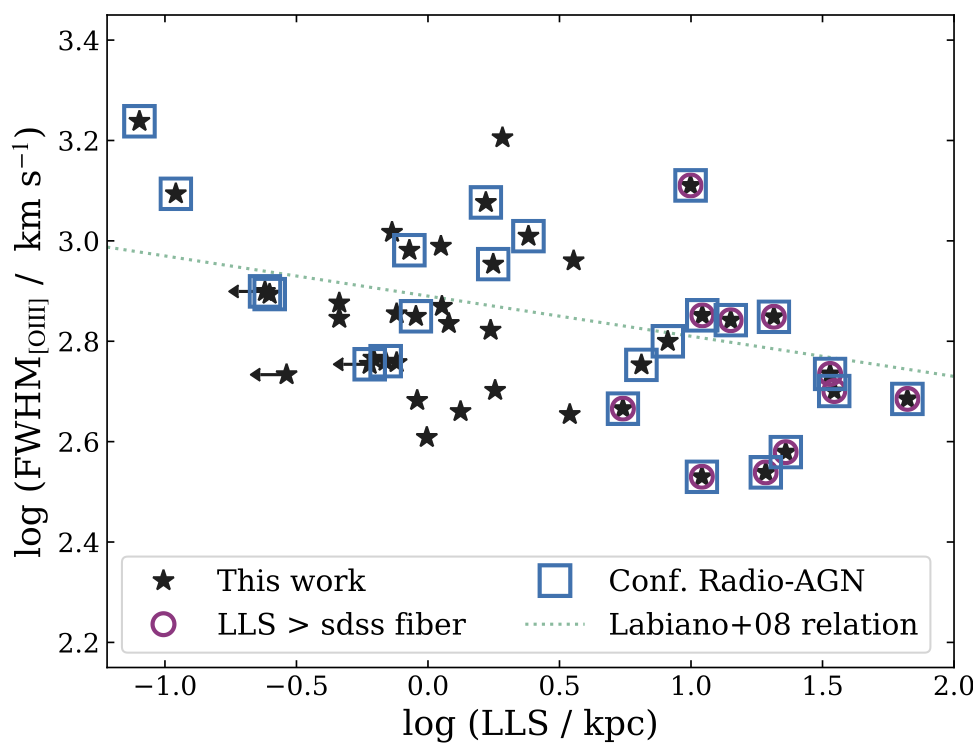
denote Type 1 quasars and purple stars denote Type 2 quasars. Solid circles highlight quasars identified as radio-AGN based on the criteria used in this work. Open circles mark QFeedS-1 sources identified as radio-AGN based on follow-up higher resolution e-MERLIN radio imaging.
Njeri+25
“The Quasar Feedback Survey: zooming into the origin of radio emission with e-MERLIN”
MNRAS, 537, 705 (2025); arXiv: 2501.03433
DATA: all of the radio maps produced for this work are available at https://doi.org/10.25405/data.ncl.c.7523193
This paper presents high resolution (~10-100pc) high frequency radio images of the 42 targets in the Quasar Feedback Survey. This pushed the resolution a factor of 3-10 times higher than previously possible. We investigate the spatial distribution of the radio emission and the brightness temperatures. We used the combined analysis to assess the origin of the radio emission, in this sample of pre-dominantly radio-quiet quasars. We find 37/42 quasars are detected, with a diversity of radio morphologies, including compact cores, knots and extended jet-like structures, with sizes of 30-540 pc. However, on average, ∼60 per cent of the total radio flux is resolved away in the e-MERLIN maps, and is likely dominated by jet-driven lobes and outflow-driven shocks.
Combining results from e-MERLIN and the Very Large Array, 86 per cent reveal a radio-AGN.
We find no significant differences in measured radio properties between type 1 and type 2 quasars, and estimate sub-relativistic jet speeds of ∼0.2-0.3c and modest jet powers of Pjet≈1043 erg s-1, for the few targets, where these measurements were possible. These quasars share characteristics with compact radio-selected populations, and the global radio emission likely traces strong interactions between the AGN (jets/outflows) and their host galaxy ISM from 10s parsec to 10s kiloparsec scales.
Girdhar+24
“The Quasar Feedback Survey: molecular gas affected by central outflows and by ~10 kpc radio lobes reveal dual feedback effects in `radio quiet’ quasars”
MNRAS, 527, 9322; arXiv: 2311.03453
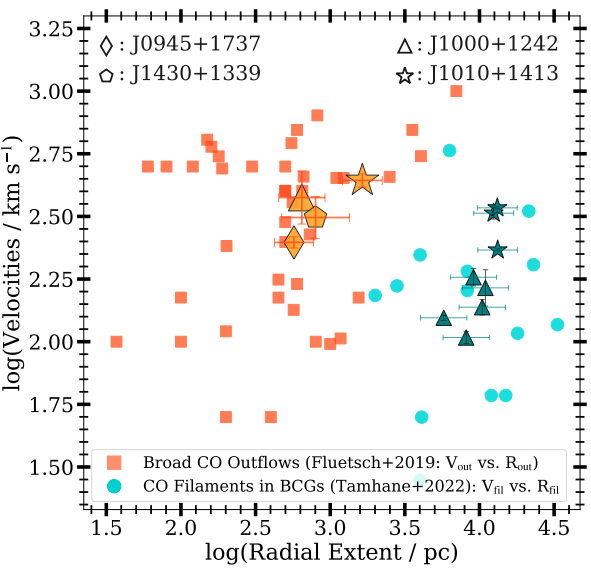
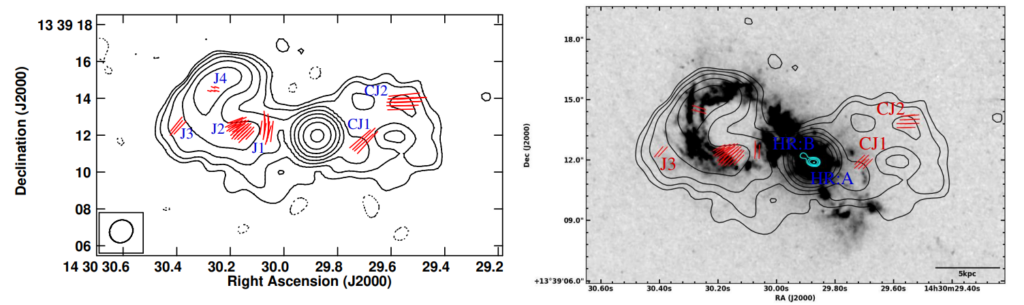
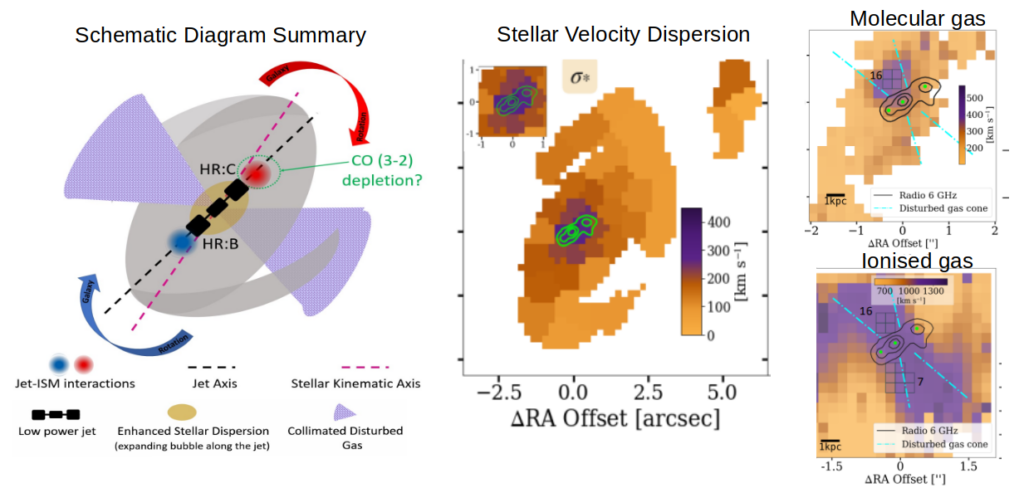
This paper presents ALMA results of four QFeedS targets, which have radio lobes on >10kpc scales. All four are classified as `radio quiet’ by traditional methods, but have known radio emission associated with the AGN. We investigate the distribution and kinematics of the molecular gas, traced via CO(3-2), on both the central ~kpc scales and the larger ~10kpc scales. We find that 2/4 targets show filamentary structures wrapping around, and along, the expanding radio lobes. The properties of these structures are consistent with those seen in Brightest Cluster Galaxies (BCGs).
All four targets show central high-velocity wing components in the CO(3-2) emission-line profiles, consistent with central outflows. The properties of these kinematic components are consistent with those seen in other samples of AGN. In contrast to most previous work, we have simultaneously revealed the impact of large-scale radio lobes and central outflows on the molecular gas. This implies feedback effects on two spatial scales, in the same sources.
Molyneux+24
“The Quasar Feedback Survey: characterising CO excitation in quasar host galaxies”
MNRAS, 527, 4420; arXiv: 2310.10235
DATA: A combined table containing all of the measured and derived quantities, plus all of the 1D spectra covering the various CO emission line transitions is available here at: data.ncl.ac.uk
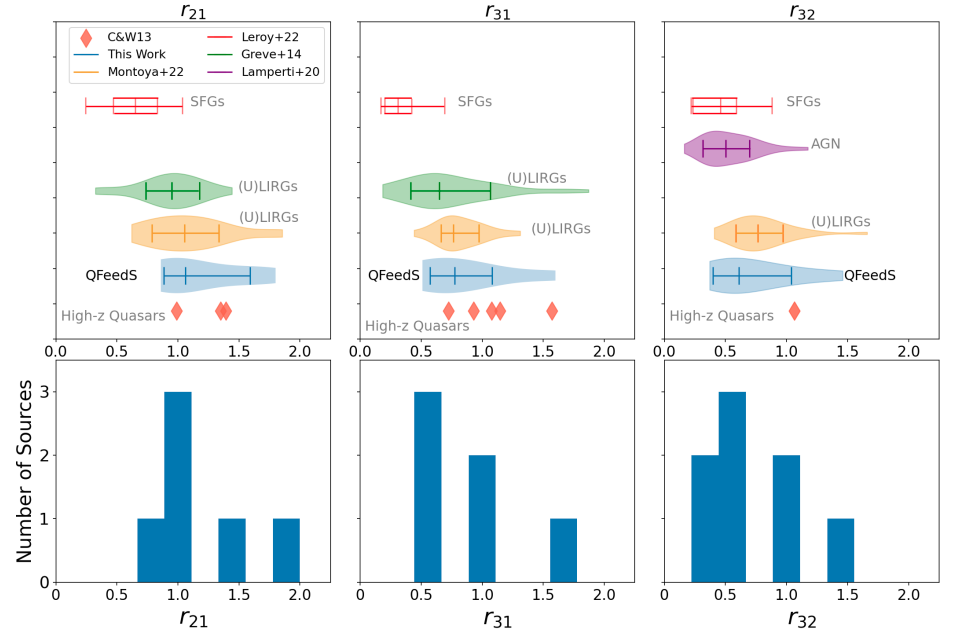
In this paper we explore 17 type 2 QFeedS targets. Using APEX and ALMA ACA observations, we measure the total molecular gas content using the CO(1-0) emission and homogeneously sample the CO spectral line energy distributions (SLEDs), observing CO transitions (Jup = 1, 2, 3, 6, 7). We observe high r21 ratios (r21 = L’CO(2−1)/L’CO(1−0)) with a median r21 = 1.06, similar to local (U)LIRGs (with r21 ∼ 1) and higher than normal star-forming galaxies (with r21 ∼ 0.65). Despite the high r21 values, for the 7 targets with the required data we find low excitation in CO(6-5) and CO(7-6), unlike high redshift quasars in the literature, which are far more luminous and show higher line ratios. The ionised gas traced by [OIII] exhibit systematically higher velocities than the molecular gas traced by CO. We conclude that any effects of quasar feedback (e.g. via outflows and radio jets) do not have a significant instantaneous impact on the global molecular gas content and excitation and we suggest that it only occurs on more localised scales, as shown in our other work (e.g., Girdhar+22,23).
Silpa,S.+22
“The Quasar Feedback Survey: revealing the interplay of jets, winds, and emission-line gas in type 2 quasars with radio polarization”
MNRAS, 513, 4208; arXiv:2204.05613
DATA: The Stokes I, Q, U images and spectral index maps (*_ap.fits, *_ap_Q.fits, *_ap_U.fits and *_alpha_blank.fits, respectively) of the 5 individual sources presented in this work and a rotation measure image of J0945+1737, are all available at: data.ncl.ac.uk.
We present results from a combined radio polarization and emission-line study of five type 2 QFeedS targets. These five sources are known to exhibit close association between radio structures and ionized gas morphology and kinematics. Four sources (J0945+1737, J1000+1242, J1356+1026, and J1430+1339) show polarization in the current data. J1010+1413 is the unpolarized source in our sample. We detect 0.5−1 per cent fractional polarization in the radio cores and a high fractional polarization (10−30 per cent) in the lobes of these sources. The morphological, spectral, and polarization properties suggest a jet origin for radio emission in J0945+1737, J1000+1242, J1010+1413, and J1430+1339 whereas the current data cannot fully discern the origin of radio emission (jet or wind) in J1356+1026. An anticorrelation between various polarized knots in the radio and [O III] emission is observed in our sources, similar to that observed in some radio-loud AGN in the literature. This suggests that the radio emission is likely to be depolarized by the emission-line gas. The current work demonstrates that the interplay of jets/winds and emission-line gas is most likely responsible for the nature of radio outflows in radio-quiet AGN.
Girdhar+22
“The Quasar Feedback Survey: Multi-phase outflows, turbulence and evidence for feedback caused by low power radio jets inclined into the galaxy disk”
MNRAS, 512, 1608; arXiv:2103.00014
DATA: The VLA C-band and L-band maps used in this study (from Jarvis+19) are available here: https://doi.org/10.25405/data.ncl.c.5203919
In this study we present multi-wavelength observations of one of the targets, J1316+1753, including MUSE, ALMA and VLA. The source has small (~1kpc) and low power (Pjet~10^44 erg/s) radio jets that are included into the host galaxy disk. Our data reveal that these jets are causing high levels of outflowing turbulent gas in both the ionised gas and the molecular gas. The ionised gas, traced via [O III], has velocity widths reaching ~1200 km/s, over (at least 7.5kpc). This gas is expanding in an apparent cone above and below the disk. The molecular gas, traced via CO(3-2), has smaller velocity widths of ~400 km/s and extended to about ~4.5kpc. The jets are seen to be strongly interacting with the interstellar medium (ISM) through enhanced ionised emission and disturbed/depleted molecular gas at the jet termini.
We see further evidence for jet-induced feedback through significantly higher stellar velocity-dispersion aligned, and co-spatial with, the jet axis (<5 deg). We discuss how jet-induced feedback could be an important feedback mechanism even in bolometrically luminous ‘radio-quiet’ quasars.
Jarvis+21
“The Quasar Feedback Survey: Discovering hidden Radio-AGN and their connection to the host galaxy ionised gas”
MNRAS, 503, 1780; arXiv:2103.00014 and detailed supplementary information
DATA: The VLA images for the 42 objects from this study are available a Newcastle University’s Data repository. The L-band images are available here; the C-band images are available here and the in-band spectral index maps (from the C-band) are available here. Machine readable versions of the tables are available here.
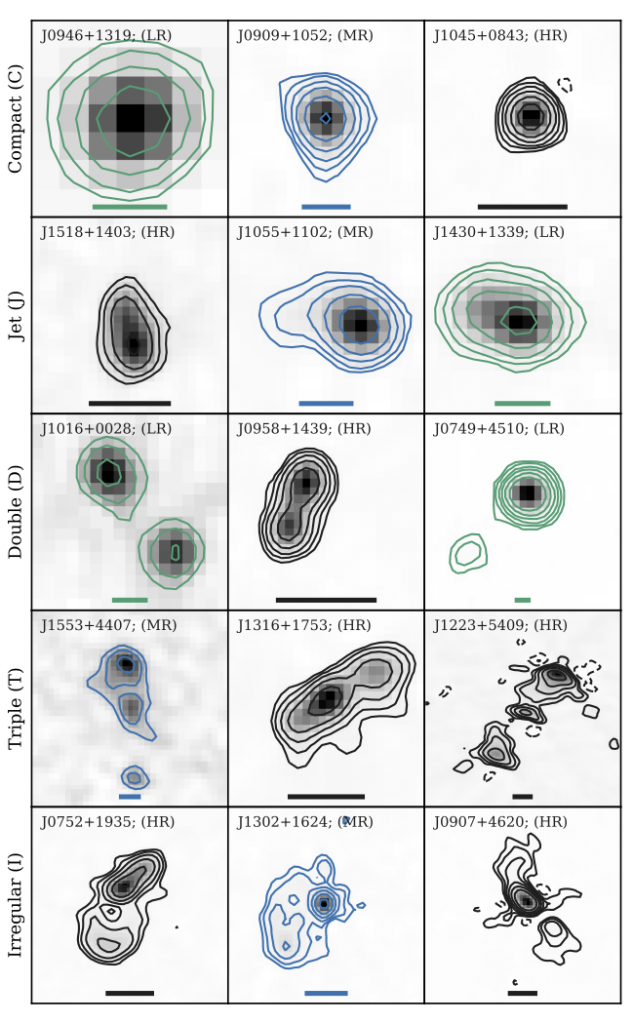
In this paper we present an overview of the survey and VLA images a medium resolution (MR: 1″/L-band/1.4GHz) and high resolution (HR: 0.3″/C-band/6GHz), for all 42 quasars. We also compare these to the low resolution (LR) FIRST images. Example images are show in the figure below which gives an overview of the range of morphologies that we observe. We find that 67% of the sample show extended radio structures on ~1-60 kpc scales. Furthermore, by using a range of criteria, we find a surprisingly high fraction of Radio-AGN in our sample of quasars. At least 57% harbour a Radio-AGN, despite the fact that only 9-21% would be classified as Radio-AGN by traditional criteria. The origin of the radio emission in the remainder of the sample remains ambiguous.
We also demonstrate a relationship between the radio emission and ionised gas properties (traced via [O III]). For example, we see a negative correlation between velocity width of the emission line and the size of the radio emission (see below). This has been observed previously in more powerful Radio-AGN, and is an indication that compact radio emission (either from jets or quasar winds) is having a dramatic impact on the host galaxy gas. Overall our paper shows the important or studying the radio emission at high spatial resolution to understand feedback from quasars – even for low radio luminosity (“radio quiet”) sources.
Jarvis+20 (Pilot Study)
“High molecular gas content and star formation rates in local galaxies that host quasars, outflows, and jets”
MNRAS, 498, 1560 (2020), and arXiv:2007.10351
DATA: The APEX spectra for the nine objects from this study are available a Newcastle University’s Data repository here . This includes the 9 targets with CO(2-1) emission-line data and the 3 targets with CO(6-5) emission-line data. We also provide a small python script to plot the data. Machine readable versions of the main tables can be found here. All data products available from this study are available at the following DOI link: https://doi.org/10.25405/data.ncl.c.5207720
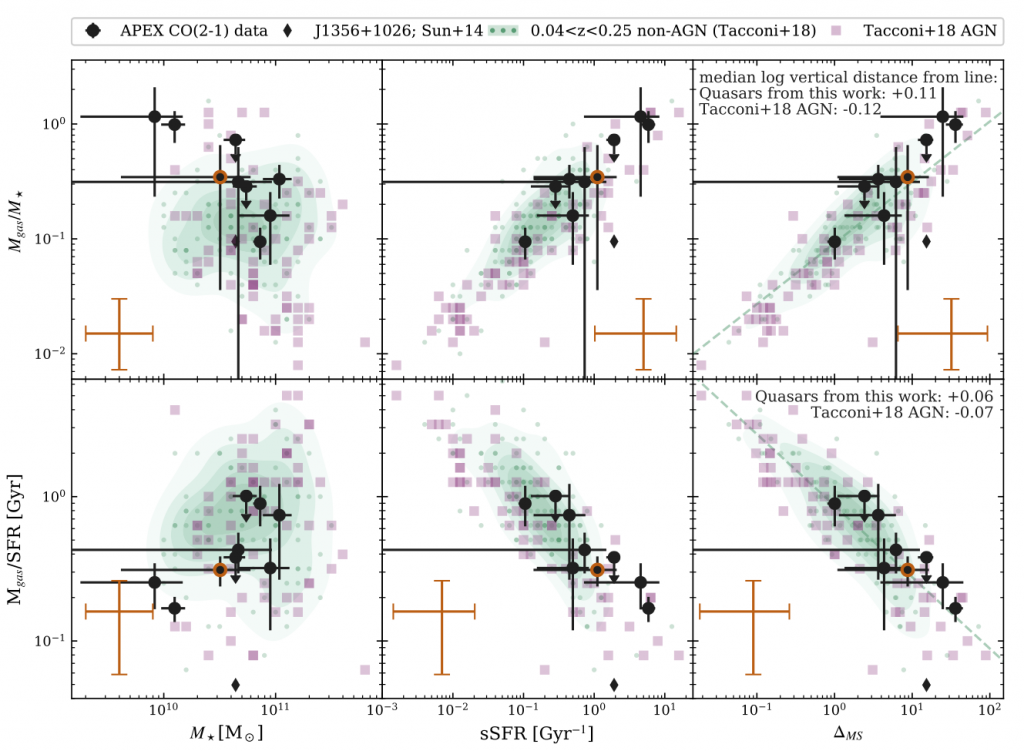
In this paper we obtained APEX observations of the CO(2-1) emission line of the 9 pilot quasars and CO(6-5) emission line of a subset of 3 of these quasars. We used these observations to measure the total molecular gas content inside the host galaxies. We also used careful analyses of the spectral energy distributions to measure the star formation rates and stellar masses of the host galaxies. Our results show that these powerful quasars at z~0.1 live inside gas rich, star-forming galaxies. Their molecular gas properties and star-formation properties (i.e., their gas fractions and star formation efficiencies) are consistent with the overall galaxy population. Therefore, the jets and ionised outflows that are known to exist in these systems have had no immediate impact on the gas content or star formation rates, at least on a galaxy-wide scale. Furthermore the CO(6-5)/CO(2-1) emission-line ratios for the three objects with the measurement tentatively suggest no extreme excitation of the molecular gas. Nonetheless, we can not rule out that the jets or outflows will have an impact on longer timescales or that they have an impact on smaller, unresolved scales.
Jarvis+19 (Pilot Study)
“Prevalence of radio jets associated with galactic outflows and feedback from quasars”
MNRAS, 485, 2710J , (arXiv:1902.07727).
and detailed supplementary information
DATA: The main radio images (as shown in the figure below), the IFU data cubes and all of the derived [O III] property maps (e.g., velocities and velocity widths) for all 10 targets from this study are available at Newcastle University’s data repository. You can navigate to the individual target’s data products from the objects page or find them through the following DOI link: https://doi.org/10.25405/data.ncl.c.5203919
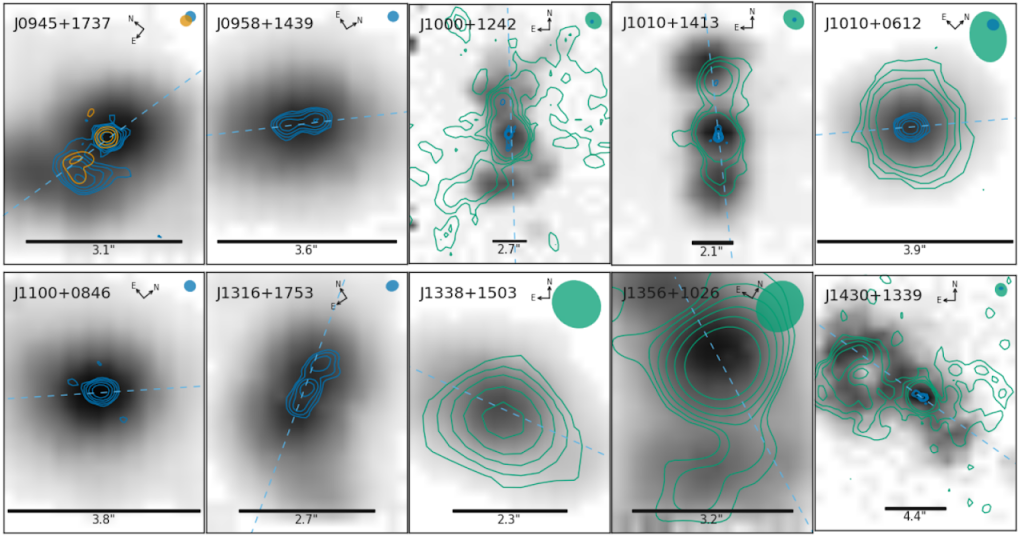
Using the VLA radio interferometer we performed multi-resolution and multi-frequency observations of a sample of 10 quasars (i.e, the most rapidly growing black holes!) at redshift z<0.2. Despite these not being classified as “radio AGN” by most traditional methods, we found that the radio emission is dominated by the AGN (>~90%) in 9 of the 10 targets. Furthermore our high-resolution imaging revealed jet-like structures in at least 8 of these sources, indicating that radio jets are (perhaps surprisingly) prevalent in such systems. The figure shows the distribution of ionised gas ([O III] emission) in the background and the contours show the distribution of radio emission from our various observations.
Lansbury+18 (Pilot Study):
“Storm in a Teacup: X-ray view of an obscured quasar and superbubble“
ApJ,856L,1, arXiv:1803.00009
DATA: The Chandra images and the XMM and Chandra spectra from this study are available to down load from Newcastle University’s data repository at DOI: https://doi.org/10.25405/data.ncl.13387625.v1
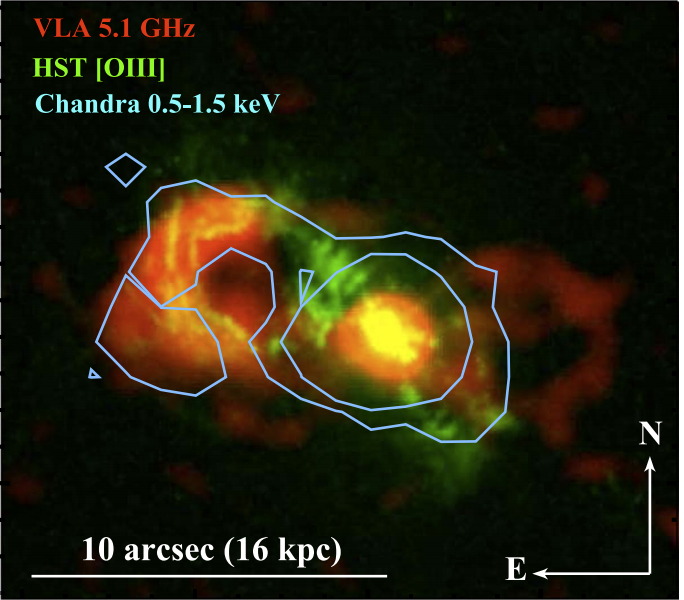
Using Chandra time the team observed the Teacup AGN, which we had previously identified as having large bubbles of ionised gas (green colour in image) and radio emission (red colour in image) to obtain spatially-resolved X-ray measurements. Using these data, in combination with existing XMM-Newton X-ray observations , we obtained the best constraints to date on the bolometric output (and level of obscuring material) of the growing supermassive black hole at the centre of this galaxy. These results revealed that the quasar may not be “fading away” as previously thought, based on earlier less robust constraints on the bolometric output. Furthermore, in the Chandra data we detected the large bubble in X-ray emission (see blue contours in image), providing tentative evidence for a very hot outflowing gas component within the bubble. This source appears to be showing outflows in multiple phases of gas, driven by the supermassive black hole lurking at its centre.
Chandra Popular Releases about publication:
- “Storm Rages in Cosmic Teacup” (image and article)
- “Storm Rages in Cosmic Teacup” (videos)
Harrison+15 (Pilot Study)
“Storm in a ‘Teacup’: A Radio-quiet Quasar with ≈10 kpc Radio-emitting Bubbles and Extreme Gas Kinematics“
ApJ, 800, 45 (2015), (arXiv:1410.4198)
DATA: The various radio images used in Harrison+15 are available from Newcastle University’s data repository, here. The DOI link is: https://doi.org/10.25405/data.ncl.13251731
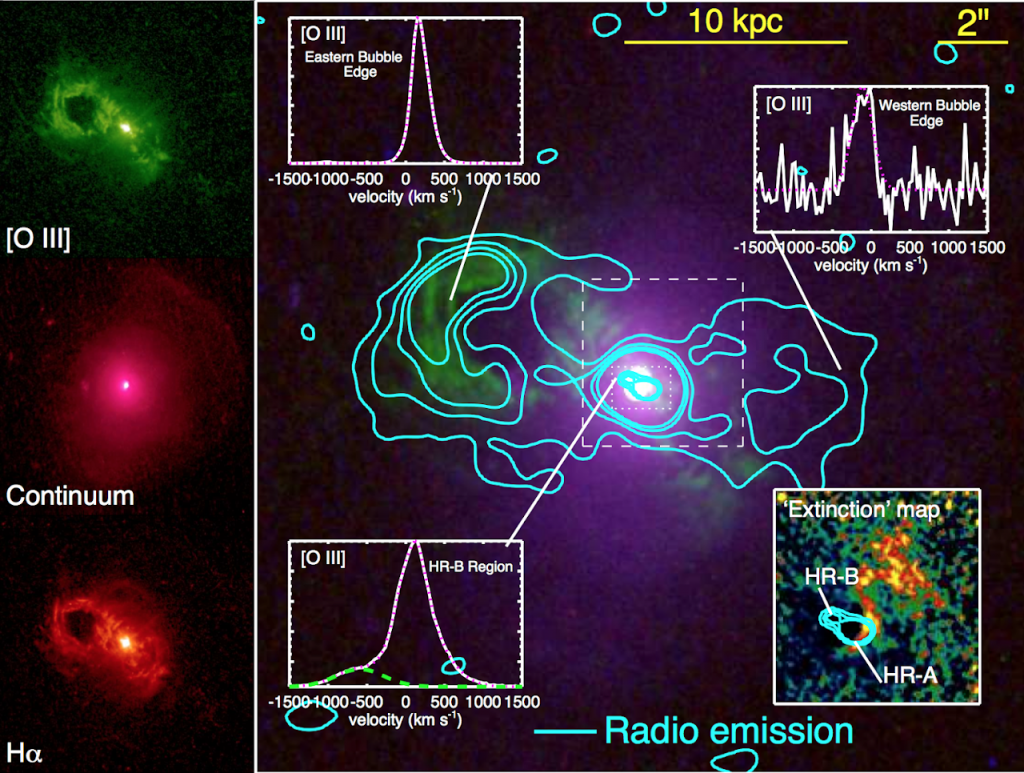
Using the VLA radio interferometer we performed multi-resolution and multi-frequency observations of the Teacup AGN; a z=0.1 radio-quiet quasar. The Teacup AGN was observed by us in 2014 to have a high-velocity gas component ~1kpc from the central core. This is seen in the high-velocity wing of the [O III] emission-line profile at this location (see the inset spectrum at the bottom of the image). Additionally, HST narrow-band imaging reveals a ~10kpc arc of ionised gas to the East (see image). Our new VLA data revealed that both the high-velocity outflow and ionised arc are associated with radio emission. Our interpretation of these results is that a radio jet (or possibly quasar wind) is interacting with the gas ~1kpc from the core and driving the high-velocity outflow. Additionally there are bi-polar radio bubbles being inflated by the central AGN that are interacting with the gas on ~10-12kpc scales. This AGN is “radio-quiet”, which means that its radio luminosity is typical for its optical radio luminosity, and is therefore more representative of the overall population than radio-loud AGN. Our results show in the importance of radio observations for understanding AGN feedback for systems with low radio luminosities. This is the first object from the larger sample that is presented in Jarvis+19,20.
- NRAO Press Release, VLA Finds Unexpected “Storm” at Galaxy’s Core and Durham University Press Release, “Massive black hole causes storm in “Teacup” galaxy”
- Appeared on over 30 news and popular science magazines or websites (across UK, USA, India, Singapore) including: Sky at Night Magazine, Fox News; Astronomy Magazine; Sky and Telescope; the “Top Story” on NSF’s science news and This Week’s “Must Read” on CNET
- Television appearance on “Made in Tyne and Wear” (12th and 14th February 2015)