Here we give:
1. A Sample Overview
2. Results of individual objects in QFeedS-1
Sample Overview
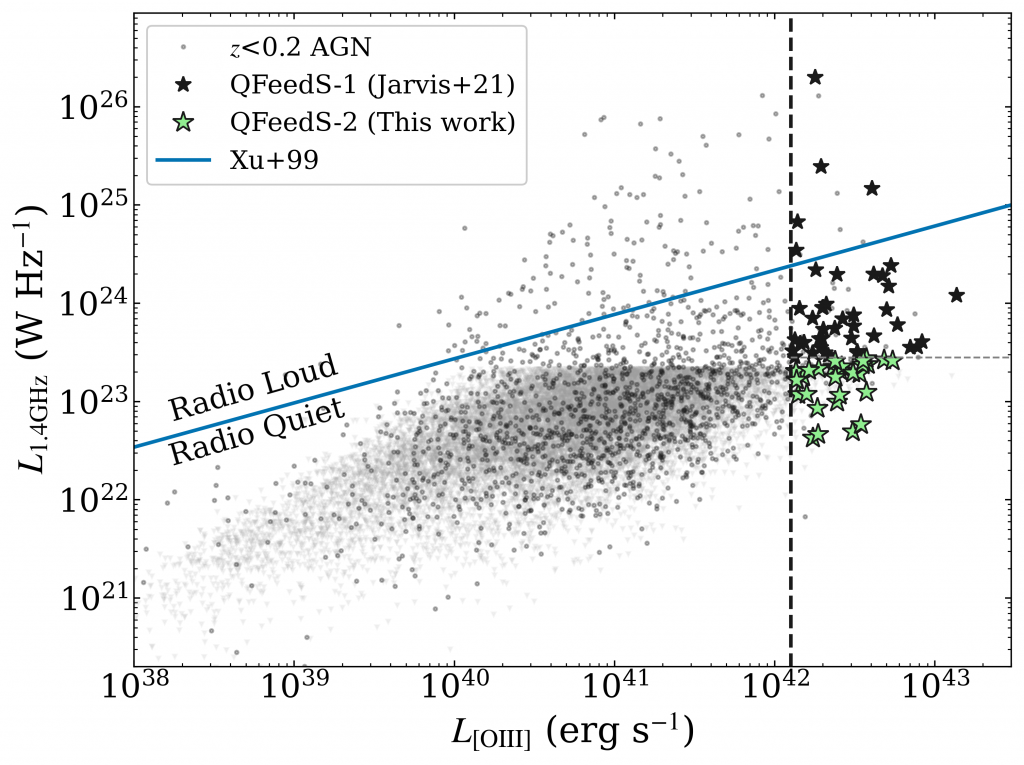
The sample is selected as spectroscopically identified AGN, either Type 2 (from BPT diagnostics) or Type 2 (due to the presence of a broad line region). The basis for the selection is Mullaney et al. (2013) and their analysis of SDSS spectra. All targets are selected to have luminous [O III] emission, with luminosities greater than 1042.11 erg/s. This broadly corresponds to a bolometric luminosity of > 1045 erg/s
The sample is in two parts, QFeedS-1 and QFeedS-2. The former, being the sample which has been studied in the most detail, and constitutes to more radio luminous sub-sample (albeit still dominated by radio quiet sources!). This full sample was introduced in Jarvis et al. (2021), although some of these targets we studied also in earlier works. The latter sample (QFeedS-2) pushes down to lower radio luminosities and is introduced in Njeri et al. (2026). This figure shows [O III] luminosities and 1.4GHz radio luminosities for the parent sample (black points, and grey upper limits), and highlights QFeedS-1 as black stars, and QFeedS-2 as green stars. The blue line shows the boundary between radio loud and radio quiet sources, highlighting that our survey is dominated by `radio quiet’ quasars.
Here we provide information about individual objects. The table below links to more information about the individual objects from our own work. A description of the sample selection is provided in Jarvis et al. (2021). A short written summary of relevant previous works on the targets is described in the supplementary information of Jarvis et al. (2021) (up to date as of 2020) here.
QFeedS-1 Targets
| Name | RA | Dec | z | T | SDSS |
| J0749+4510 | 07:49:06.50 | +45:10:33.9 | 0.19 | 1 | Link |
| J0752+1935 | 07:52:17.84 | +19:35:42.2 | 0.12 | 1 | Link |
| J0759+5050 | 07:59:40.96 | +50:50:24.0 | 0.06 | 2 | Link |
| J0802+4643 | 08:02:24.35 | +46:43:00.6 | 0.12 | 2 | Link |
| J0842+0759 | 08:42:05.57 | +07:59:25.5 | 0.13 | 1 | Link |
| J0842+2048 | 08:42:07.50 | +20:48:40.1 | 0.18 | 1 | Link |
| J0907+4620 | 09:07:22.36 | +46:20:18.0 | 0.17 | 2 | Link |
| J0909+1052 | 09:09:35.49 | +10:52:10.5 | 0.17 | 2 | Link |
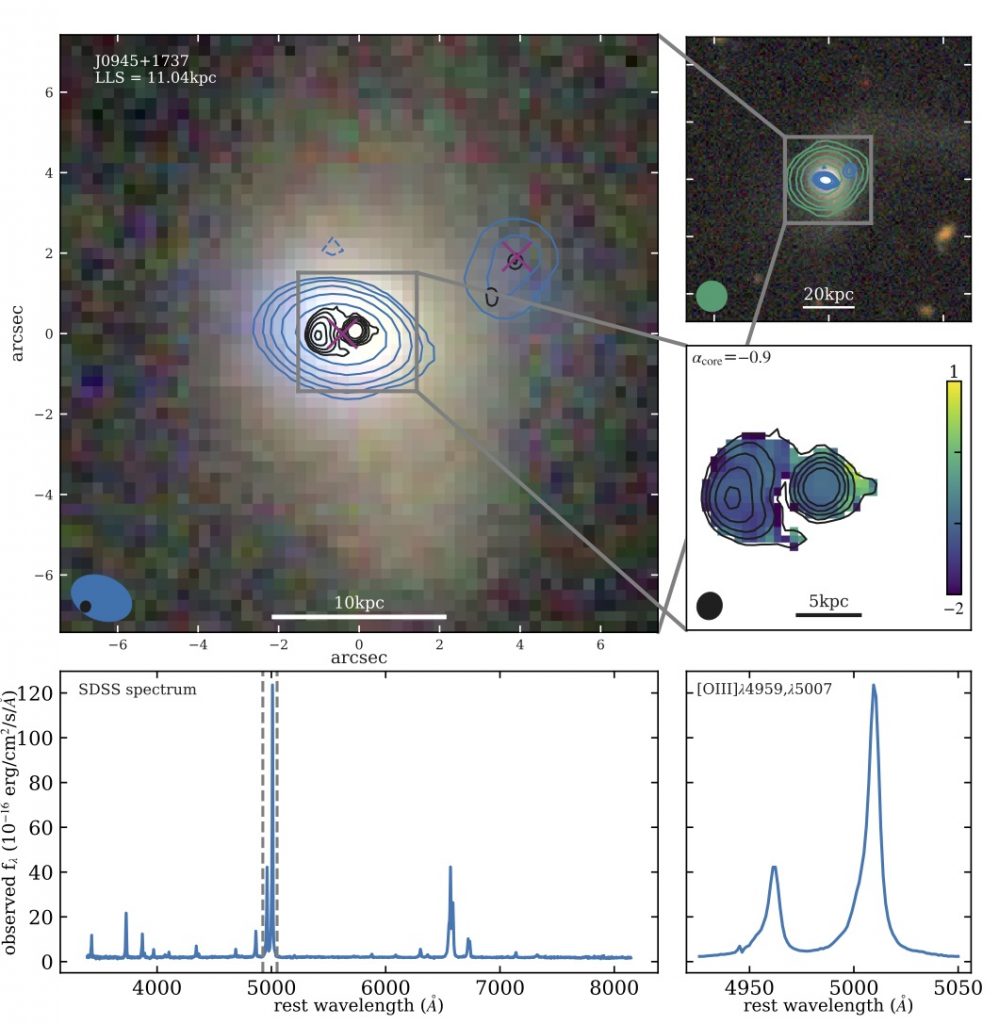
| J0945+1737 | 09:45:21.33 | +17:37:53.2 | 0.13 | 2 | Link |
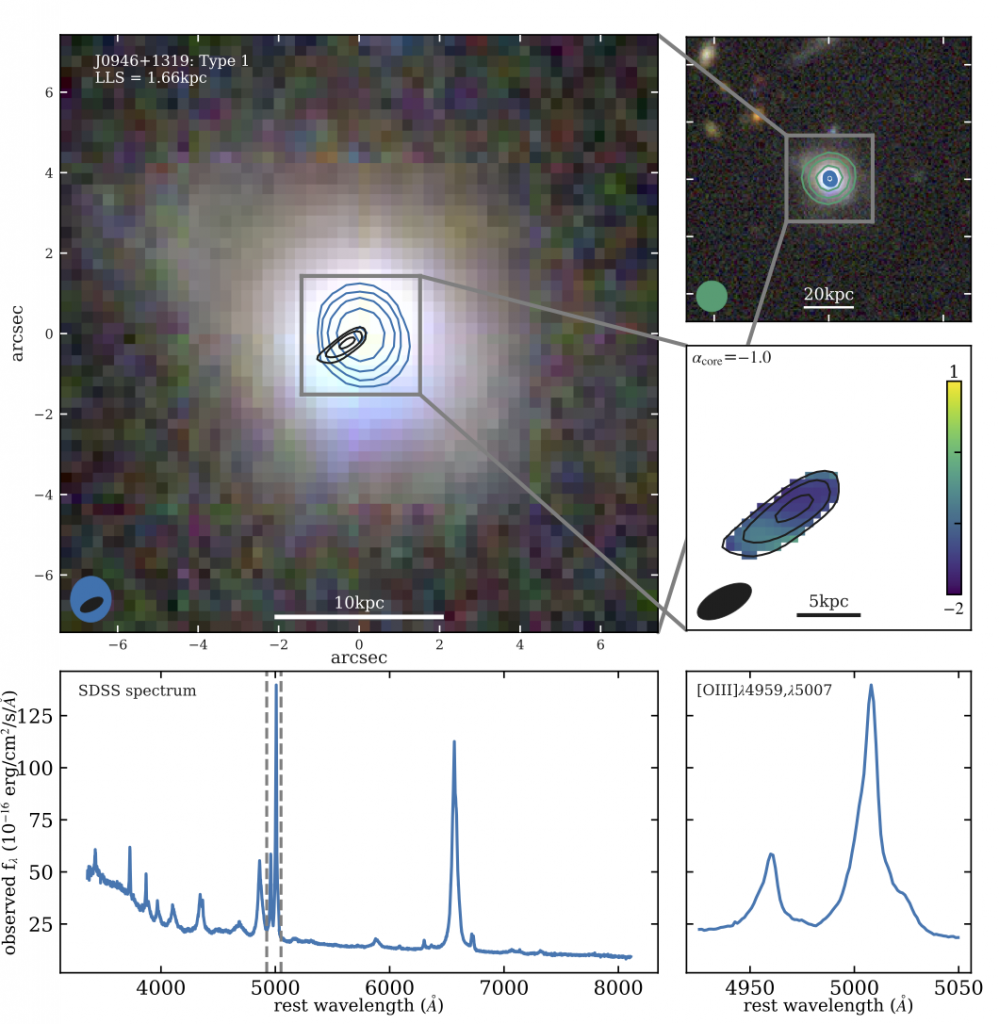
| J0946+1319 | 09:46:52.57 | +13:19:53.8 | 0.13 | 1 | Link |
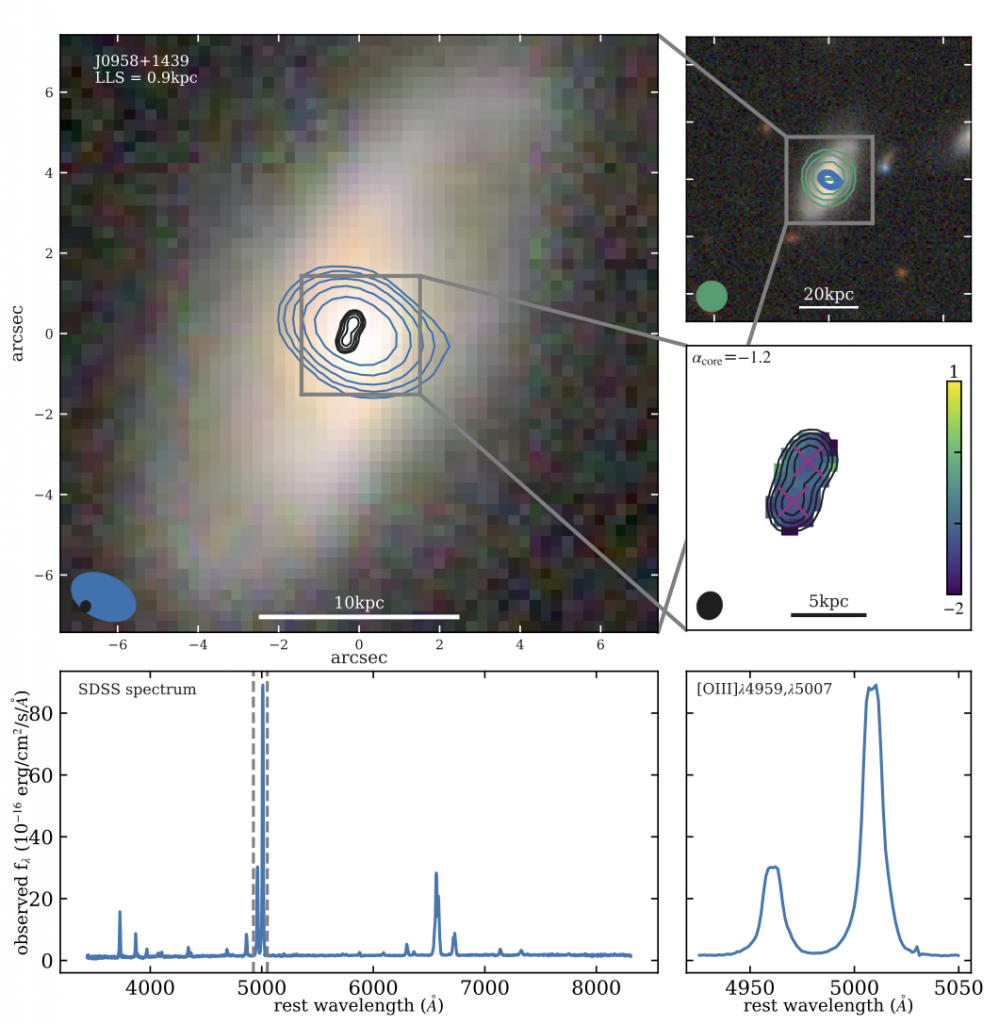
| J0958+1439 | 09:58:16.88 | +14:39:23.7 | 0.11 | 2 | Link |
| J1000+1242 | 10:00:13.14 | +12:42:26.2 | 0.15 | 2 | Link |
| J1010+0612 | 10:10:43.36 | +06:12:01.4 | 0.10 | 2 | Link |
| J1010+1413 | 10:10:22.95 | +14:13:00.9 | 0.20 | 2 | Link |
| J1016+0028 | 10:16:53.82 | +00:28:57.1 | 0.12 | 2 | Link |
| J1016+5358 | 10:16:23.76 | +53:58:06.1 | 0.18 | 2 | Link |
| J1045+0843 | 10:45:05.16 | +08:43:39.0 | 0.13 | 1 | Link |
| J1055+1102 | 10:55:55.34 | +11:02:52.2 | 0.15 | 2 | Link |
| J1100+0846 | 11:00:12.38 | +08:46:16.3 | 0.10 | 2 | Link |
| J1108+0659 | 11:08:51.03 | +06:59:01.4 | 0.18 | 2 | Link |
| J1114+1939 | 11:14:23.81 | +19:39:15.8 | 0.20 | 2 | Link |
| J1116+2200 | 11:16:25.34 | +22:00:49.3 | 0.14 | 2 | Link |
| J1222-0007 | 12:22:17.85 | -00:07:43.7 | 0.17 | 2 | Link |
| J1223+5409 | 12:23:13.21 | +54:09:06.5 | 0.16 | 1 | Link |
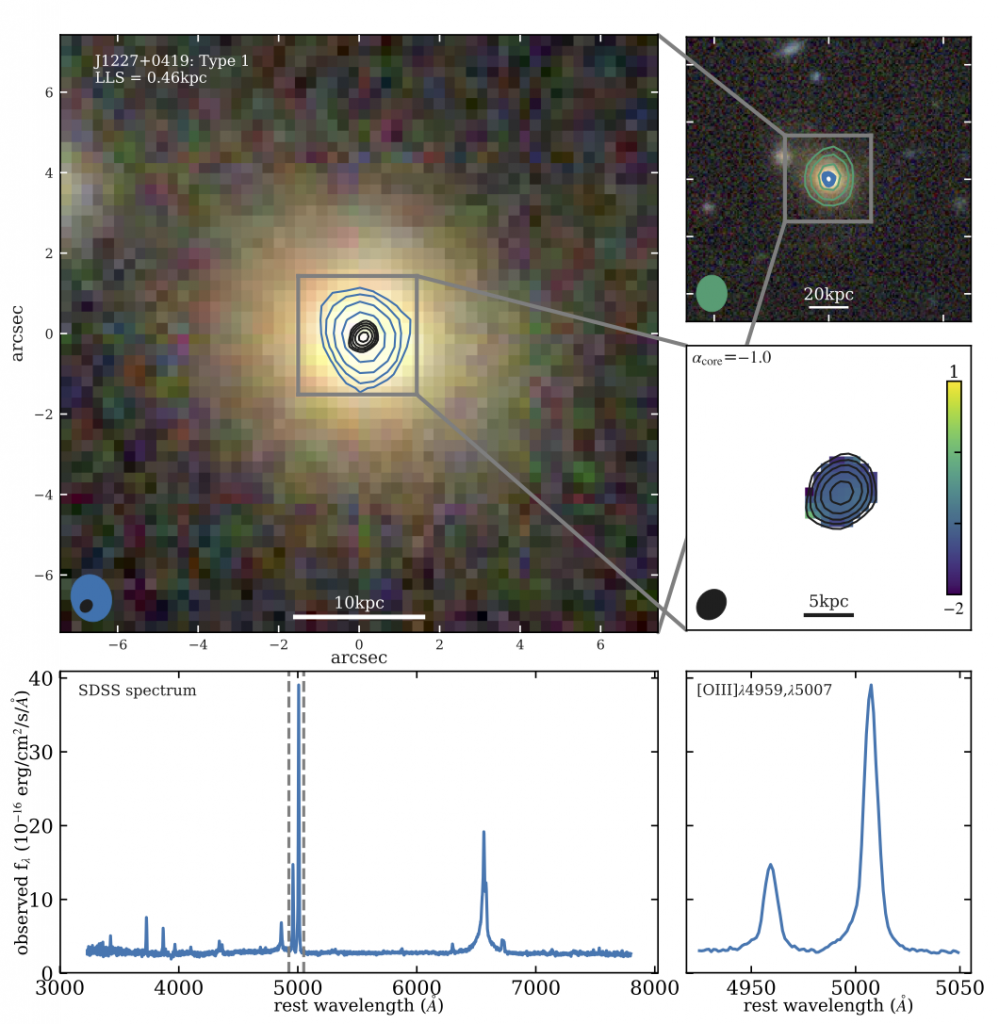
| J1227+0419 | 12:27:39.83 | +04:19:32.4 | 0.18 | 1 | Link |
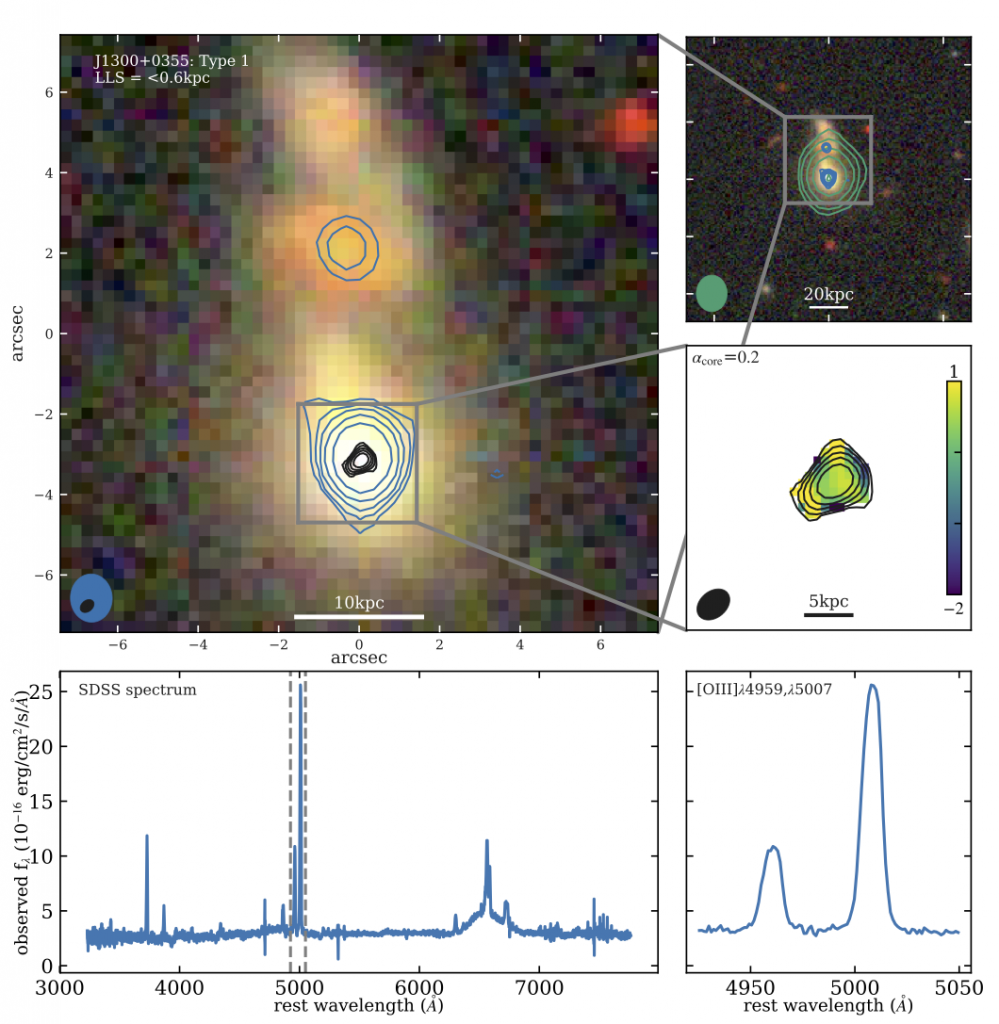
| J1300+0355 | 13:00:07.99 | +03:55:56.5 | 0.18 | 1 | Link |
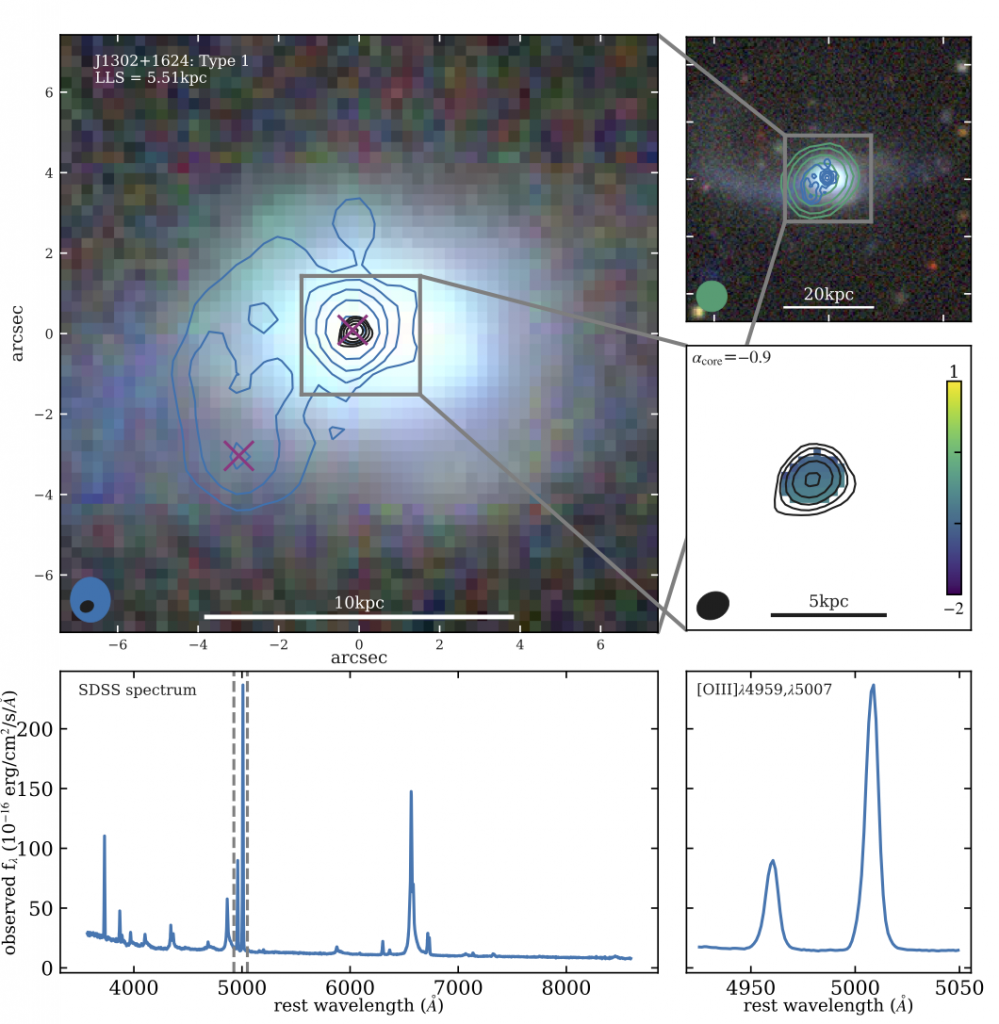
| J1302+1624 | 13:02:58.83 | +16:24:27.7 | 0.07 | 1 | Link |
| J1316+1753 | 13:16:42.90 | +17:53:32.5 | 0.15 | 2 | Link |
| J1324+5849 | 13:24:18.25 | +58:49:11.6 | 0.19 | 1 | Link |
| J1347+1217 | 13:47:33.36 | +12:17:24.3 | 0.12 | 2 | Link |
| J1355+2046 | 13:55:50.20 | +20:46:14.5 | 0.20 | 1 | Link |
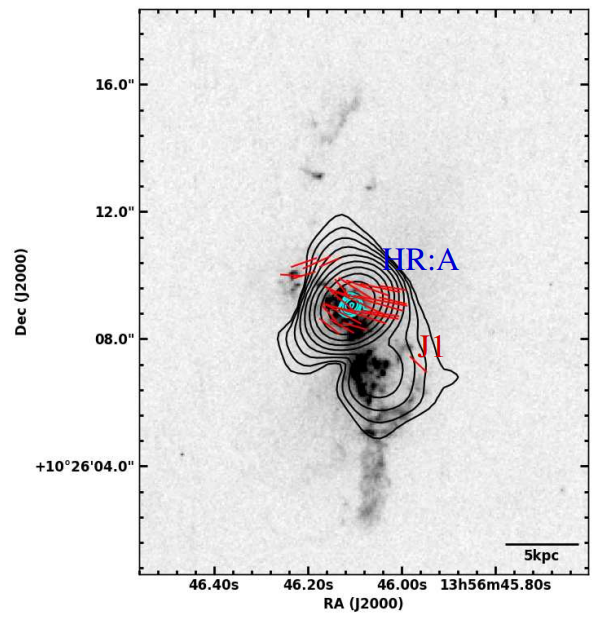
| J1356+1026 | 13:56:46.10 | +10:26:09.0 | 0.12 | 2 | Link |
| J1430+1339 | 14:30:29.88 | +13:39:12.0 | 0.09 | 2 | Link |
| J1436+4928 | 14:36:07.21 | +49:28:58.5 | 0.13 | 2 | Link |
| J1454+0803 | 14:54:34.35 | +08:03:36.7 | 0.13 | 1 | Link |
| J1509+1757 | 15:09:13.79 | +17:57:10.0 | 0.17 | 1 | Link |
| J1518+1403 | 15:18:56.27 | +14:03:19.0 | 0.14 | 2 | Link |
| J1553+4407 | 15:53:15.94 | +44:07:49.3 | 0.20 | 2 | Link |
| J1555+5403 | 15:55:01.44 | +54:03:26.9 | 0.18 | 1 | Link |
| J1655+2146 | 16:55:51.37 | +21:46:01.8 | 0.15 | 1 | Link |
| J1701+2226 | 17:01:58.24 | +22:26:41.9 | 0.20 | 1 | Link |
| J1715+6008 | 17:15:44.05 | +60:08:35.6 | 0.16 | 2 | Link |
QFeedS-2 Targets
| Name | RA | Dec | z | T |
| J0213+0042 | 02:13:59.78 | +00:42:26.8 | 0.182 | 1 |
| J0232-0811 | 02:32:24.25 | -08:11:40.2 | 0.100 | 2 |
| J0827+2233 | 08:27:11.22 | +22:33:24.2 | 0.173 | 2 |
| J0841+0101 | 08:41:35.09 | +01:01:56.3 | 0.111 | 2 |
| J0924+1504 | 09:24:35.36 | +15:04:10.0 | 0.125 | 2 |
| J0947+1005 | 09:47:33.22 | +10:05:08.8 | 0.139 | 1 |
| J1034+6001 | 10:34:08.60 | +60:01:52.2 | 0.051 | 2 |
| J1110+5848 | 11:10:15.25 | +58:48:46.0 | 0.143 | 2 |
| J1141+2156 | 11:41:16.16 | +21:56:21.8 | 0.063 | 1 |
| J1152+1016 | 11:52:45.66 | +10:16:23.8 | 0.070 | 2 |
| J1203+1624 | 12:03:00.20 | +16:24:43.8 | 0.166 | 2 |
| J1300+5454 | 13:00:38.10 | +54:54:36.9 | 0.088 | 2 |
| J1316+4452 | 13:16:39.75 | +44:52:35.1 | 0.091 | 2 |
| J1325+1137 | 13:25:52.16 | +11:37:09.8 | 0.161 | 1 |
| J1338+1503 | 13:38:06.53 | +15:03:56.1 | 0.185 | 2 |
| J1355+5612 | 13:55:16.55 | +56:12:44.7 | 0.122 | 1 |
| J1410+2233 | 14:10:41.50 | +22:33:37.1 | 0.173 | 1 |
| J1419+1144 | 14:19:43.79 | +11:44:26.2 | 0.124 | 2 |
| J1426+1040 | 14:26:14.62 | +10:40:13.0 | 0.137 | 2 |
| J1426+1949 | 14:26:26.93 | +19:49:54.4 | 0.175 | 2 |
| J1434+5016 | 14:34:11.18 | +50:16:40.8 | 0.199 | 2 |
| J1440+5303 | 14:40:38.10 | +53:30:15.9 | 0.038 | 2 |
| J1450+0713 | 14:50:34.12 | +07:31:32.3 | 0.154 | 2 |
| J1507+0029 | 15:07:19.94 | +00:29:05.0 | 0.182 | 2 |
| J1529+5616 | 15:29:07.46 | +56:16:06.7 | 0.100 | 1 |
| J1543+1148 | 15:43:03.83 | +11:48:38.5 | 0.098 | 2 |
| J1653+2349 | 16:53:15.05 | +23:49:43.0 | 0.103 | 2 |
| J1713+5729 | 17:13:50.32 | +57:29:54.9 | 0.113 | 2 |
| J2304-0841 | 23:04:43.48 | -08:41:08.6 | 0.047 | 1 |
QFeedS-1 Individual Targets Results
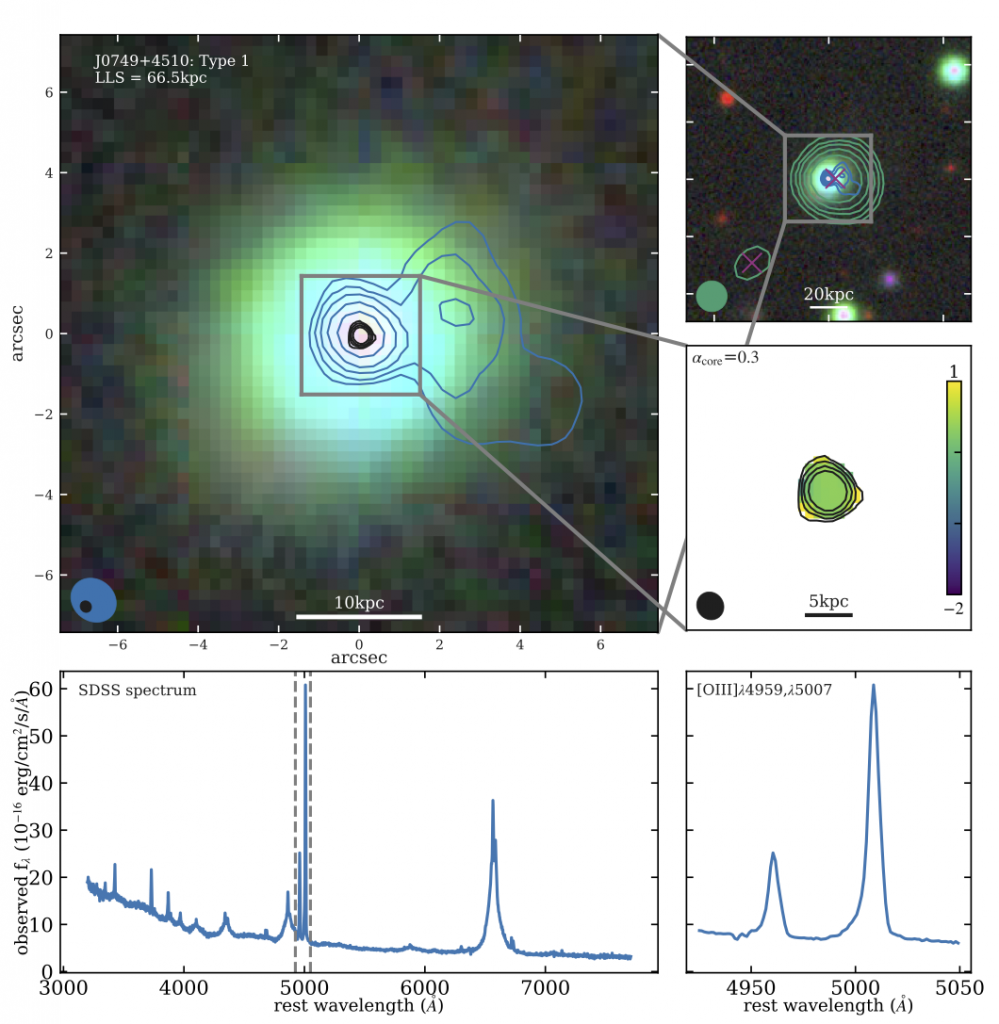
J0749+4510
Radio Data
L-band (1.4GHz) VLA images from Jarvis+21 are available here.
C-band (6GHz) VLA images from Jarvis+21 are available here.
In-band spectral index maps (4-8GHz) from Jarvis+21 are available here.
e-MERLIN 6GHz radio maps from Njeri+25 are available here.
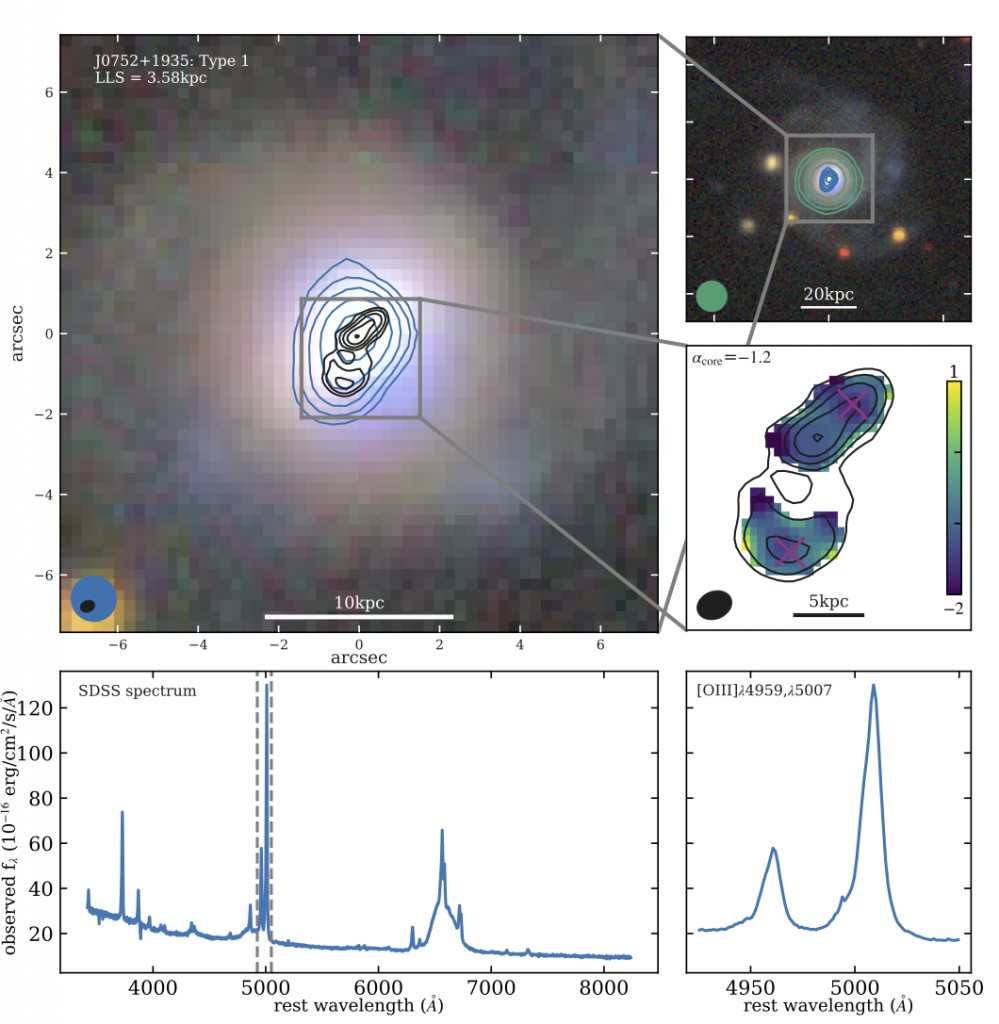
J0752+1935
Radio Data
L-band (1.4GHz) VLA images from Jarvis+21 are available here.
C-band (6GHz) VLA images from Jarvis+21 are available here.
In-band spectral index maps (4-8GHz) from Jarvis+21 are available here.
e-MERLIN 6GHz radio maps from Njeri+25 are available here.
J0759+5050
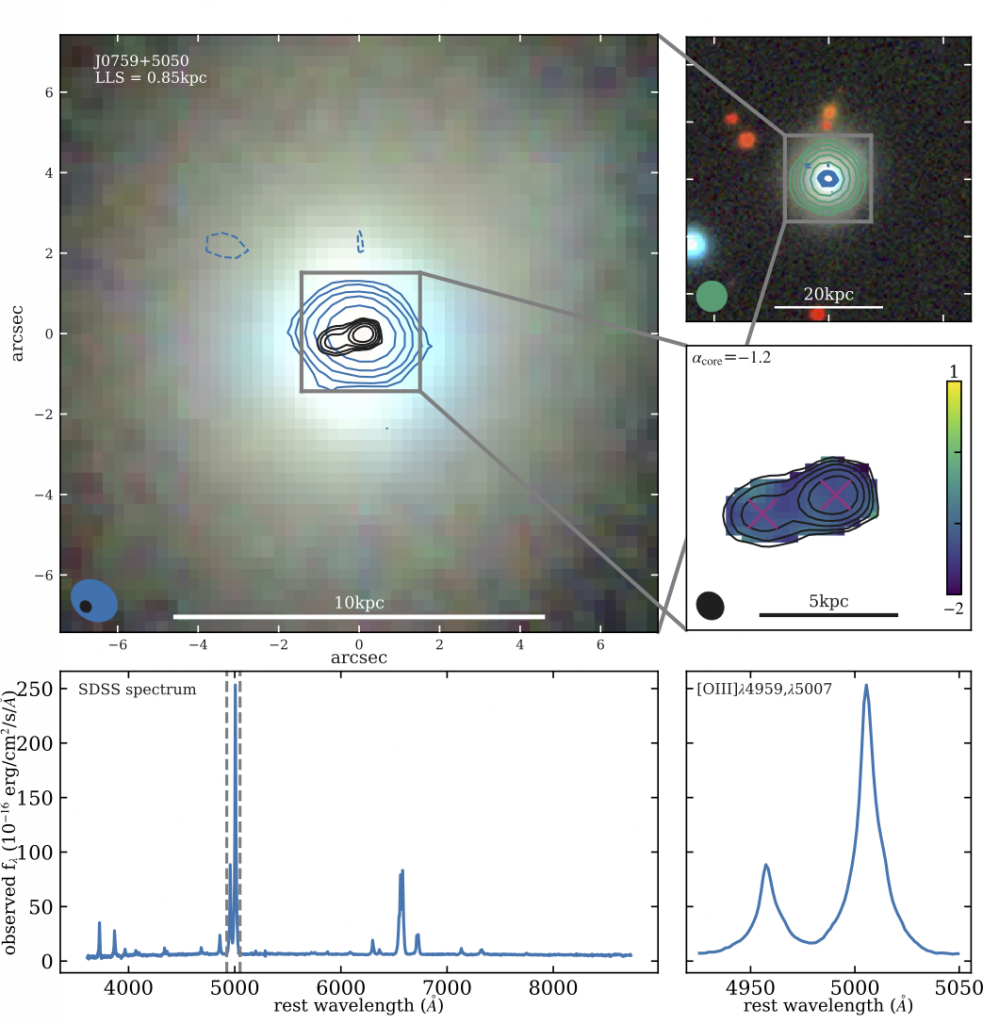
Radio Data
L-band (1.4GHz) VLA images from Jarvis+21 are available here.
C-band (6GHz) VLA images from Jarvis+21 are available here.
In-band spectral index maps (4-8GHz) from Jarvis+21 are available here.
e-MERLIN 6GHz radio maps from Njeri+25 are available here.
J0802+4643
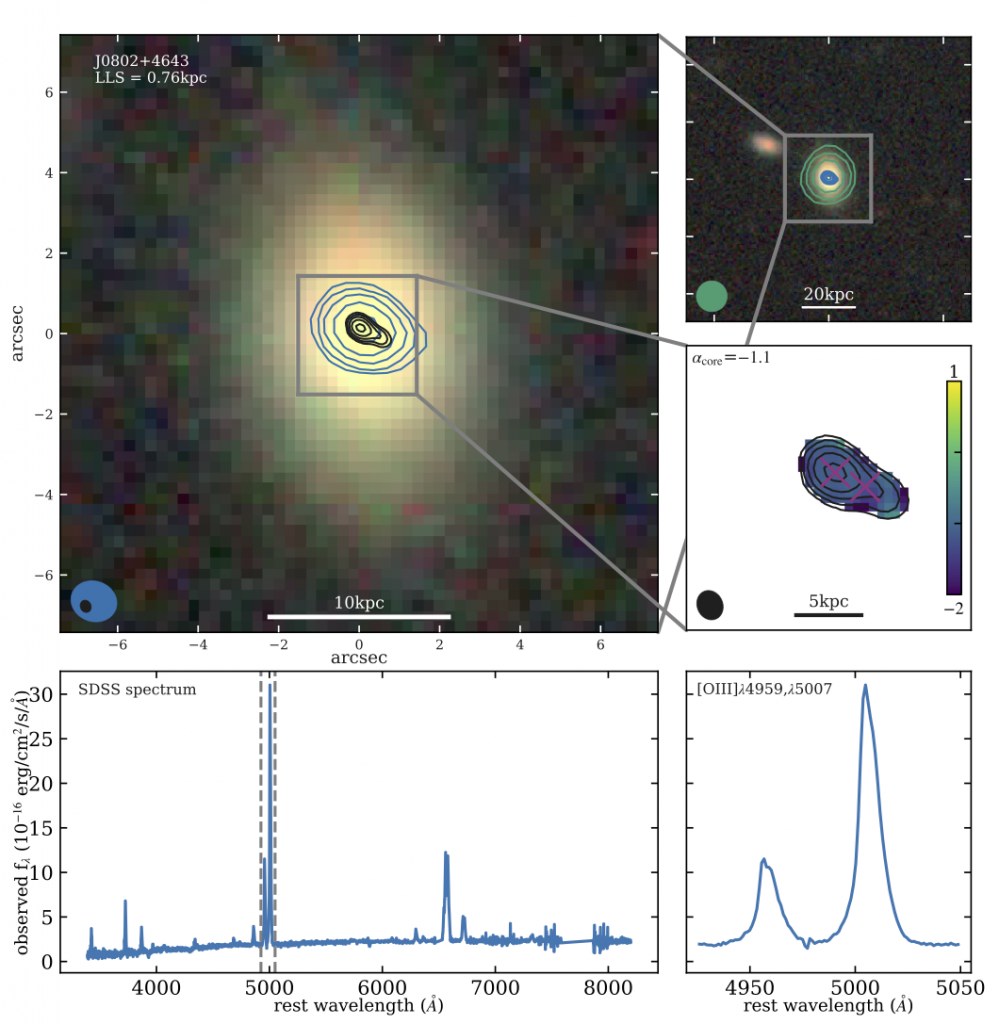
Radio Data
L-band (1.4GHz) VLA images from Jarvis+21 are available here.
C-band (6GHz) VLA images from Jarvis+21 are available here.
In-band spectral index maps (4-8GHz) from Jarvis+21 are available here.
e-MERLIN 6GHz radio maps from Njeri+25 are available here.
J0842+0759
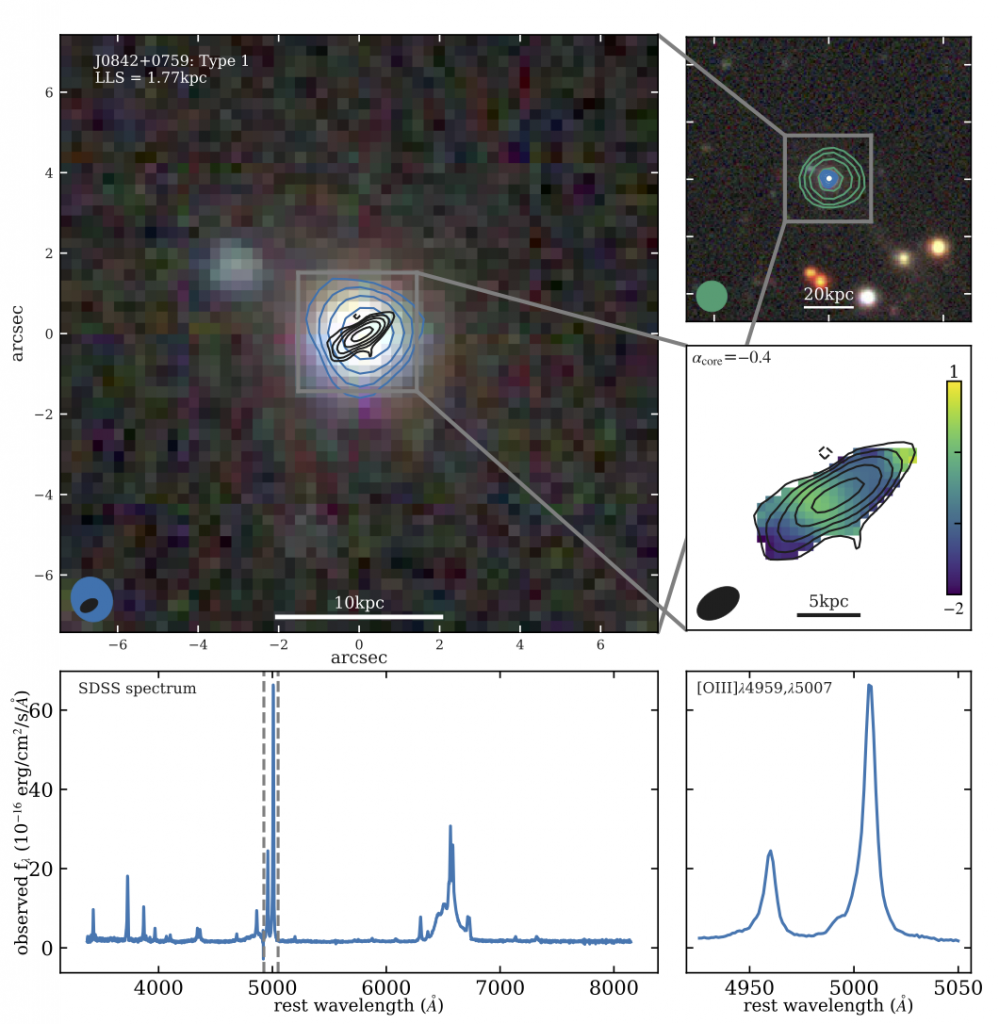
Radio Data
L-band (1.4GHz) VLA images from Jarvis+21 are available here.
C-band (6GHz) VLA images from Jarvis+21 are available here.
In-band spectral index maps (4-8GHz) from Jarvis+21 are available here.
e-MERLIN 6GHz radio maps from Njeri+25 are available here.
J0842+2048
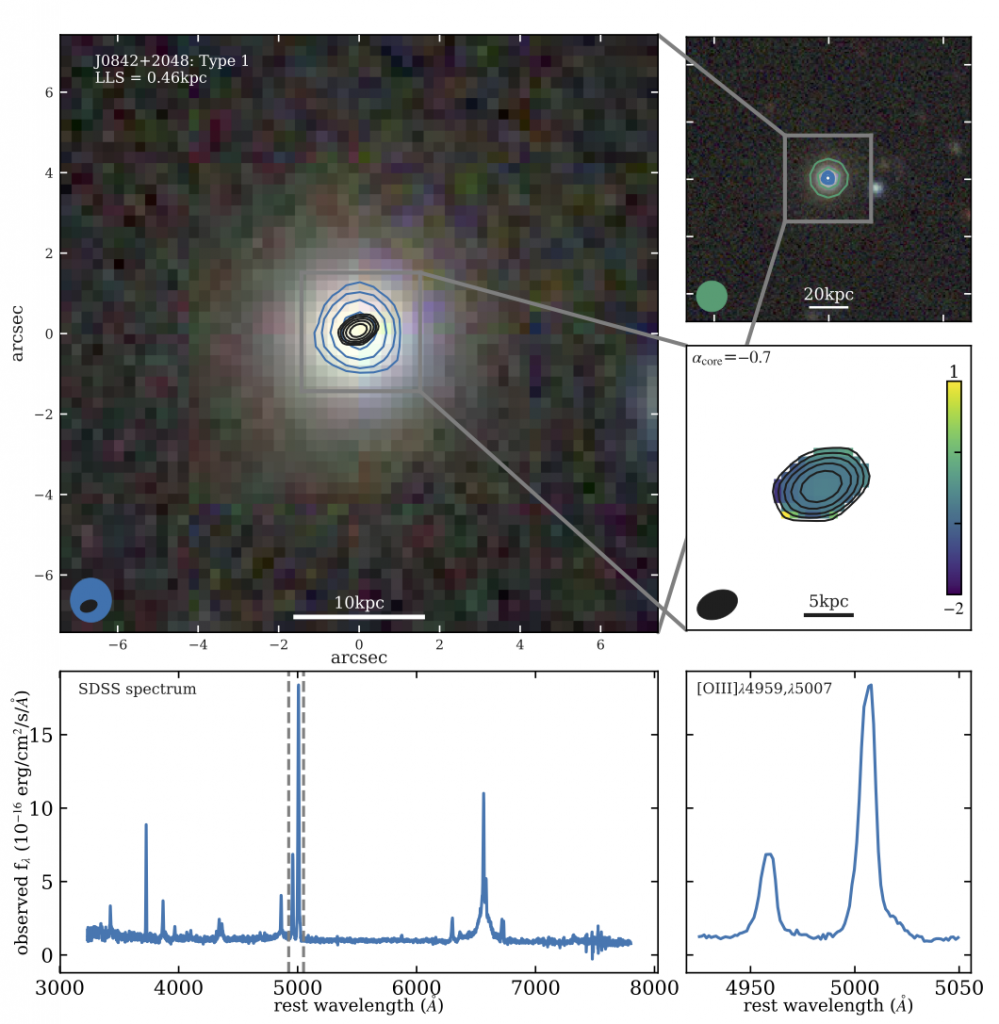
Radio Data
L-band (1.4GHz) VLA images from Jarvis+21 are available here.
C-band (6GHz) VLA images from Jarvis+21 are available here.
In-band spectral index maps (4-8GHz) from Jarvis+21 are available here.
e-MERLIN 6GHz radio maps from Njeri+25 are available here.
J0907+4620
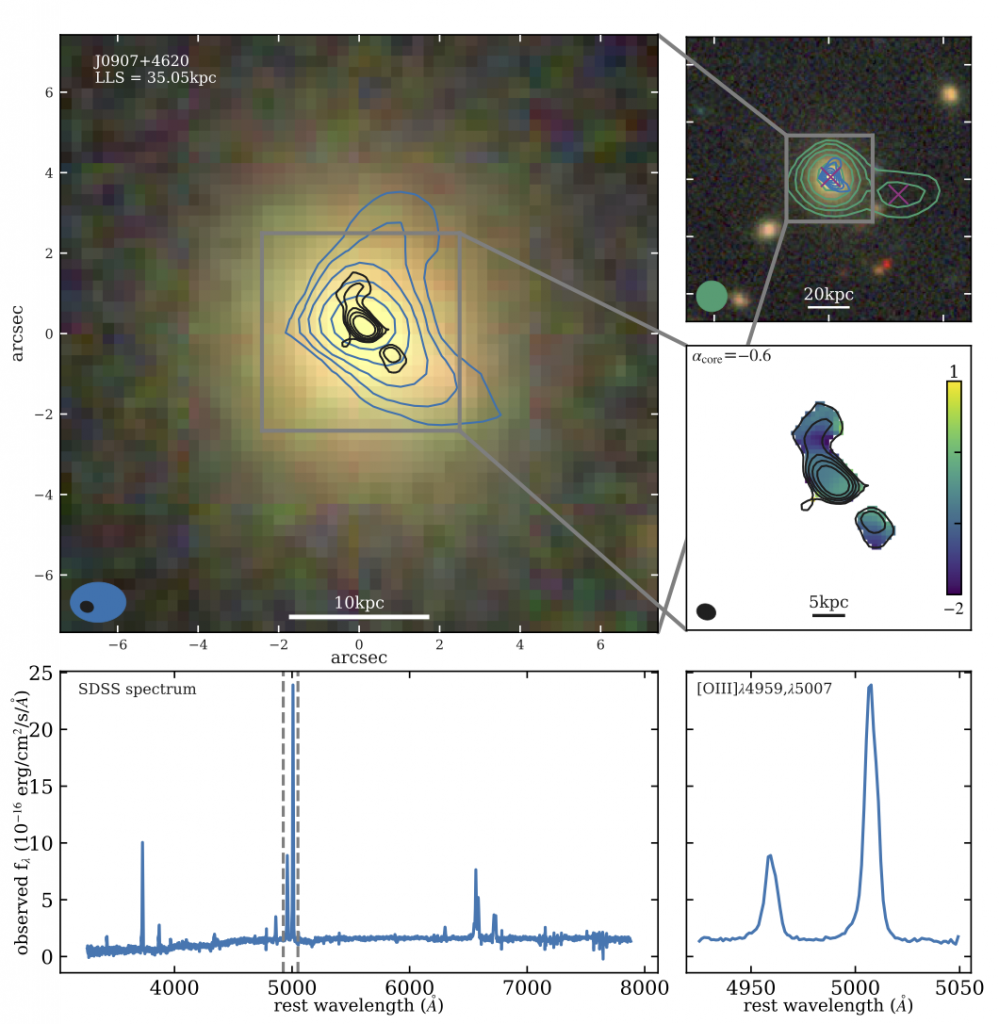
Radio Data
L-band (1.4GHz) VLA images from Jarvis+21 are available here.
C-band (6GHz) VLA images from Jarvis+21 are available here.
In-band spectral index maps (4-8GHz) from Jarvis+21 are available here.
e-MERLIN 6GHz radio maps from Njeri+25 are available here.
J0909+1052
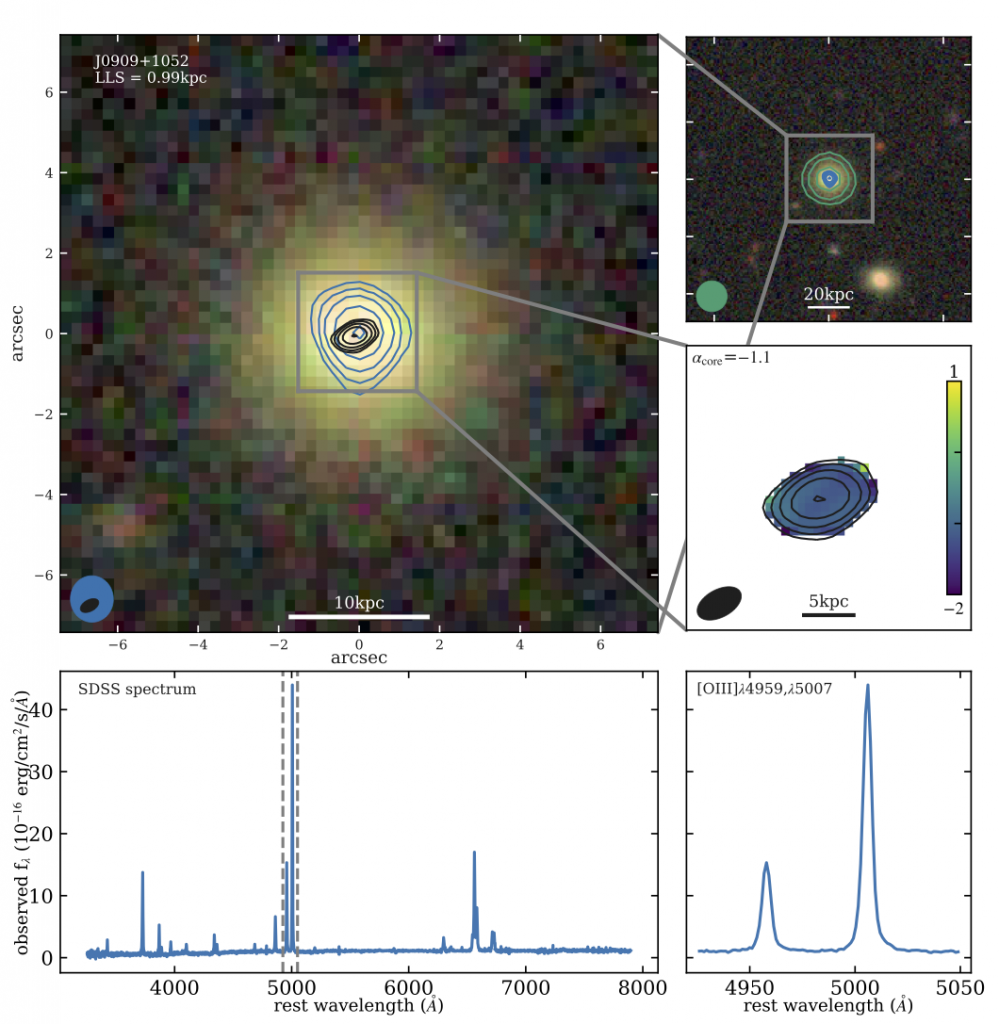
CO Data
CO(1-0) ACA data, and APEX data for CO(2-1) and CO(3-2) from Molyneux+24, available here.
Radio Data
L-band (1.4GHz) VLA images from Jarvis+21 are available here.
C-band (6GHz) VLA images from Jarvis+21 are available here.
In-band spectral index maps (4-8GHz) from Jarvis+21 are available here.
e-MERLIN 6GHz radio maps from Njeri+25 are available here.
J0945+1737
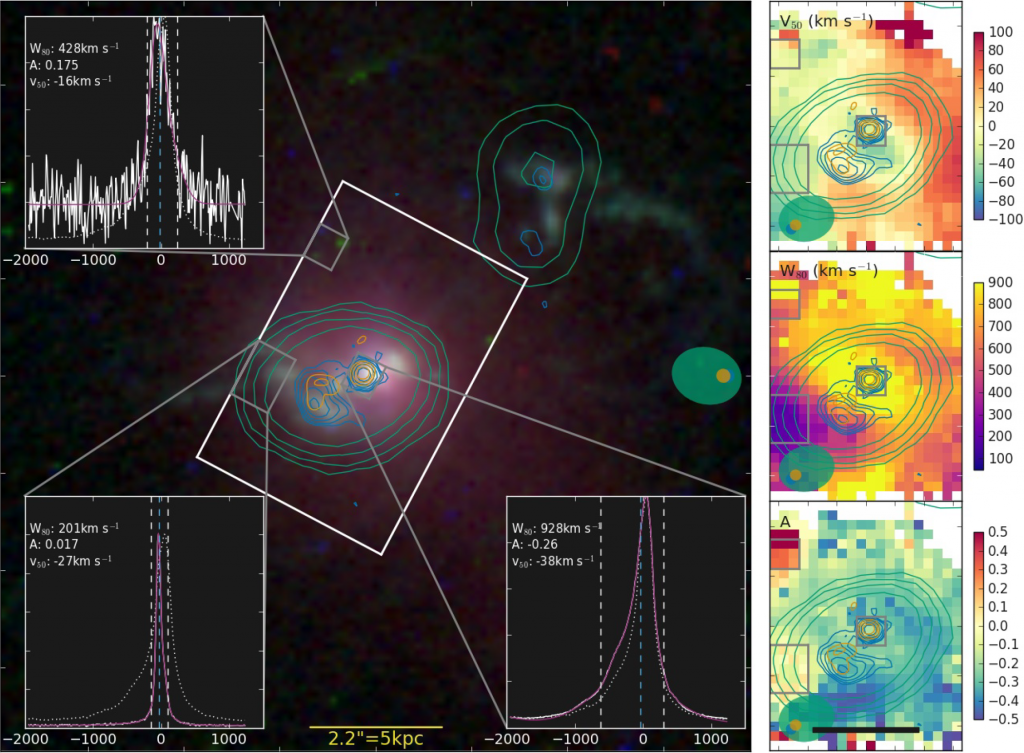
![[O III] image and radio polarization data for J0945 presented in SIlpa,S. et al. 2022](https://blogs.ncl.ac.uk/quasarfeedbacksurvey/files/2022/06/Silpa22_J0945_Polarization.png)
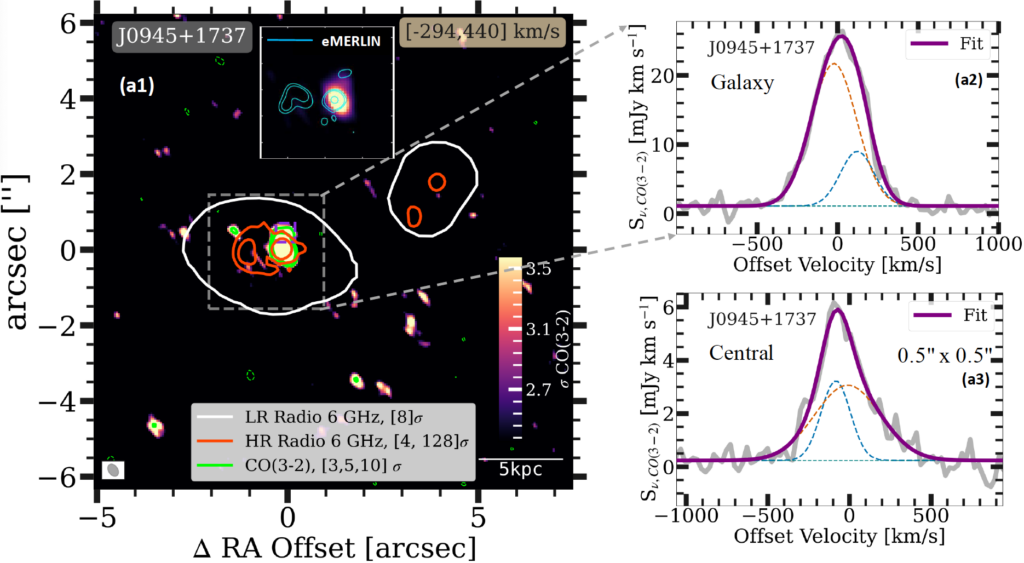
Molecular Gas
CO(2-1) APEX measurements presented in Jarvis+20. Emission-line data available here and machine-readable tabulated data here.
CO(1-0) ACA data, and APEX data for CO(2-1), CO(3-2), and CO(6-5) from Molyneux+24, available here.
Radio Data
VLA L-band (1.4GHz) and C-band (6GHz) images were produced for both Jarvis+19 and Jarvis+21. Although using the same data these images are slightly different as they were created for different reasons.
Data from Jarvis+19 (including radio and IFU data) available here.
Stokes I, Q, U images (polarization data), a spectral index map and a rotation measure images presented in Silpa,S.+22 are all available here: data.ncl.ac.uk.
e-MERLIN 6GHz radio maps from Njeri+25 are available here.
IFU Data
GMOS data cube and [O III] maps from Jarvis+19 available here.
J0946+1319
Radio Data
L-band (1.4GHz) VLA images from Jarvis+21 are available here.
C-band (6GHz) VLA images from Jarvis+21 are available here.
In-band spectral index maps (4-8GHz) from Jarvis+21 are available here.
e-MERLIN 6GHz radio maps from Njeri+25 are available here.
J0958+1439
Molecular Gas
CO(2-1) APEX measurements presented in Jarvis+20. Emission-line data available here and machine-readable tabulated data here.
CO(1-0) ACA data, and APEX data for CO(2-1) and CO(3-2) from Molyneux+23, available here.
Radio Data
VLA L-band (1.4GHz) and C-band (6GHz) images were produced for both Jarvis+19 and Jarvis+21. Although using the same data these images are slightly different as they were created for different reasons.
Data from Jarvis+19 (including radio and IFU data) available here.
L-band (1.4GHz) VLA images from Jarvis+21 are available here.
C-band (6GHz) VLA images from Jarvis+21 are available here.
In-band spectral index maps (4-8GHz) from Jarvis+21 are available here.
e-MERLIN 6GHz radio maps from Njeri+25 are available here.
IFU Data
GMOS data cube and [O III] maps from Jarvis+19 available here.
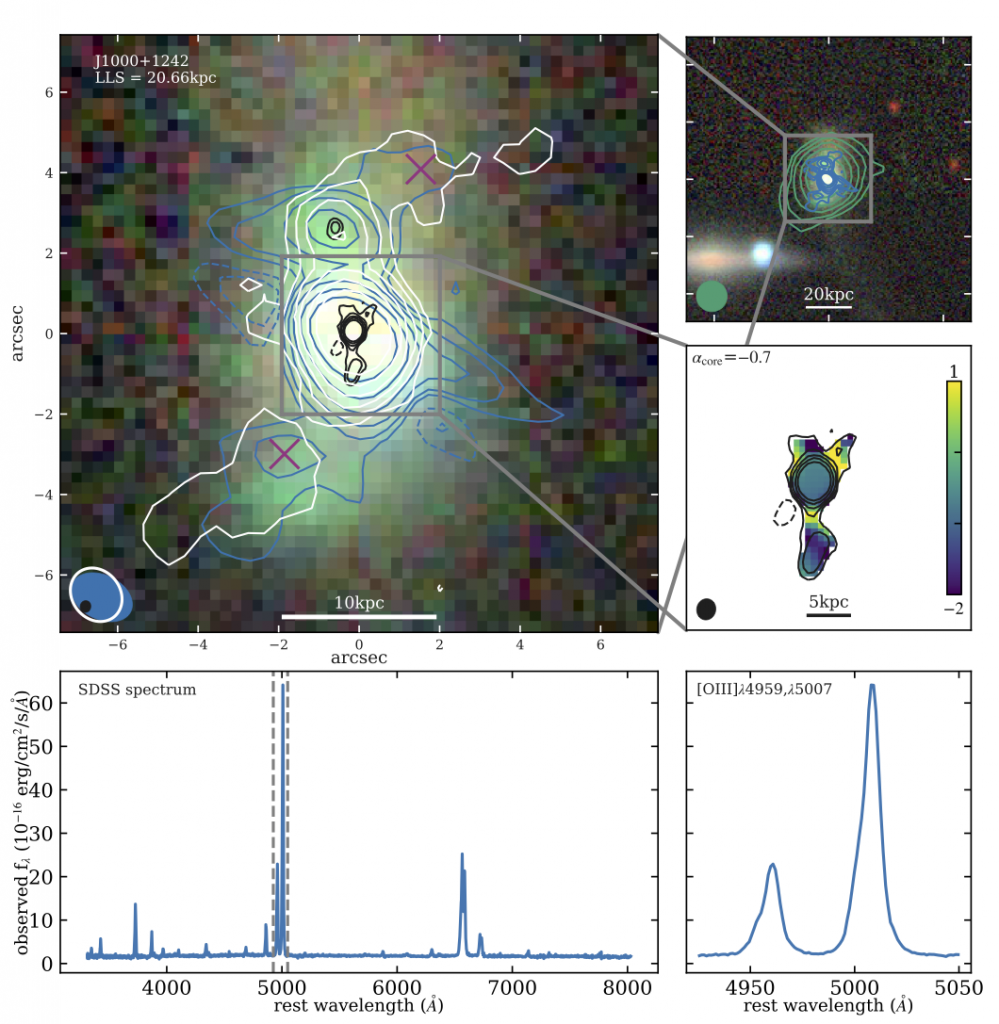
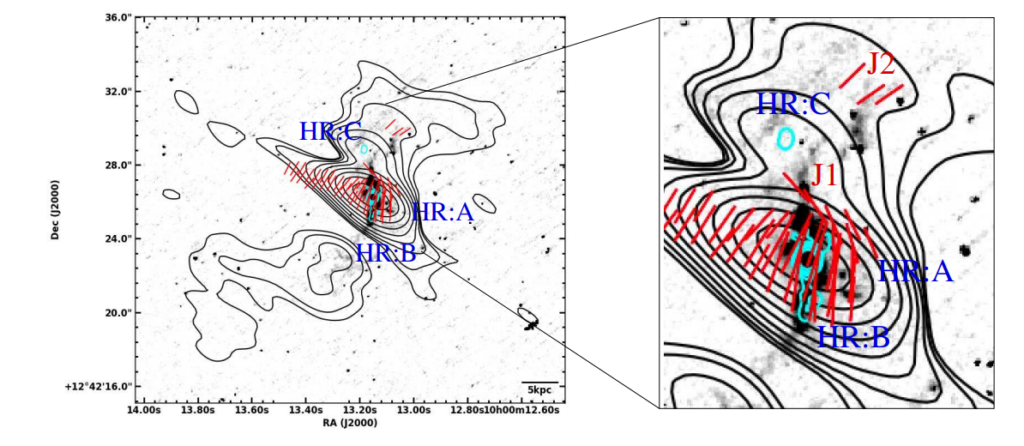
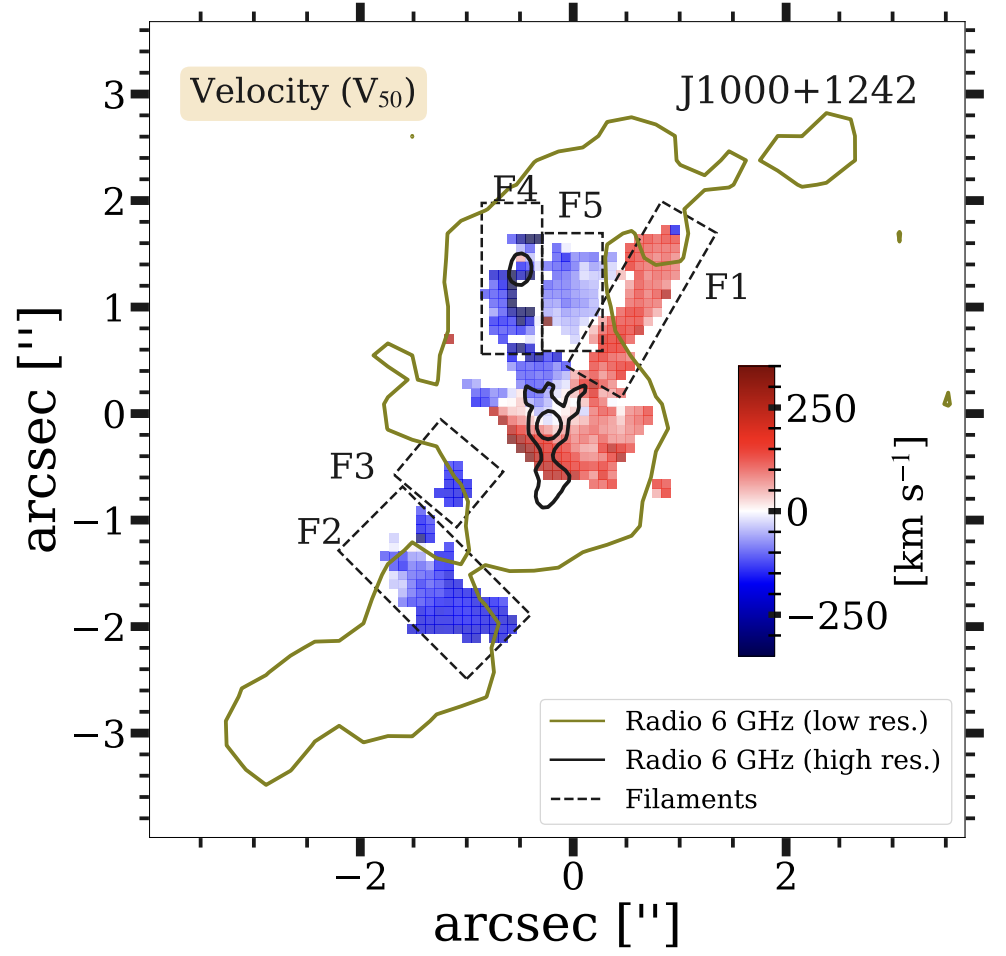
J1000+1242
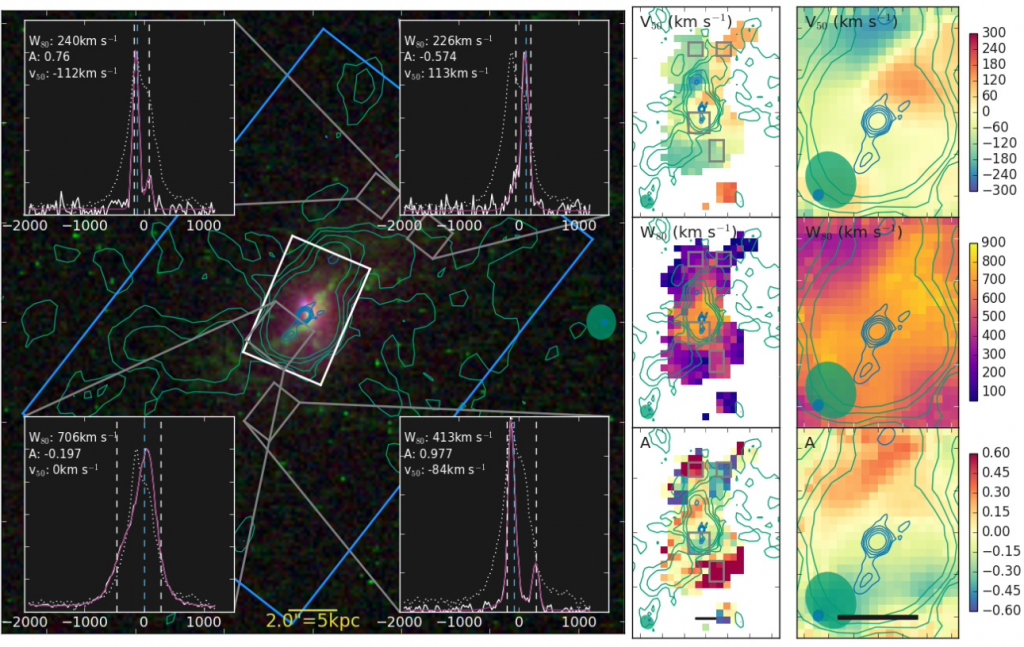
Molecular Gas
CO(2-1) APEX measurements presented in Jarvis+20. Emission-line data available here and machine-readable tabulated data here.
CO(1-0) ACA data, and APEX data for CO(2-1) and CO(3-2) from Molyneux+23, available here.
Radio Data
VLA L-band (1.4GHz) and C-band (6GHz) images were produced for both Jarvis+19 and Jarvis+21. Although using the same data these images are slightly different as they were created for different reasons.
Data from Jarvis+19 (including radio and IFU data) available here.
L-band (1.4GHz) VLA images from Jarvis+21 are available here.
C-band (6GHz) VLA images from Jarvis+21 are available here.
In-band spectral index maps (4-8GHz) from Jarvis+21 are available here.
Stokes I, Q, U images (polarization data), a spectral index map presented in Silpa,S.+22 are all available here: data.ncl.ac.uk.
e-MERLIN 6GHz radio maps from Njeri+25 are available here.
IFU Data
GMOS+VIMOS data cubes and [O III] maps from Jarvis+19 available here.
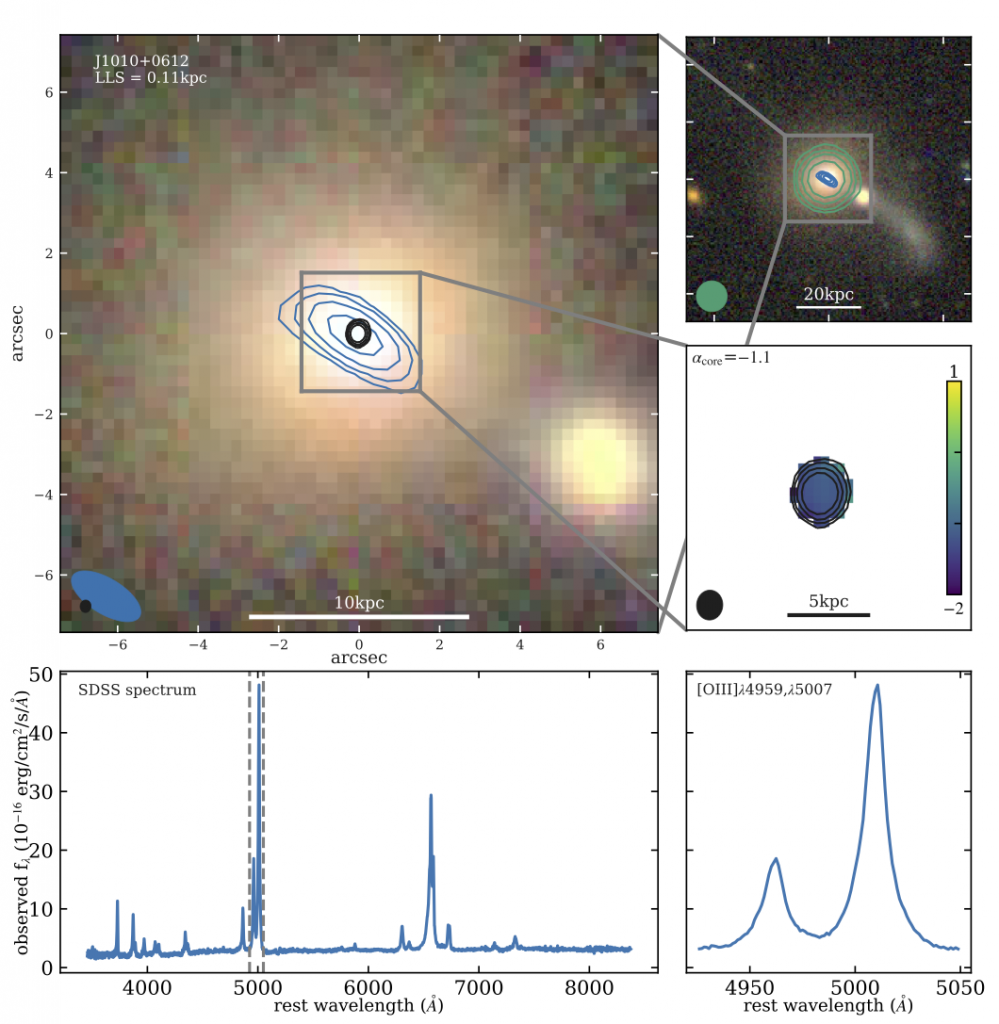
J1010+0612
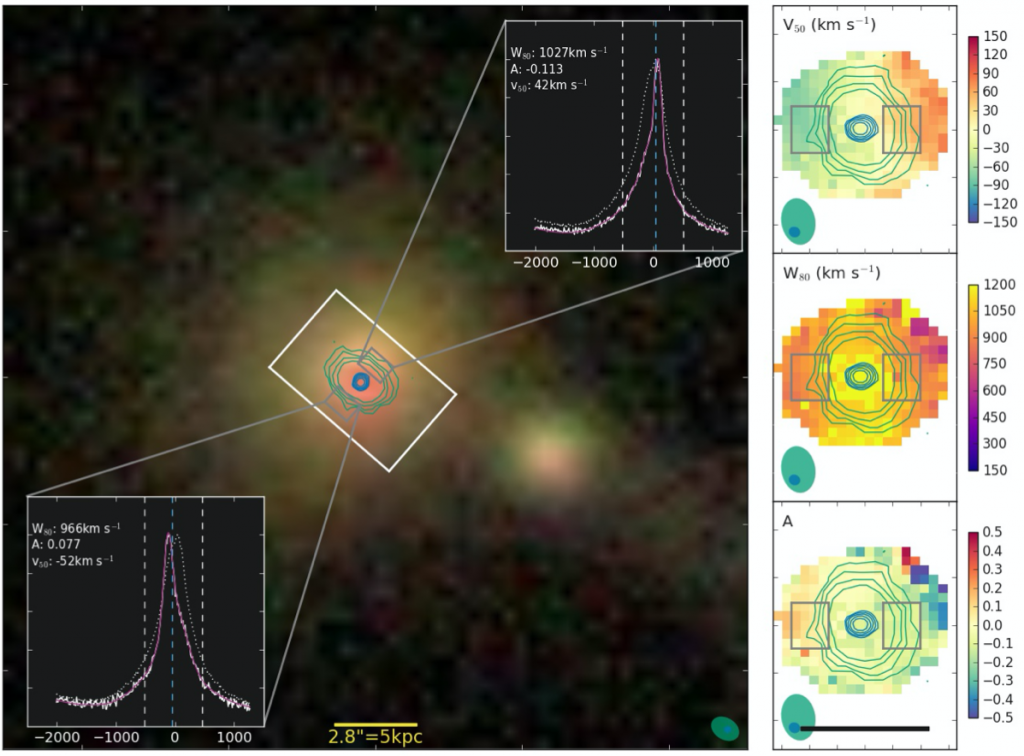
Molecular Gas
CO(2-1) APEX measurements presented in Jarvis+20. Emission-line data available here and machine-readable tabulated data here.
APEX data for CO(2-1), CO(3-2) and CO(6-5) from Molyneux+23, available here.
Radio Data
VLA L-band (1.4GHz) and C-band (6GHz) images were produced for both Jarvis+19 and Jarvis+21. Although using the same data these images are slightly different as they were created for different reasons.
Data from Jarvis+19 (including radio and IFU data) available here.
L-band (1.4GHz) VLA images from Jarvis+21 are available here.
C-band (6GHz) VLA images from Jarvis+21 are available here.
In-band spectral index maps (4-8GHz) from Jarvis+21 are available here.
e-MERLIN 6GHz radio maps from Njeri+25 are available here.
IFU Data
GMOS data cube and [O III] maps from Jarvis+19 available here.
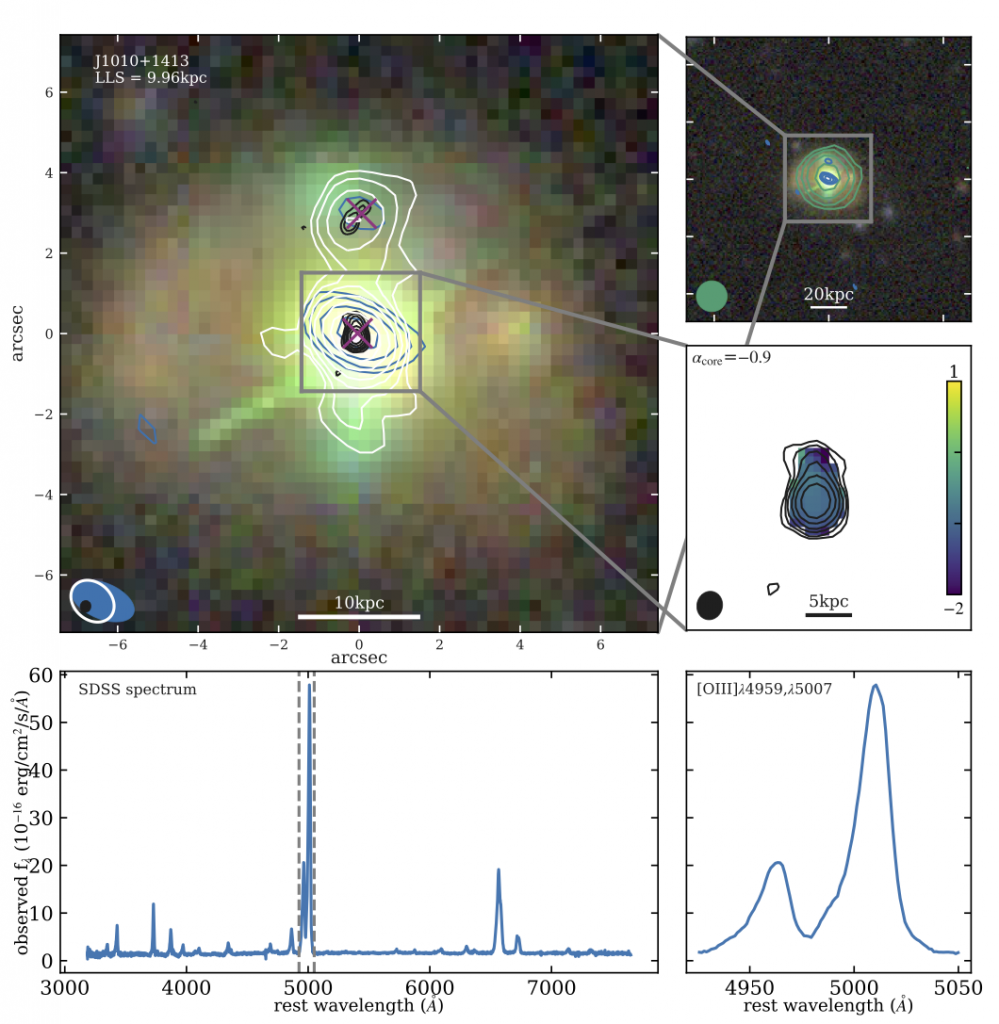
J1010+1413
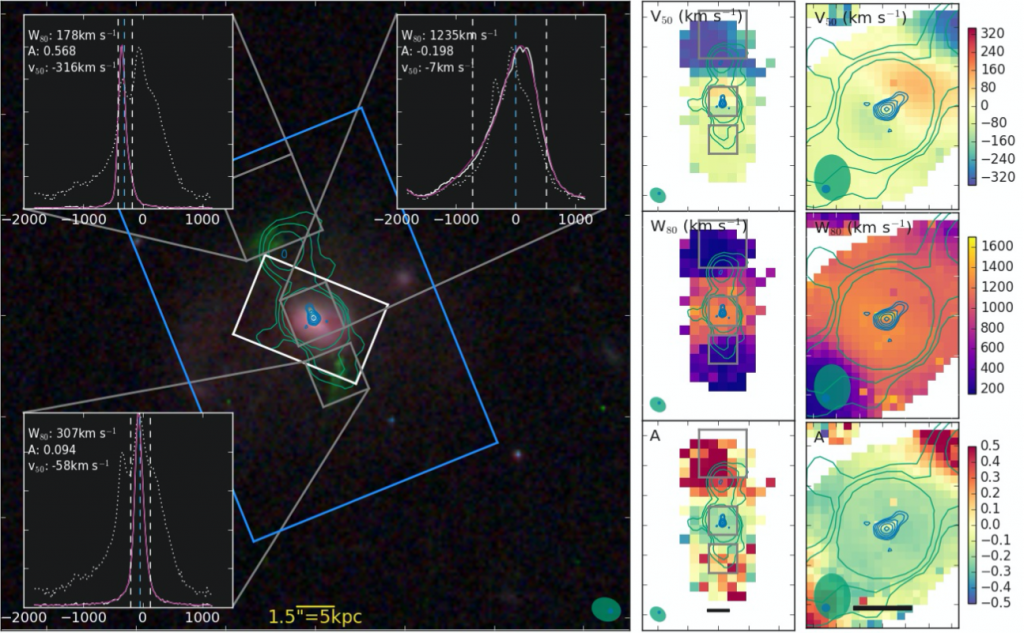
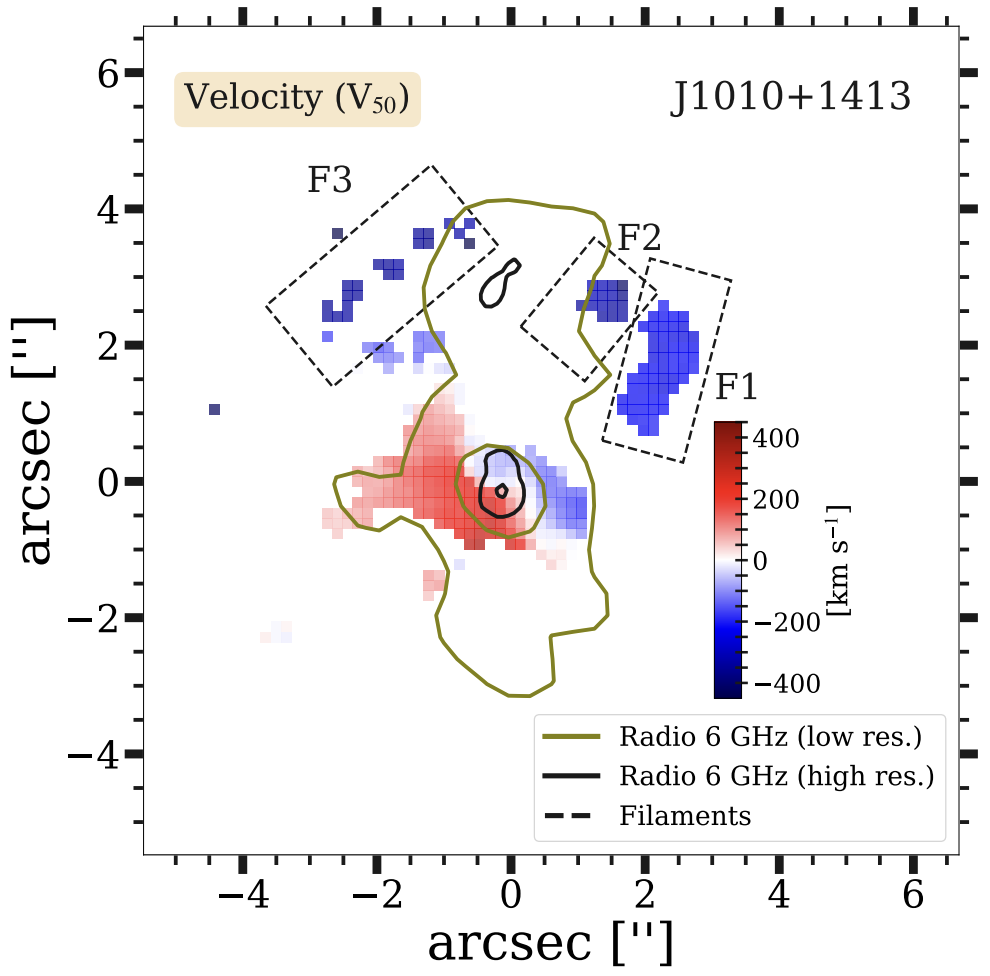
Molecular Gas
CO(2-1) APEX measurements presented in Jarvis+20. Emission-line data available here and machine-readable tabulated data here.
APEX data for CO(2-1) and CO(3-2) from Molyneux+23, available here.
Radio Data
VLA L-band (1.4GHz) and C-band (6GHz) images were produced for both Jarvis+19 and Jarvis+21. Although using the same data these images are slightly different as they were created for different reasons.
Data from Jarvis+19 (including radio and IFU data) available here.
L-band (1.4GHz) VLA images from Jarvis+21 are available here.
C-band (6GHz) VLA images from Jarvis+21 are available here.
In-band spectral index maps (4-8GHz) from Jarvis+21 are available here.
No polarization signature was detected in Silpa,S+22 for this source. Nonetheless, Stokes I, Q, U images (polarization data), a spectral index map presented in Silpa,S.+22 are all available here: data.ncl.ac.uk.
e-MERLIN 6GHz radio maps from Njeri+25 are available here.
IFU Data
GMOS+VIMOS data cubes and [O III] maps from Jarvis+19 available here.
J1016+0028
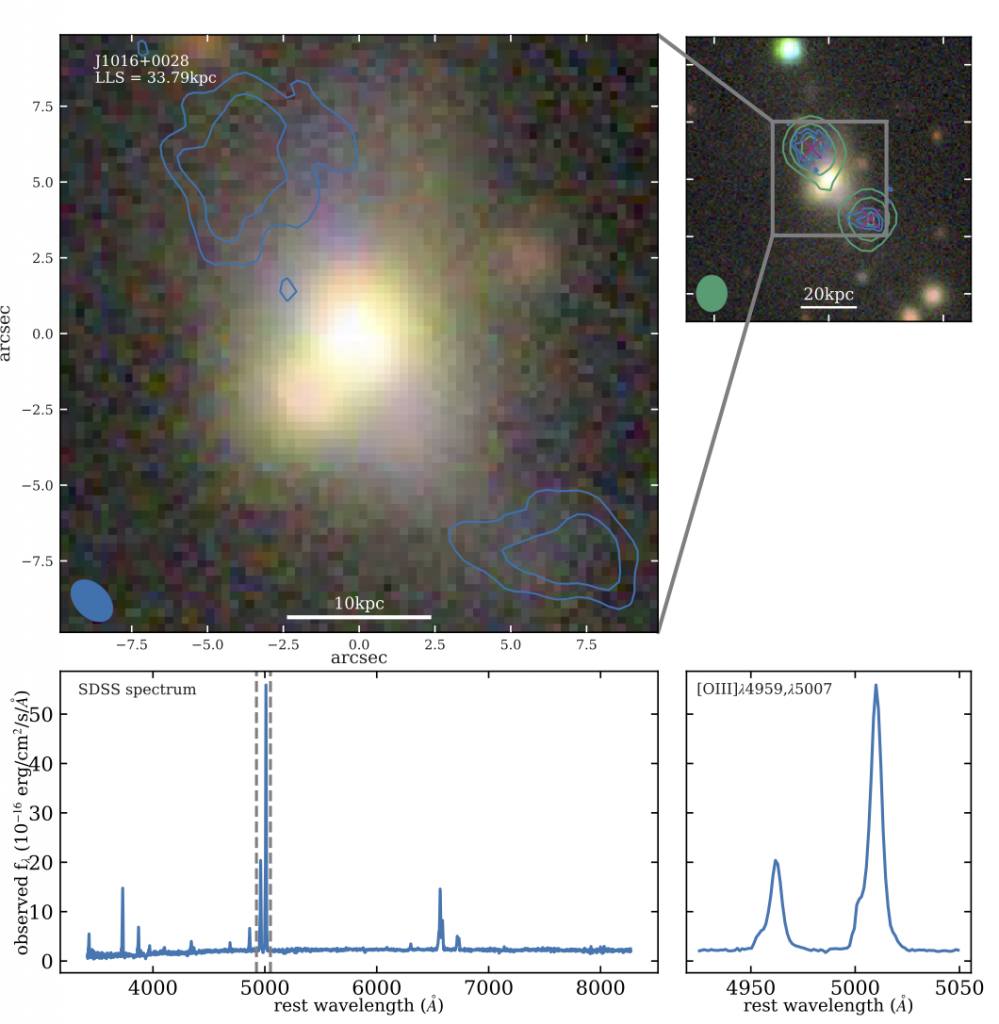
Radio Data
L-band (1.4GHz) VLA images from Jarvis+21 are available here.
C-band (6GHz) VLA images from Jarvis+21 are available here.
In-band spectral index maps (4-8GHz) from Jarvis+21 are available here.
e-MERLIN 6GHz radio maps from Njeri+25 are available here.
CO Data
CO(1-0) ACA data, and APEX data for CO(2-1) and CO(3-2) from Molyneux+23, available here.
J1016+5358
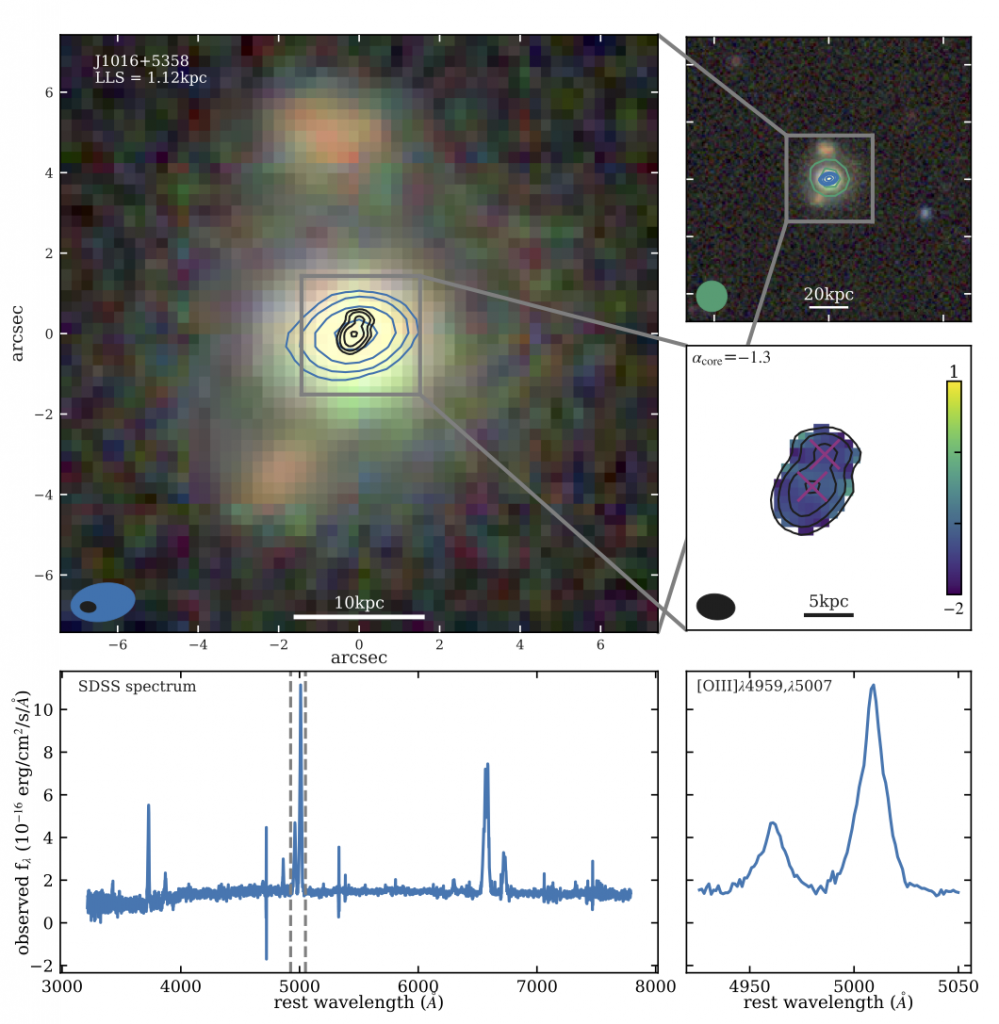
Radio Data
L-band (1.4GHz) VLA images from Jarvis+21 are available here.
C-band (6GHz) VLA images from Jarvis+21 are available here.
In-band spectral index maps (4-8GHz) from Jarvis+21 are available here.
e-MERLIN 6GHz radio maps from Njeri+25 are available here.
J1045+0843
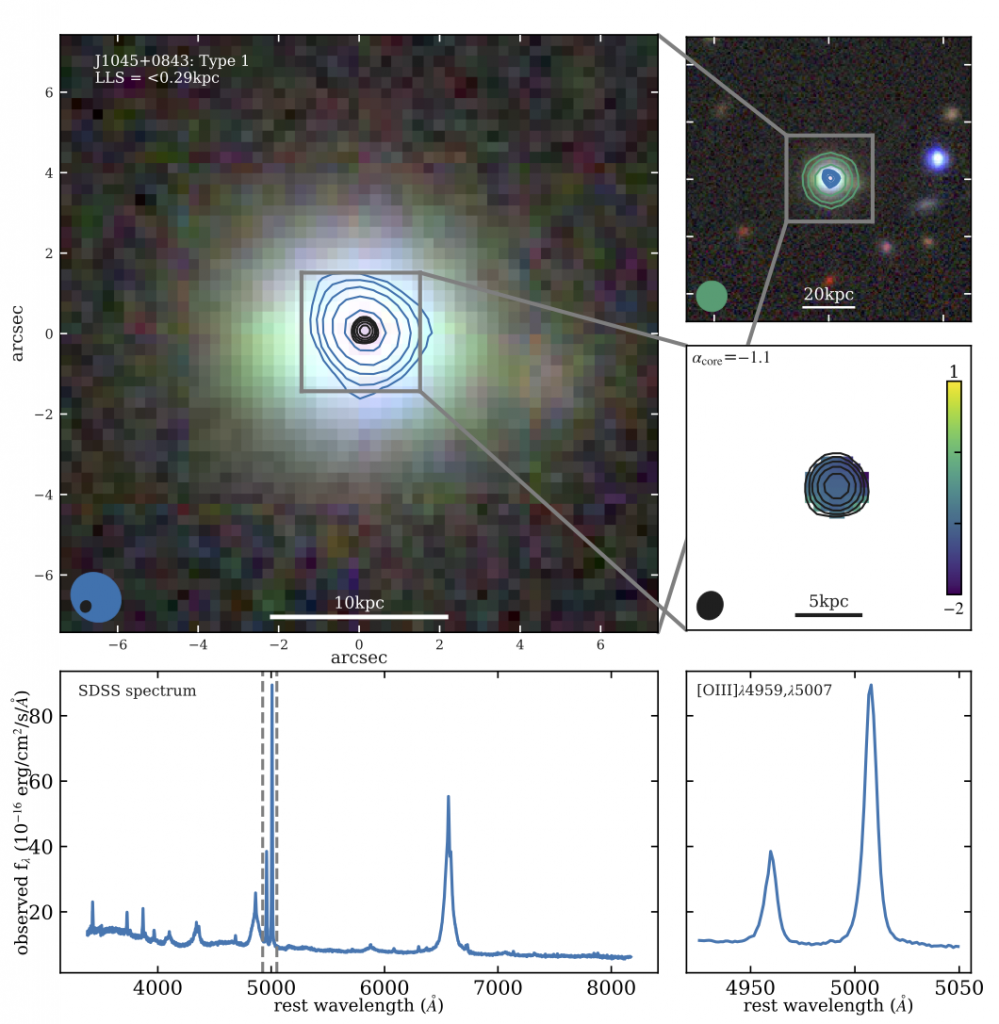
Radio Data
L-band (1.4GHz) VLA images from Jarvis+21 are available here.
C-band (6GHz) VLA images from Jarvis+21 are available here.
In-band spectral index maps (4-8GHz) from Jarvis+21 are available here.
e-MERLIN 6GHz radio maps from Njeri+25 are available here.
J1055+1102
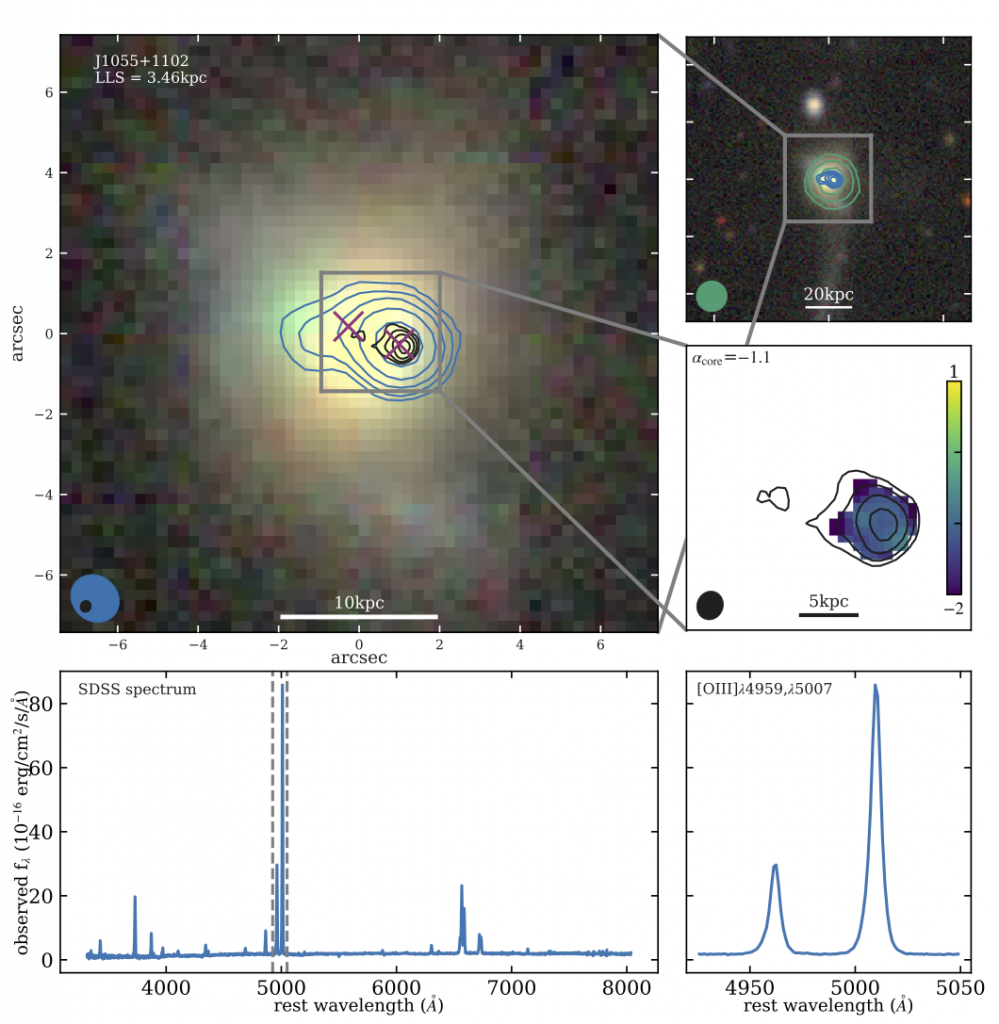
Radio Data
L-band (1.4GHz) VLA images from Jarvis+21 are available here.
C-band (6GHz) VLA images from Jarvis+21 are available here.
In-band spectral index maps (4-8GHz) from Jarvis+21 are available here.
e-MERLIN 6GHz radio maps from Njeri+25 are available here.
CO Data
CO(1-0) ACA data, and APEX data for CO(2-1) and CO(3-2) from Molyneux+23, available here.
J1100+0846
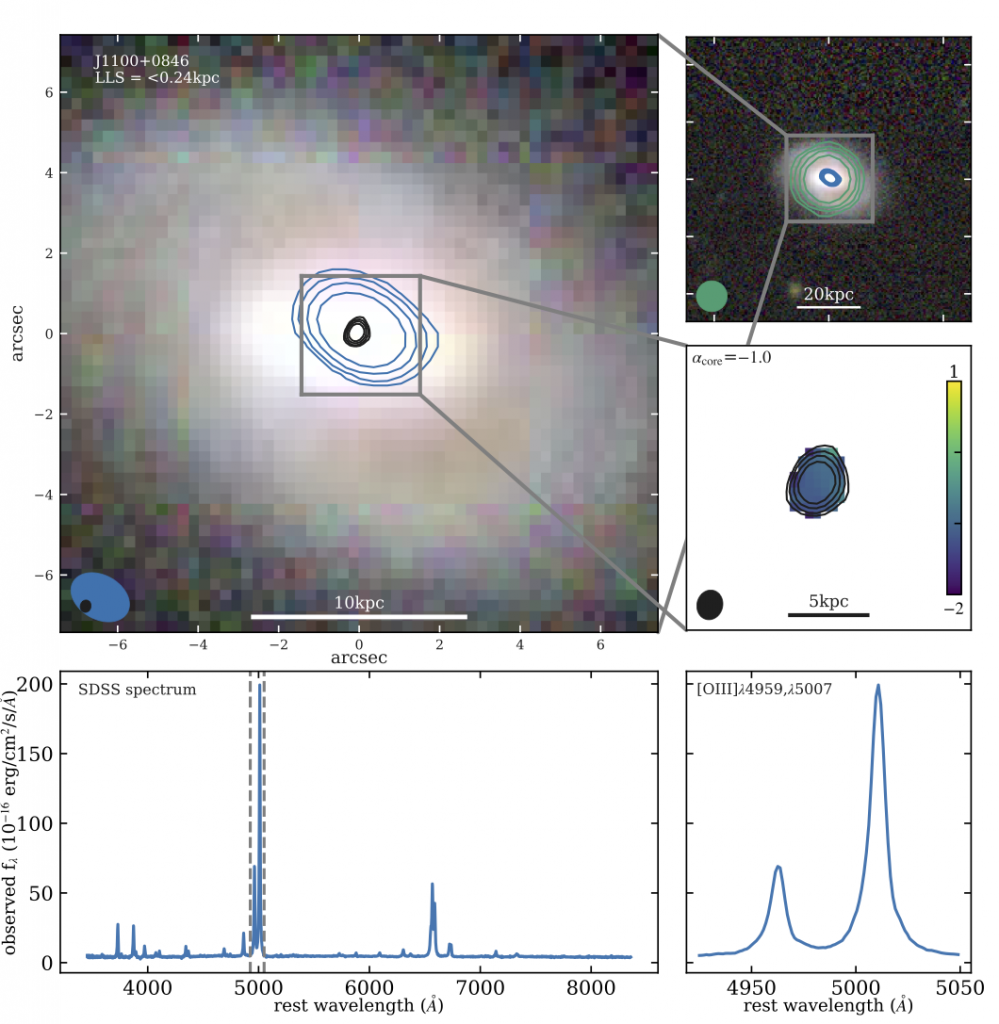
Molecular Gas
CO(2-1) APEX measurements presented in Jarvis+20. Emission-line data available here and machine-readable tabulated data here.
CO(1-0) ACA data, and APEX data for CO(2-1), CO(3-2) and CO(6-5) from Molyneux+23, available here.
Radio Data
VLA L-band (1.4GHz) and C-band (6GHz) images were produced for both Jarvis+19 and Jarvis+21. Although using the same data these images are slightly different as they were created for different reasons.
Data from Jarvis+19 (including radio and IFU data) available here.
L-band (1.4GHz) VLA images from Jarvis+21 are available here.
C-band (6GHz) VLA images from Jarvis+21 are available here.
In-band spectral index maps (4-8GHz) from Jarvis+21 are available here.
e-MERLIN 6GHz radio maps from Njeri+25 are available here.
IFU Data
GMOS data cube and [O III] maps from Jarvis+19 available here.
J1108+0659
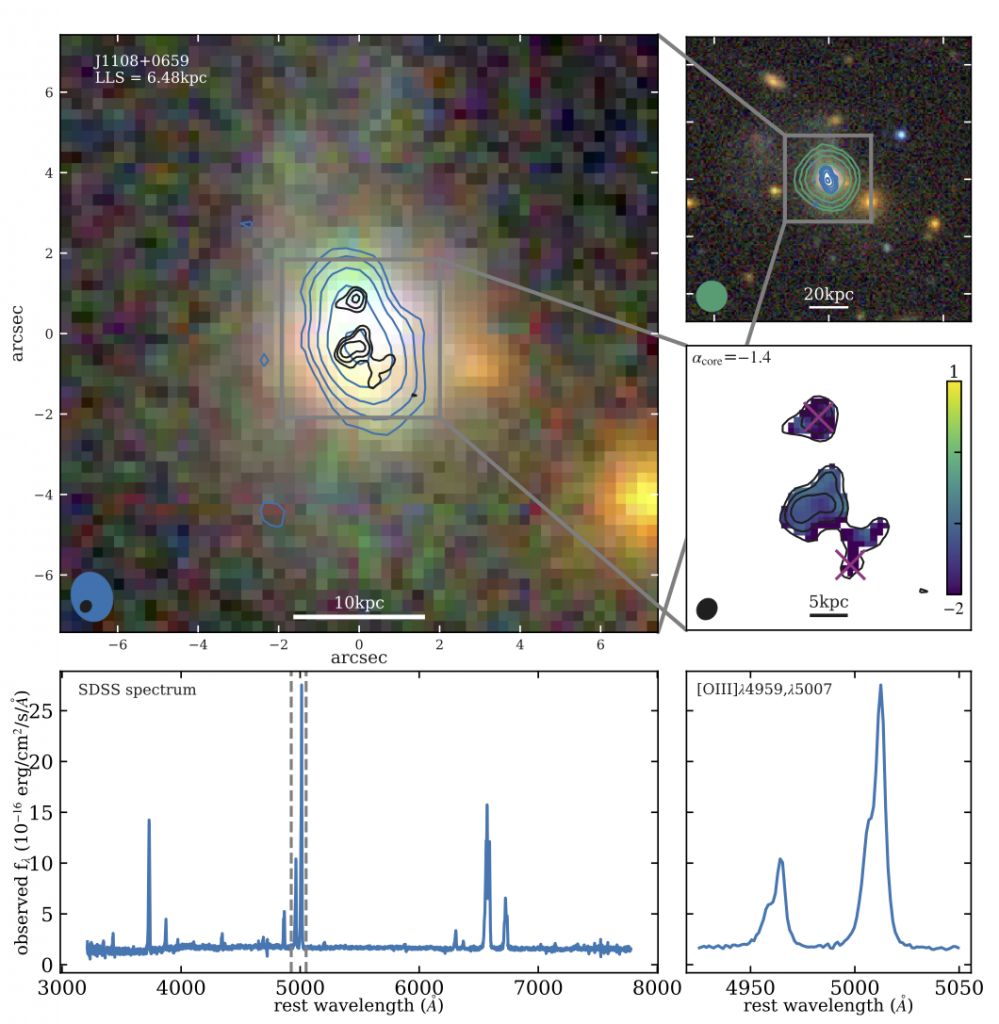
Radio Data
L-band (1.4GHz) VLA images from Jarvis+21 are available here.
C-band (6GHz) VLA images from Jarvis+21 are available here.
In-band spectral index maps (4-8GHz) from Jarvis+21 are available here.
e-MERLIN 6GHz radio maps from Njeri+25 are available here.
CO Data
CO(1-0) ACA data, and APEX data for CO(2-1), CO(3-2) and CO(7-6) from Molyneux+23, available here.
J1114+1939
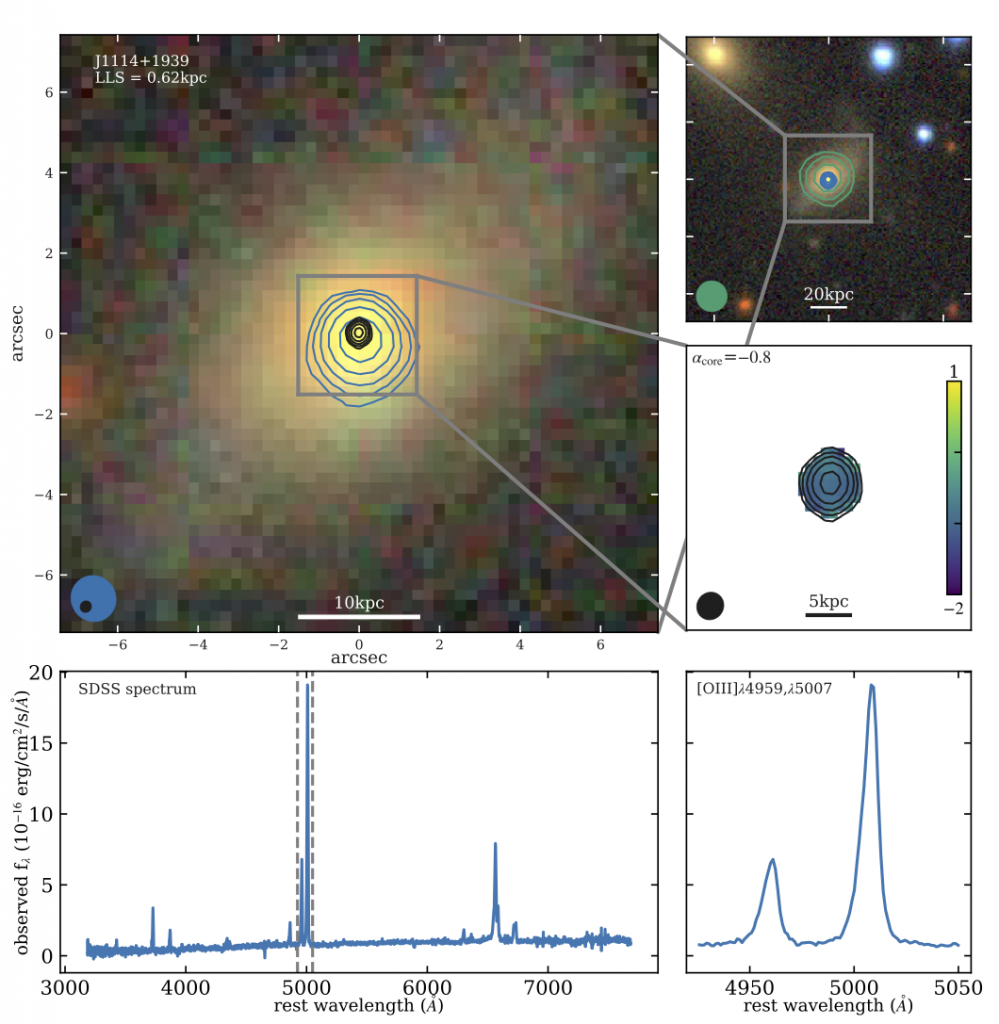
Radio Data
L-band (1.4GHz) VLA images from Jarvis+21 are available here.
C-band (6GHz) VLA images from Jarvis+21 are available here.
In-band spectral index maps (4-8GHz) from Jarvis+21 are available here.
e-MERLIN 6GHz radio maps from Njeri+25 are available here.
CO Data
CO(1-0) ACA data, and APEX data for CO(2-1) and CO(3-2) from Molyneux+23, available here.
J1116+2200
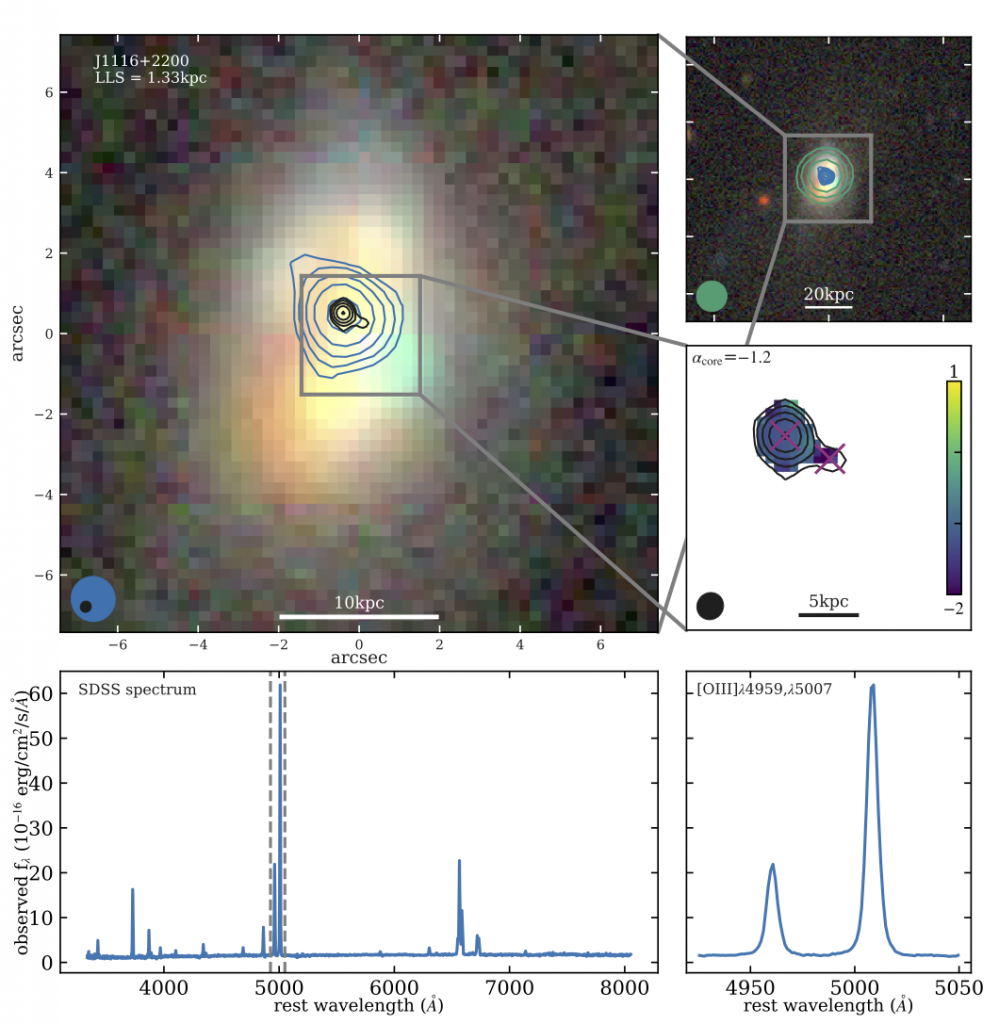
Radio Data
L-band (1.4GHz) VLA images from Jarvis+21 are available here.
C-band (6GHz) VLA images from Jarvis+21 are available here.
In-band spectral index maps (4-8GHz) from Jarvis+21 are available here.
e-MERLIN 6GHz radio maps from Njeri+25 are available here.
CO Data
CO(1-0) ACA data, and APEX data for CO(2-1), CO(3-2) and CO(7-6) from Molyneux+23, available here.
J1222-0007
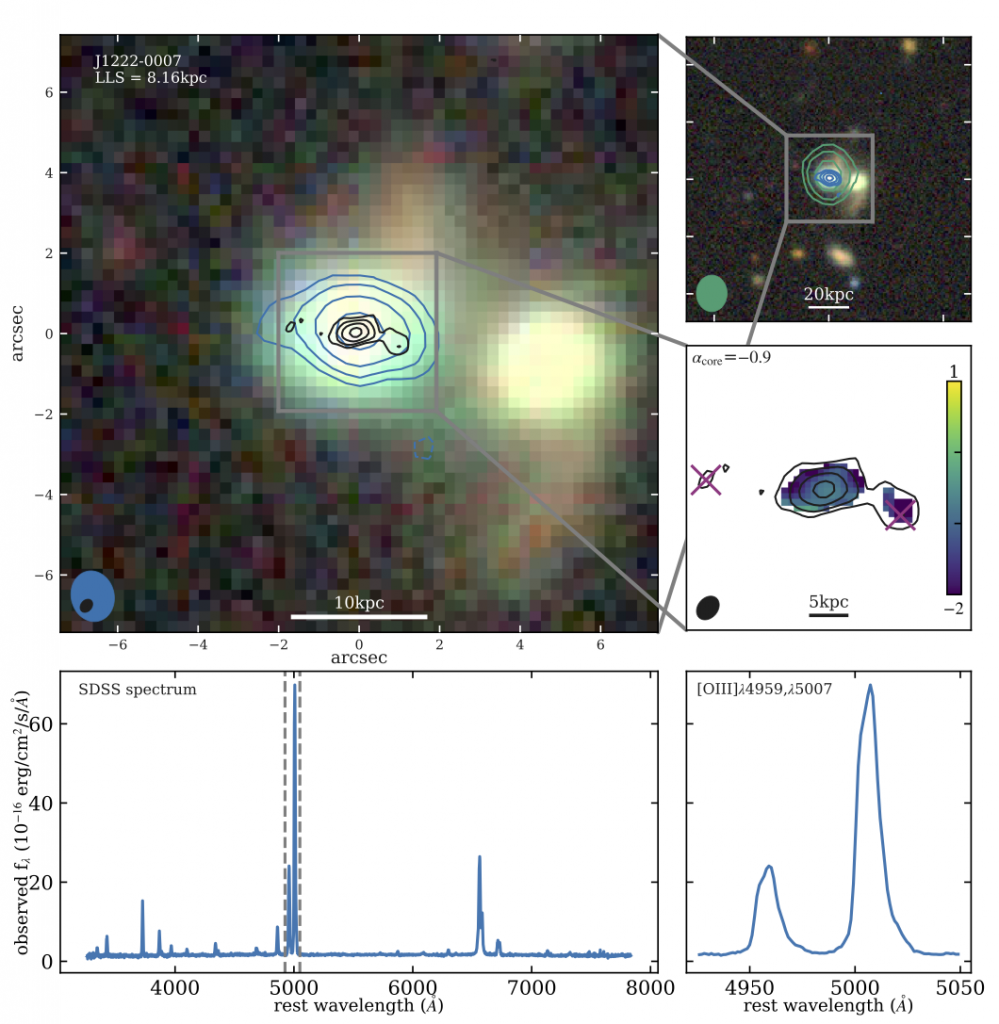
Radio Data
L-band (1.4GHz) VLA images from Jarvis+21 are available here.
C-band (6GHz) VLA images from Jarvis+21 are available here.
In-band spectral index maps (4-8GHz) from Jarvis+21 are available here.
e-MERLIN 6GHz radio maps from Njeri+25 are available here.
CO Data
CO(1-0) ACA data, and APEX data for CO(2-1), and CO(3-2) from Molyneux+23, available here.
J1223+5409
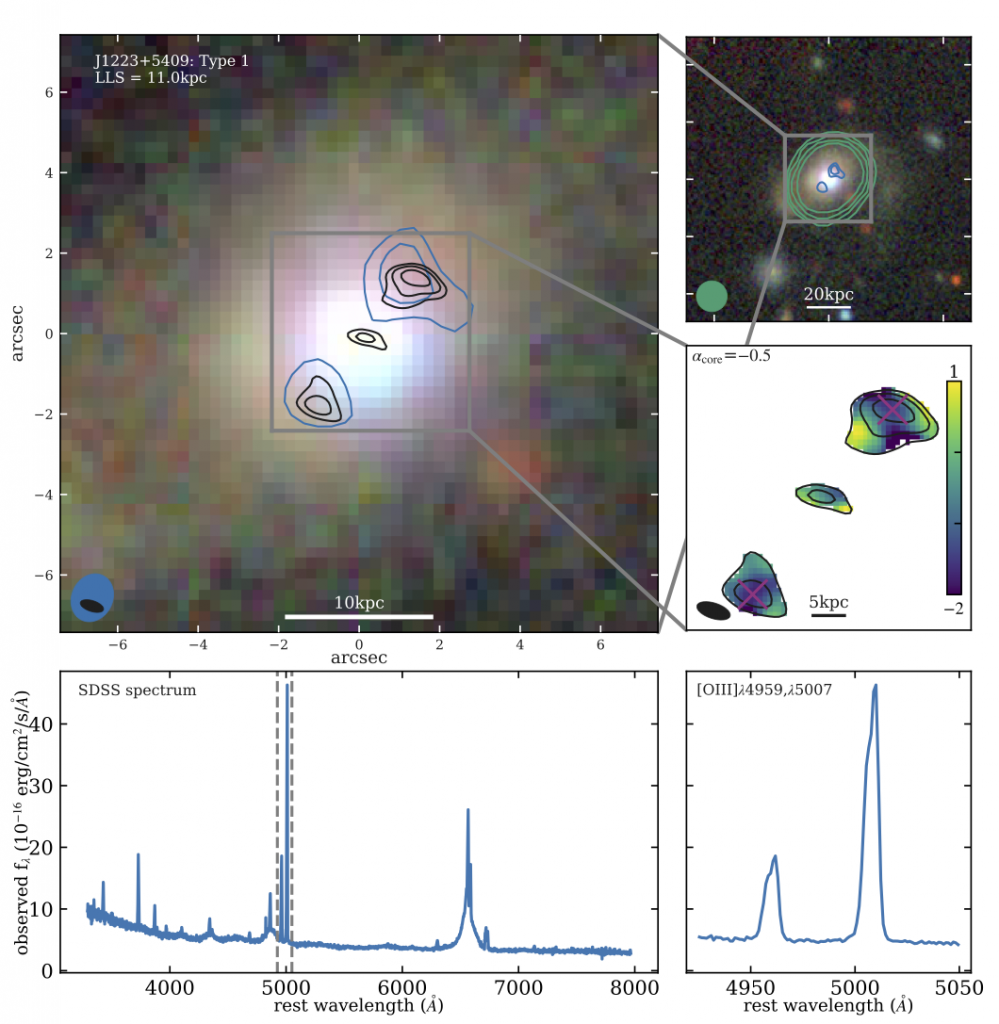
Radio Data
L-band (1.4GHz) VLA images from Jarvis+21 are available here.
C-band (6GHz) VLA images from Jarvis+21 are available here.
In-band spectral index maps (4-8GHz) from Jarvis+21 are available here.
e-MERLIN 6GHz radio maps from Njeri+25 are available here.
J1227+0419
Radio Data
L-band (1.4GHz) VLA images from Jarvis+21 are available here.
C-band (6GHz) VLA images from Jarvis+21 are available here.
In-band spectral index maps (4-8GHz) from Jarvis+21 are available here.
e-MERLIN 6GHz radio maps from Njeri+25 are available here.
J1300+0355
Radio Data
L-band (1.4GHz) VLA images from Jarvis+21 are available here.
C-band (6GHz) VLA images from Jarvis+21 are available here.
In-band spectral index maps (4-8GHz) from Jarvis+21 are available here.
e-MERLIN 6GHz radio maps from Njeri+25 are available here.
J1302+1624
Radio Data
L-band (1.4GHz) VLA images from Jarvis+21 are available here.
C-band (6GHz) VLA images from Jarvis+21 are available here.
In-band spectral index maps (4-8GHz) from Jarvis+21 are available here.
e-MERLIN 6GHz radio maps from Njeri+25 are available here.
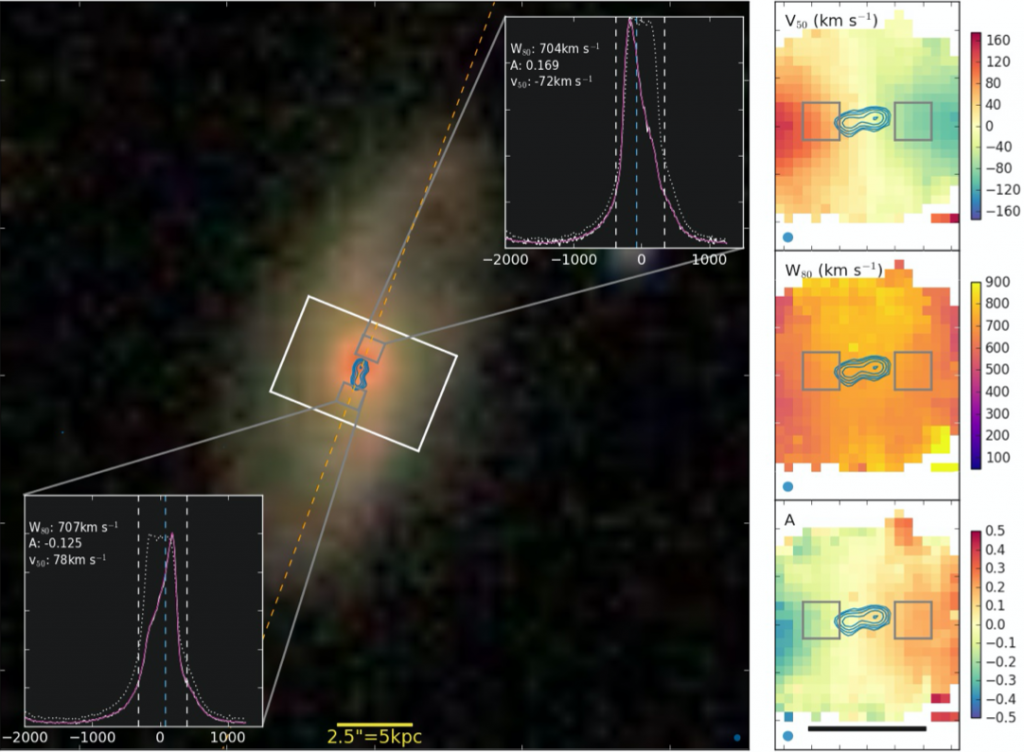
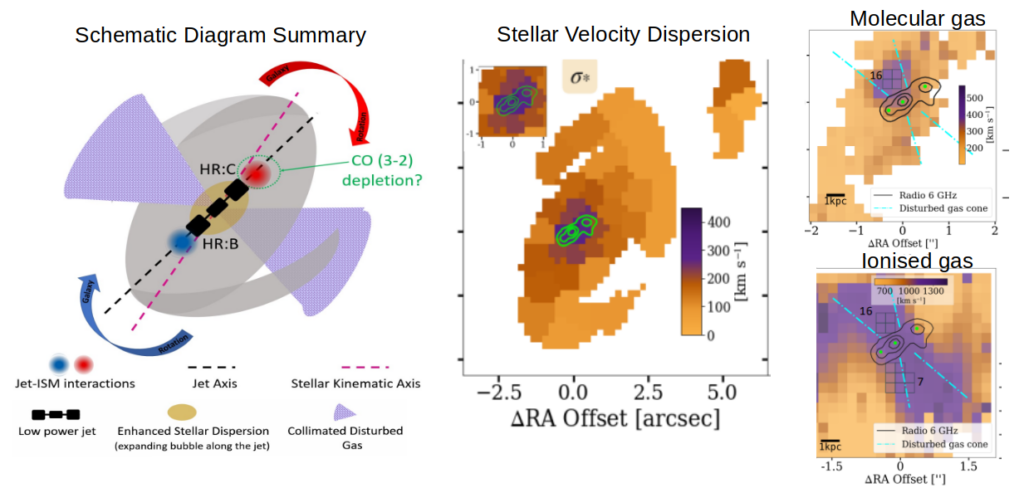
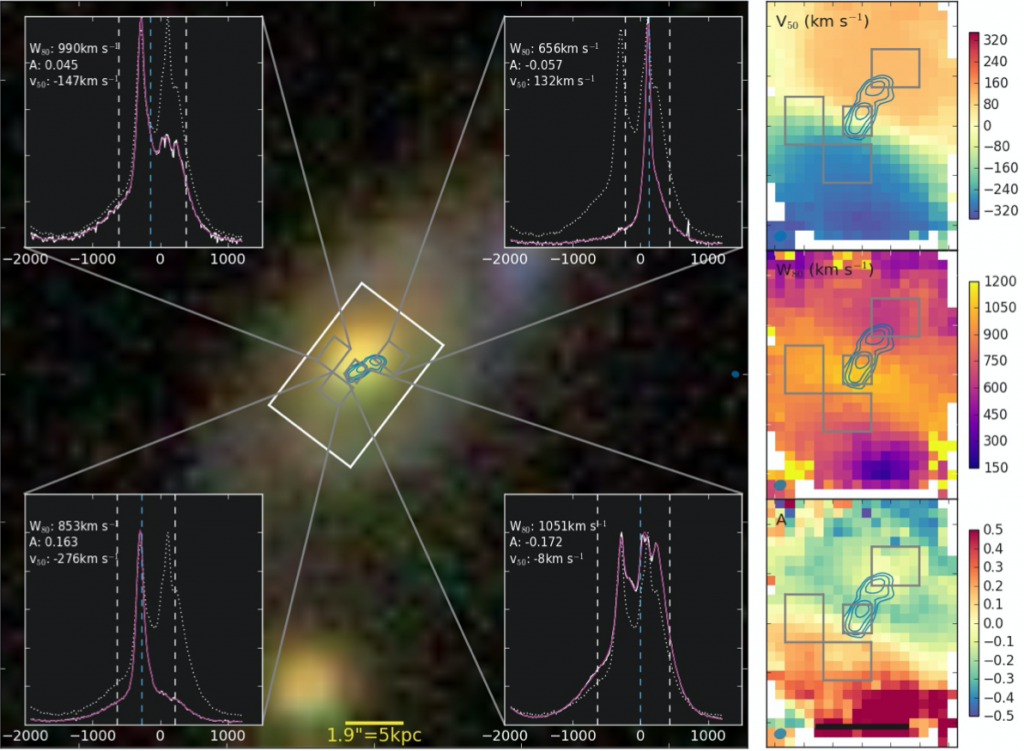
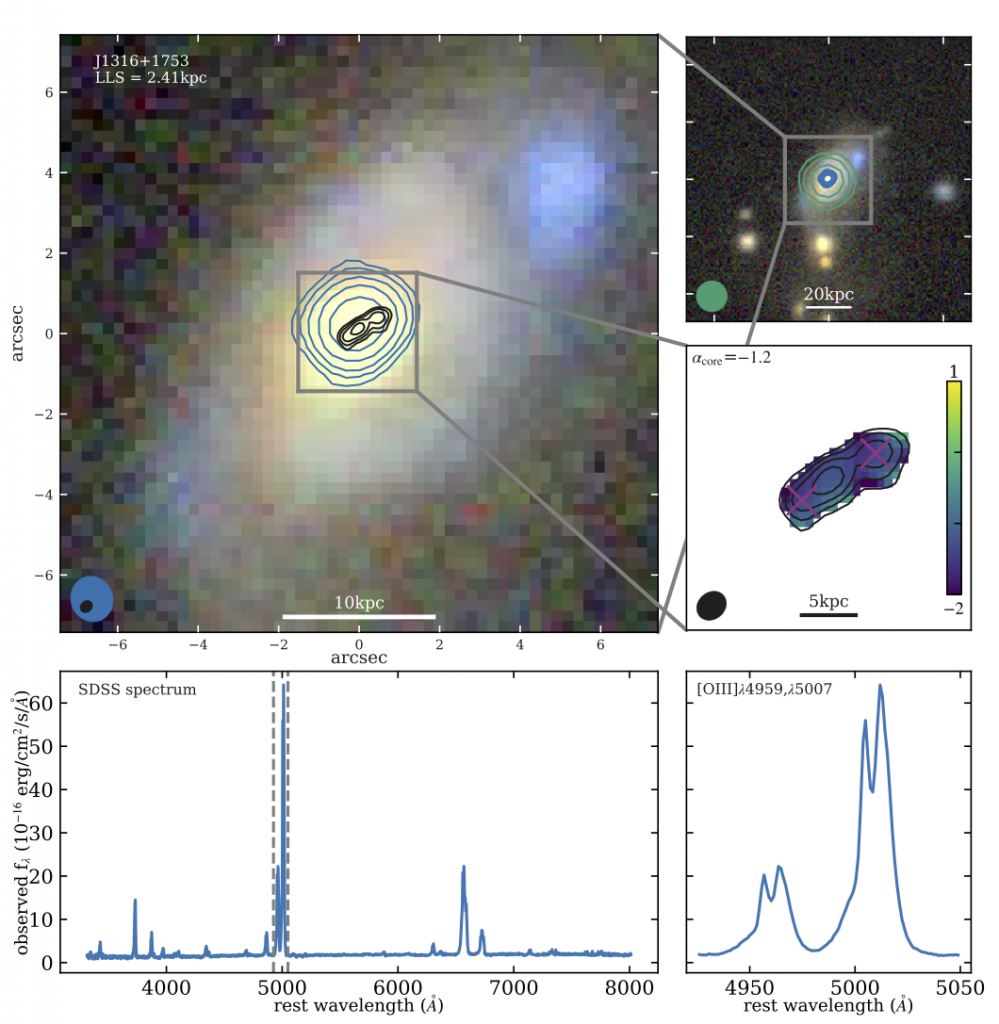
J1316+1753
This target has a dedicated study in Girdhar et al. 2022, including MUSE, ALMA and VLA data. The study investigates the impact of the small jets, inclined into the disk, on the host galaxy multi-phase interstellar medium. Evidence for feedback is also observed based on the enhanced stellar velocity dispersion along the jet axis.
Molecular Gas
CO(2-1) APEX measurements presented in Jarvis+20. Emission-line data available here and machine-readable tabulated data here.
CO(1-0) ACA data, and APEX data for CO(2-1), and CO(3-2) from Molyneux+23, available here.
Radio Data
VLA L-band (1.4GHz) and C-band (6GHz) images were produced for both Jarvis+19 and Jarvis+21. Although using the same data these images are slightly different as they were created for different reasons.
Data from Jarvis+19 (including radio and IFU data) available here.
L-band (1.4GHz) VLA images from Jarvis+21 are available here.
C-band (6GHz) VLA images from Jarvis+21 are available here.
In-band spectral index maps (4-8GHz) from Jarvis+21 are available here.
e-MERLIN 6GHz radio maps from Njeri+25 are available here.
IFU Data
GMOS data cube and [O III] maps from Jarvis+19 available here.
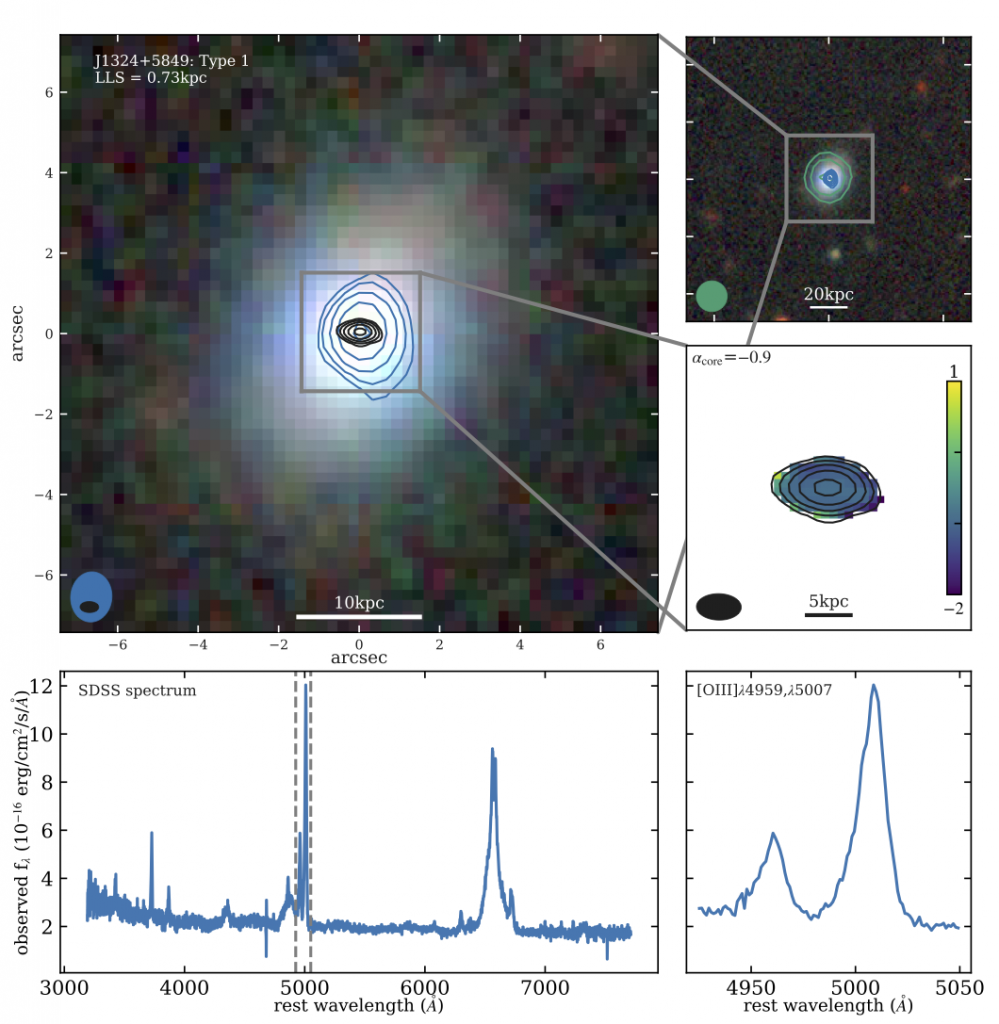
J1324+5849
Radio Data
L-band (1.4GHz) VLA images from Jarvis+21 are available here.
C-band (6GHz) VLA images from Jarvis+21 are available here.
In-band spectral index maps (4-8GHz) from Jarvis+21 are available here.
e-MERLIN 6GHz radio maps from Njeri+25 are available here.
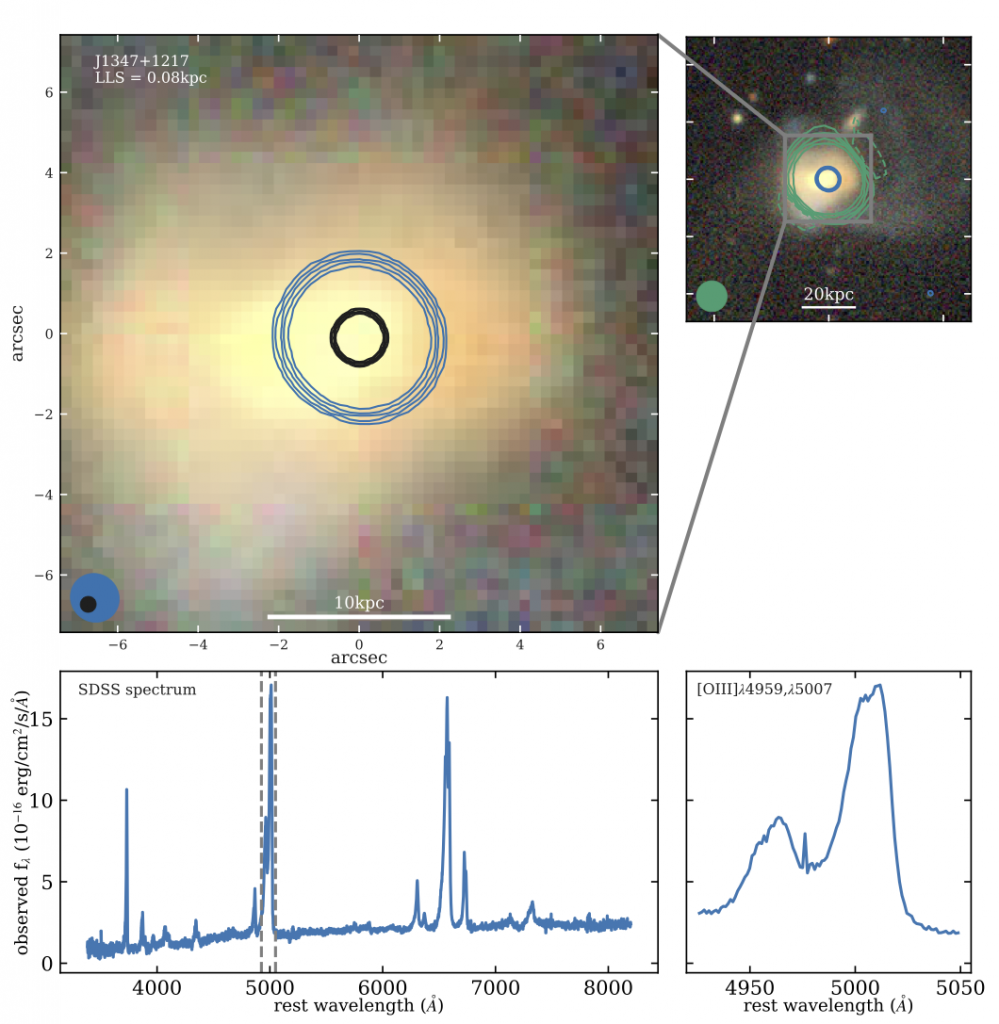
J1347+1217
Radio Data
L-band (1.4GHz) VLA images from Jarvis+21 are available here.
C-band (6GHz) VLA images from Jarvis+21 are available here.
In-band spectral index maps (4-8GHz) from Jarvis+21 are available here.
e-MERLIN 6GHz radio maps from Njeri+25 are available here.
J1355+2046
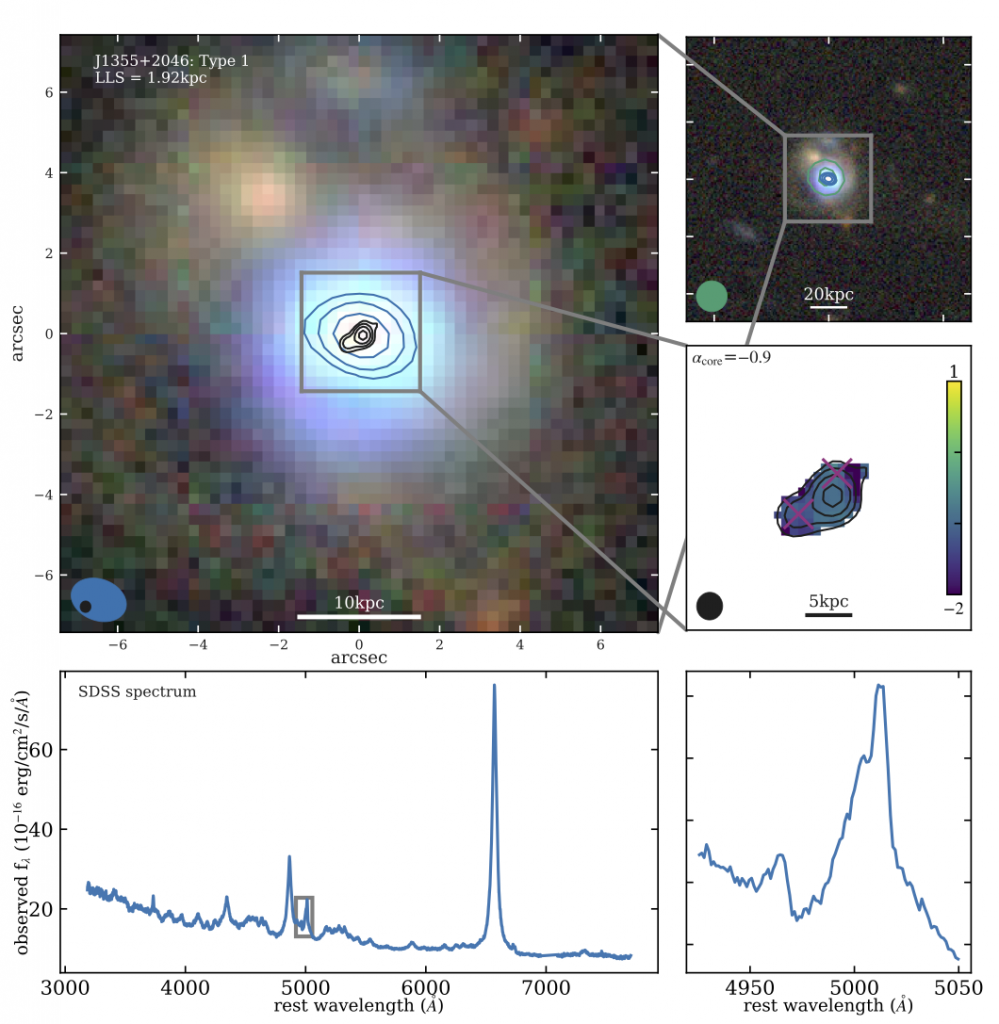
Radio Data
L-band (1.4GHz) VLA images from Jarvis+21 are available here.
C-band (6GHz) VLA images from Jarvis+21 are available here.
In-band spectral index maps (4-8GHz) from Jarvis+21 are available here.
e-MERLIN 6GHz radio maps from Njeri+25 are available here.
J1356+1026
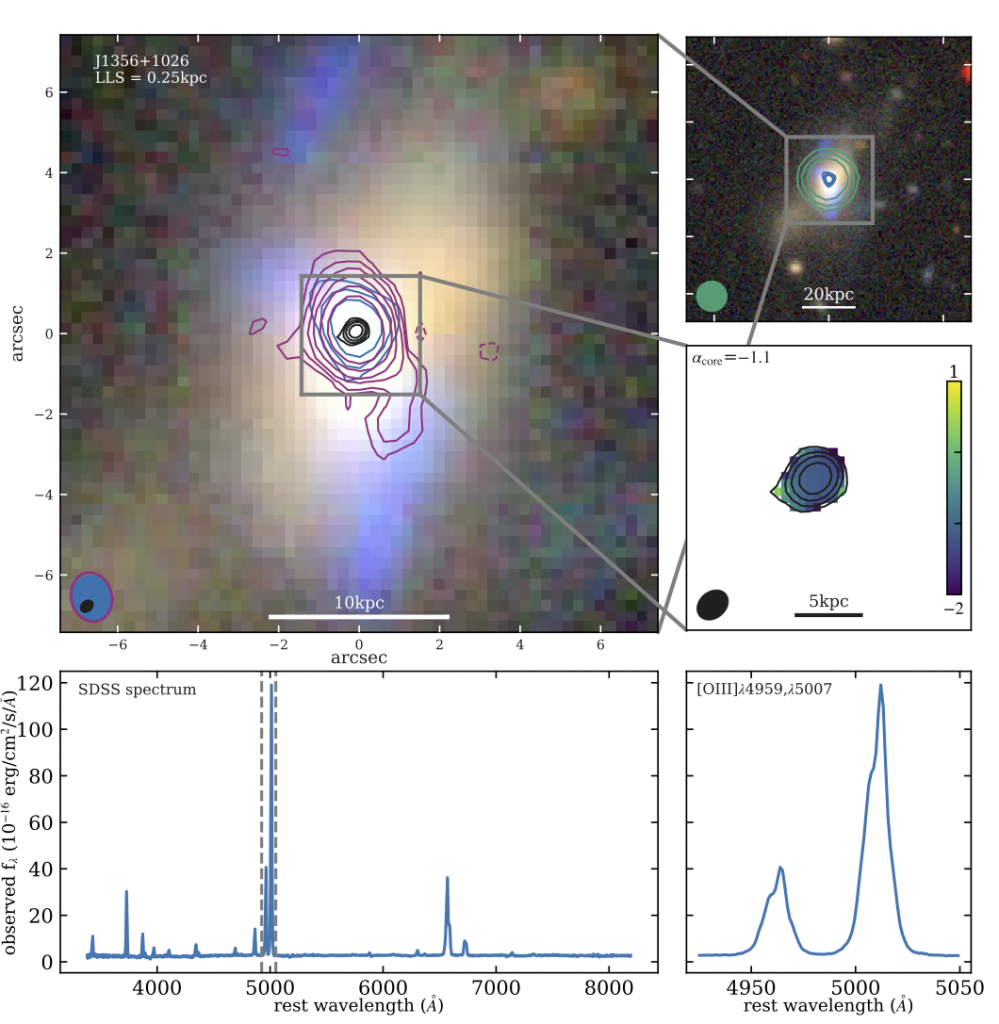
Molecular Gas
CO(2-1) APEX measurements presented in Jarvis+20. Emission-line data available here and machine-readable tabulated data here.
APEX data for CO(2-1), and CO(3-2) from Molyneux+23, available here.
Radio Data
VLA L-band (1.4GHz) and C-band (6GHz) images were produced for both Jarvis+19 and Jarvis+21. Although using the same data these images are slightly different as they were created for different reasons.
Data from Jarvis+19 (including radio and IFU data) available here.
L-band (1.4GHz) VLA images from Jarvis+21 are available here.
C-band (6GHz) VLA images from Jarvis+21 are available here.
In-band spectral index maps (4-8GHz) from Jarvis+21 are available here.
Stokes I, Q, U images (polarization data), a spectral index map presented in Silpa,S.+22 are all available here: data.ncl.ac.uk.
e-MERLIN 6GHz radio maps from Njeri+25 are available here.
IFU Data
GMOS+VIMOS data cubes and [O III] maps from Jarvis+19 available here.
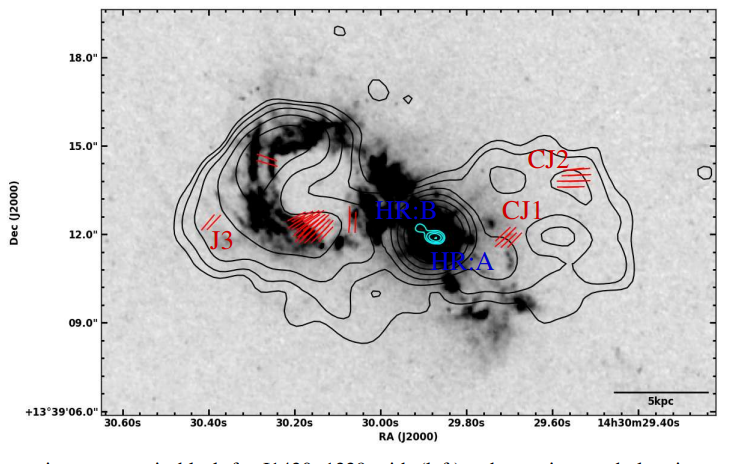
J1430+1339
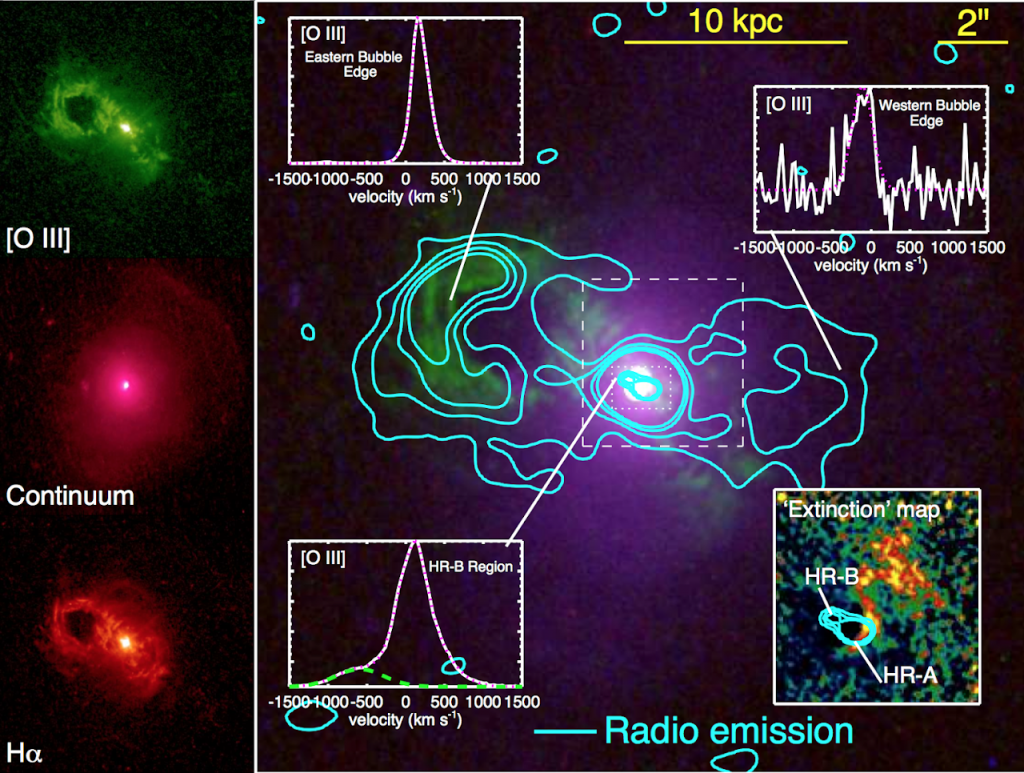
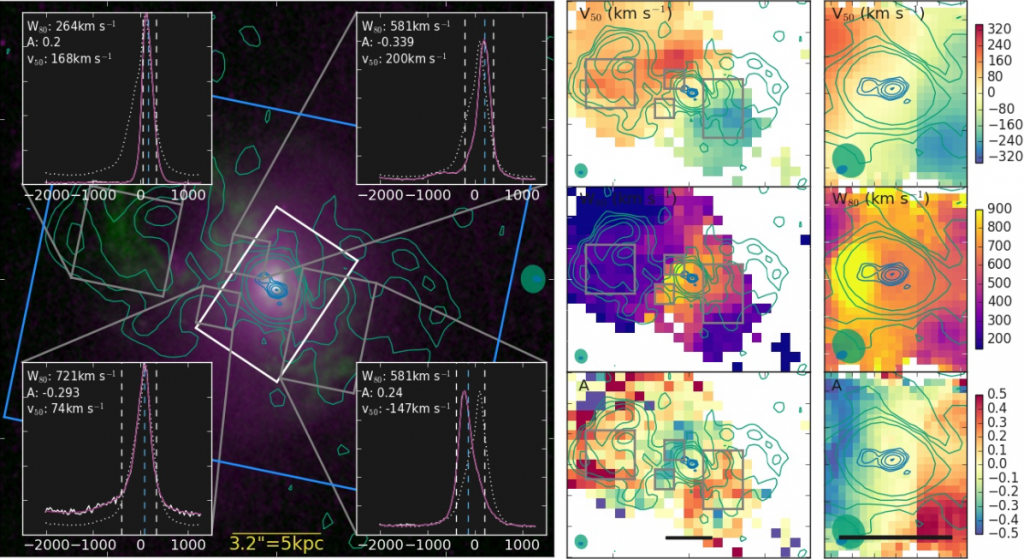
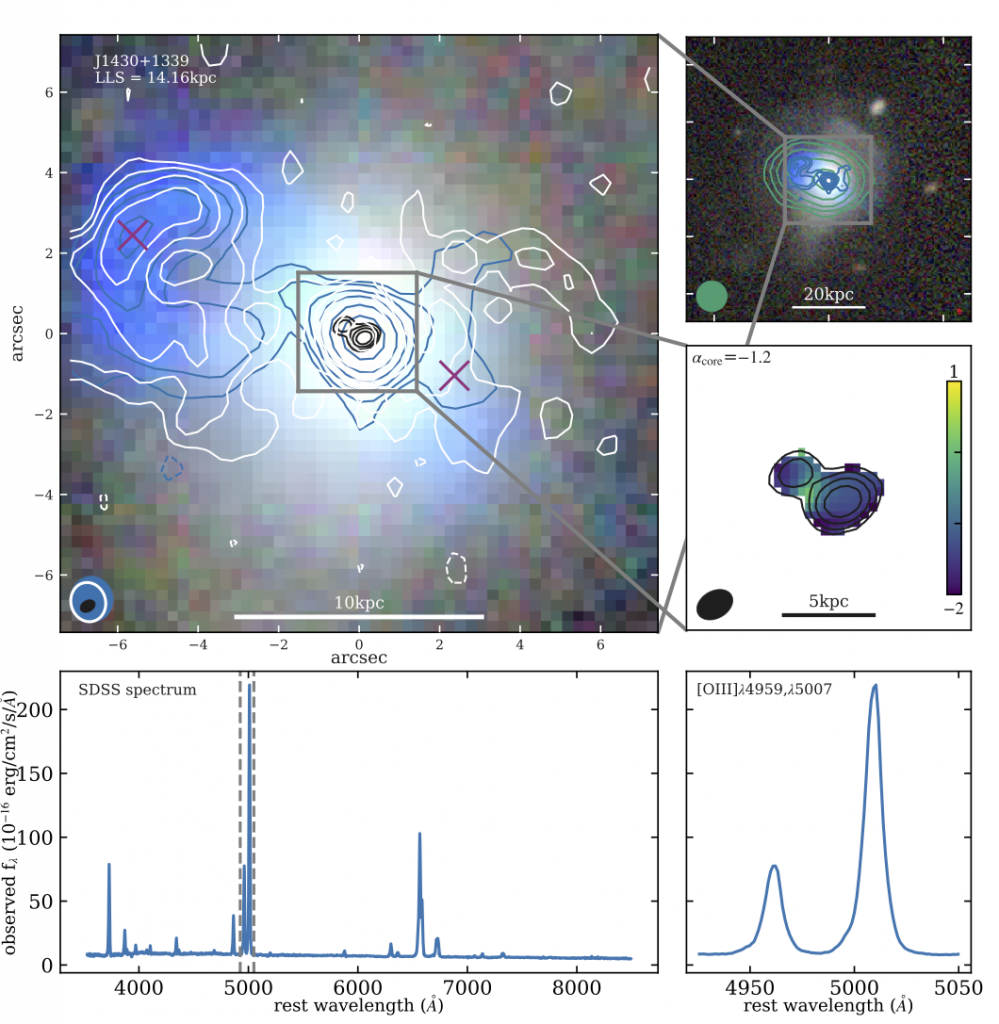
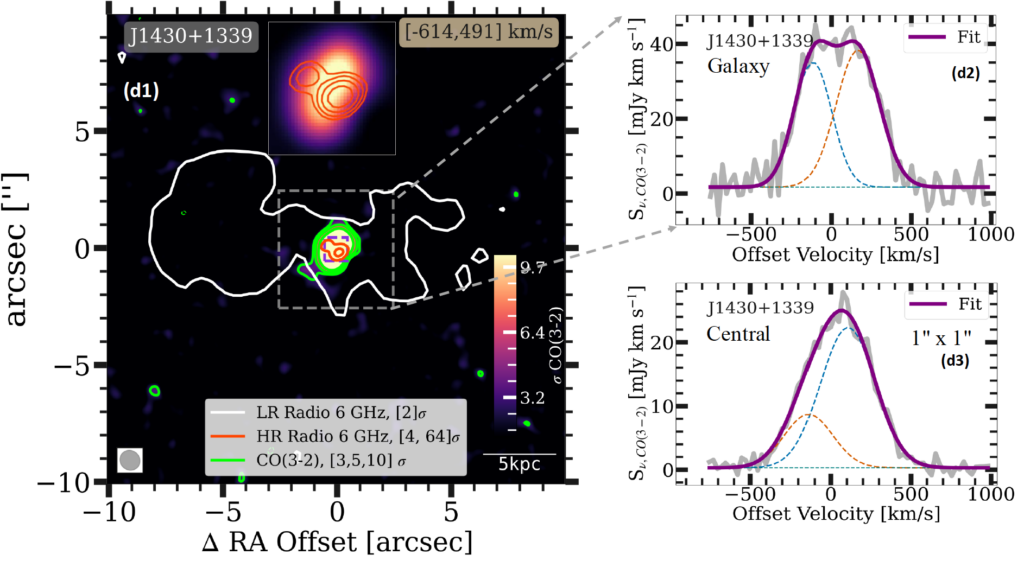
Molecular Gas
CO(2-1) APEX measurements presented in Jarvis+20. Emission-line data available here and machine-readable tabulated data here.
Radio Data
VLA L-band (1.4GHz) and C-band (6GHz) images were produced for Harrison+15, Jarvis+19 and Jarvis+21. Although using the same data these images are slightly different as they were created for different reasons.
Radio images from Harrison+15 are available here.
Data from Jarvis+19 (including radio and IFU data) available here.
L-band (1.4GHz) VLA images from Jarvis+21 are available here.
C-band (6GHz) VLA images from Jarvis+21 are available here.
In-band spectral index maps (4-8GHz) from Jarvis+21 are available here.
Stokes I, Q, U images (polarization data), a spectral index map presented in Silpa,S.+22 are all available here: data.ncl.ac.uk.
e-MERLIN 6GHz radio maps from Njeri+25 are available here.
IFU Data
GMOS+VIMOS data cubes and [O III] maps from Jarvis+19 available here.
X-ray Data
The Chandra images and the XMM and Chandra spectra from Lansbury+18 are available to download from here.
J1436+4928
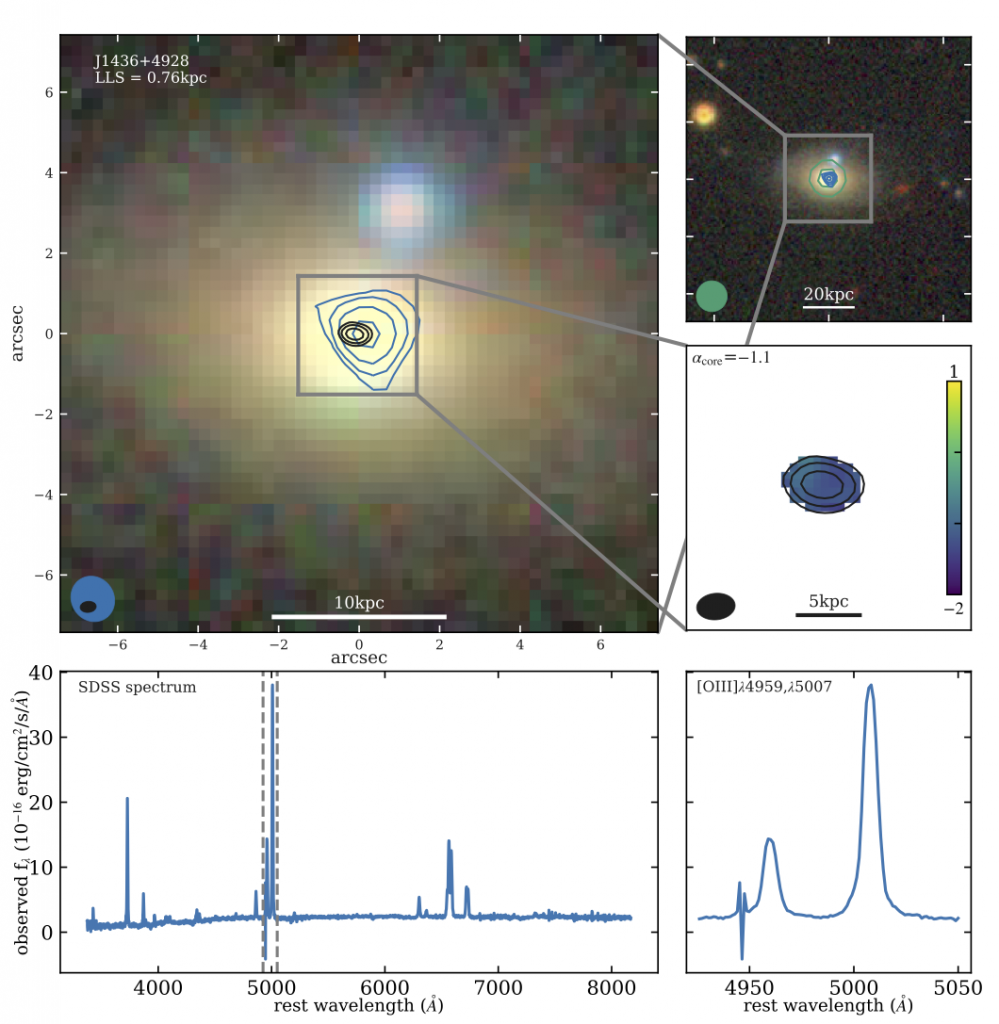
Radio Data
L-band (1.4GHz) VLA images from Jarvis+21 are available here.
C-band (6GHz) VLA images from Jarvis+21 are available here.
In-band spectral index maps (4-8GHz) from Jarvis+21 are available here.
e-MERLIN 6GHz radio maps from Njeri+25 are available here.
J1454+0803
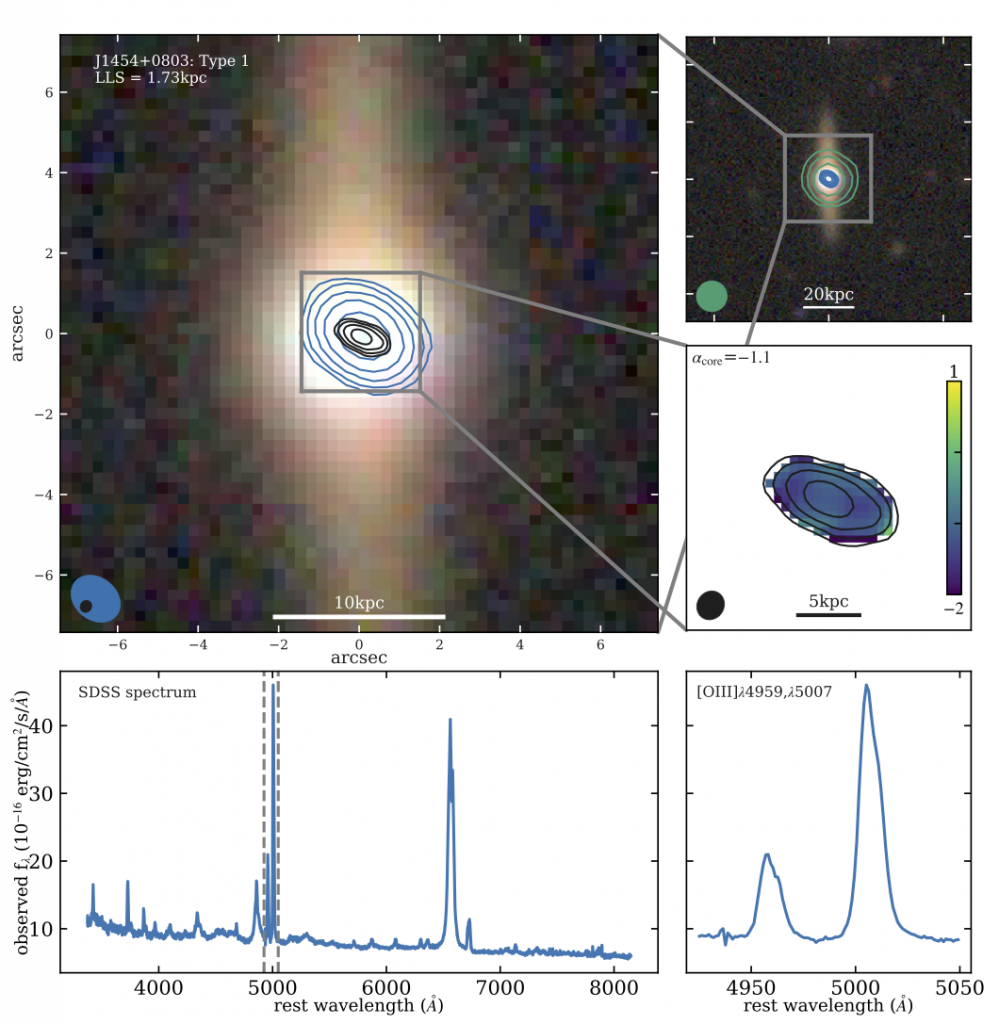
Radio Data
L-band (1.4GHz) VLA images from Jarvis+21 are available here.
C-band (6GHz) VLA images from Jarvis+21 are available here.
In-band spectral index maps (4-8GHz) from Jarvis+21 are available here.
e-MERLIN 6GHz radio maps from Njeri+25 are available here.
J1509+1757
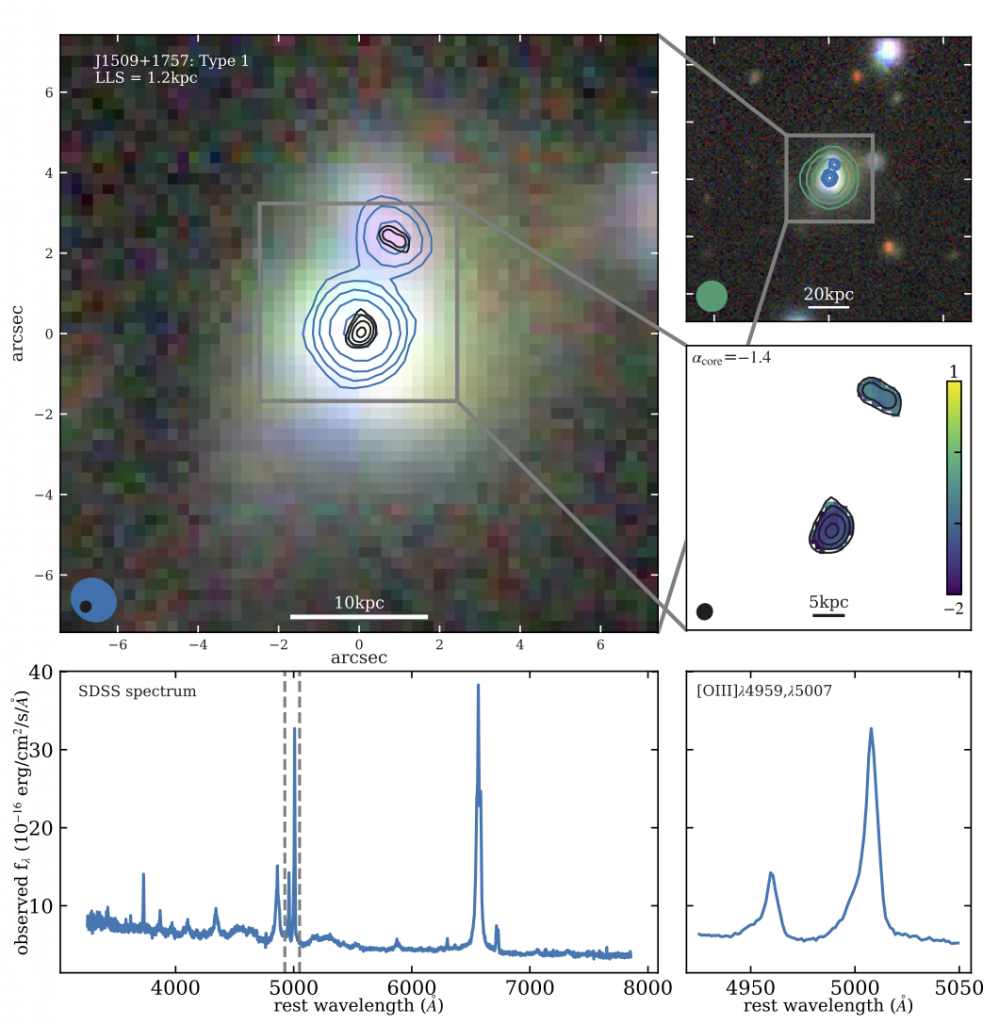
Radio Data
L-band (1.4GHz) VLA images from Jarvis+21 are available here.
C-band (6GHz) VLA images from Jarvis+21 are available here.
In-band spectral index maps (4-8GHz) from Jarvis+21 are available here.
e-MERLIN 6GHz radio maps from Njeri+25 are available here.
J1518+1403
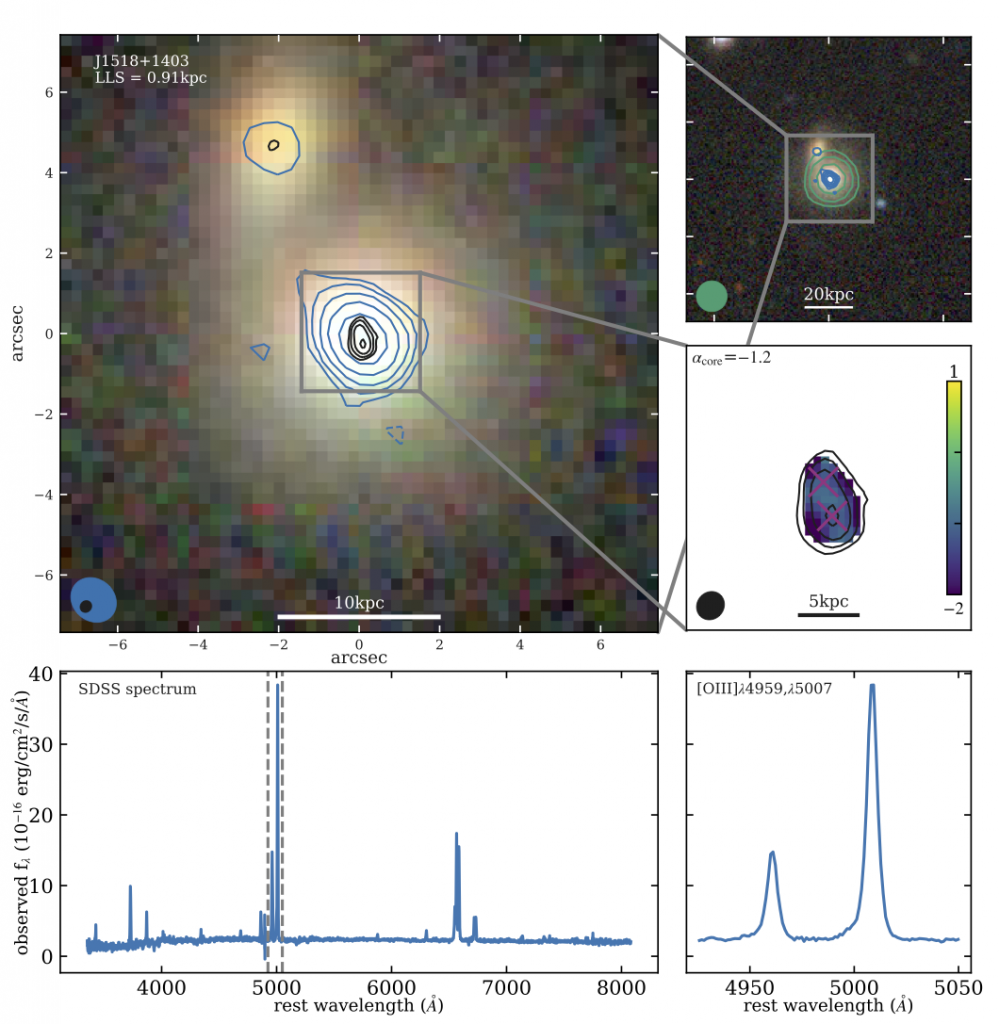
Radio Data
L-band (1.4GHz) VLA images from Jarvis+21 are available here.
C-band (6GHz) VLA images from Jarvis+21 are available here.
In-band spectral index maps (4-8GHz) from Jarvis+21 are available here.
e-MERLIN 6GHz radio maps from Njeri+25 are available here.
CO Data
CO(1-0) ACA data, and APEX data for CO(2-1), CO(3-2) and CO(7-6) from Molyneux+23, available here.
J1553+4407
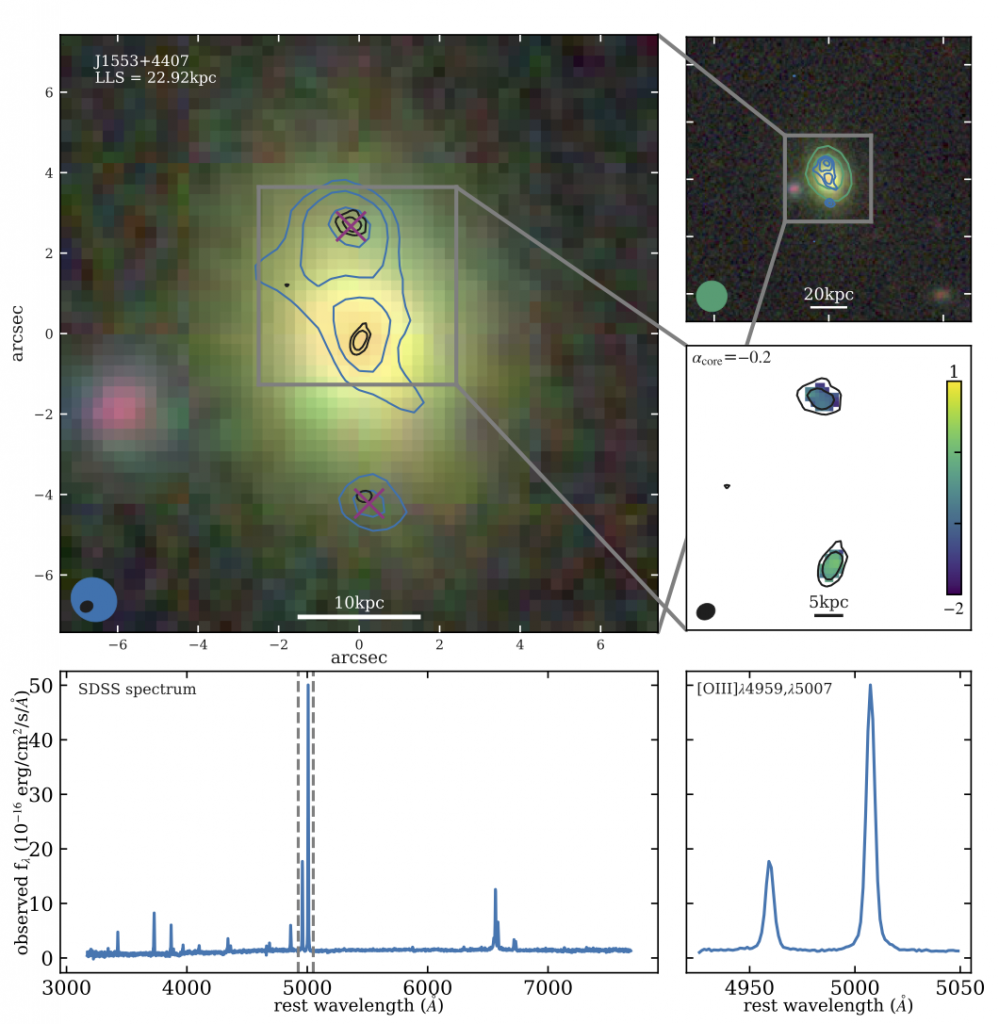
Radio Data
L-band (1.4GHz) VLA images from Jarvis+21 are available here.
C-band (6GHz) VLA images from Jarvis+21 are available here.
In-band spectral index maps (4-8GHz) from Jarvis+21 are available here.
e-MERLIN 6GHz radio maps from Njeri+25 are available here.
J1555+5403
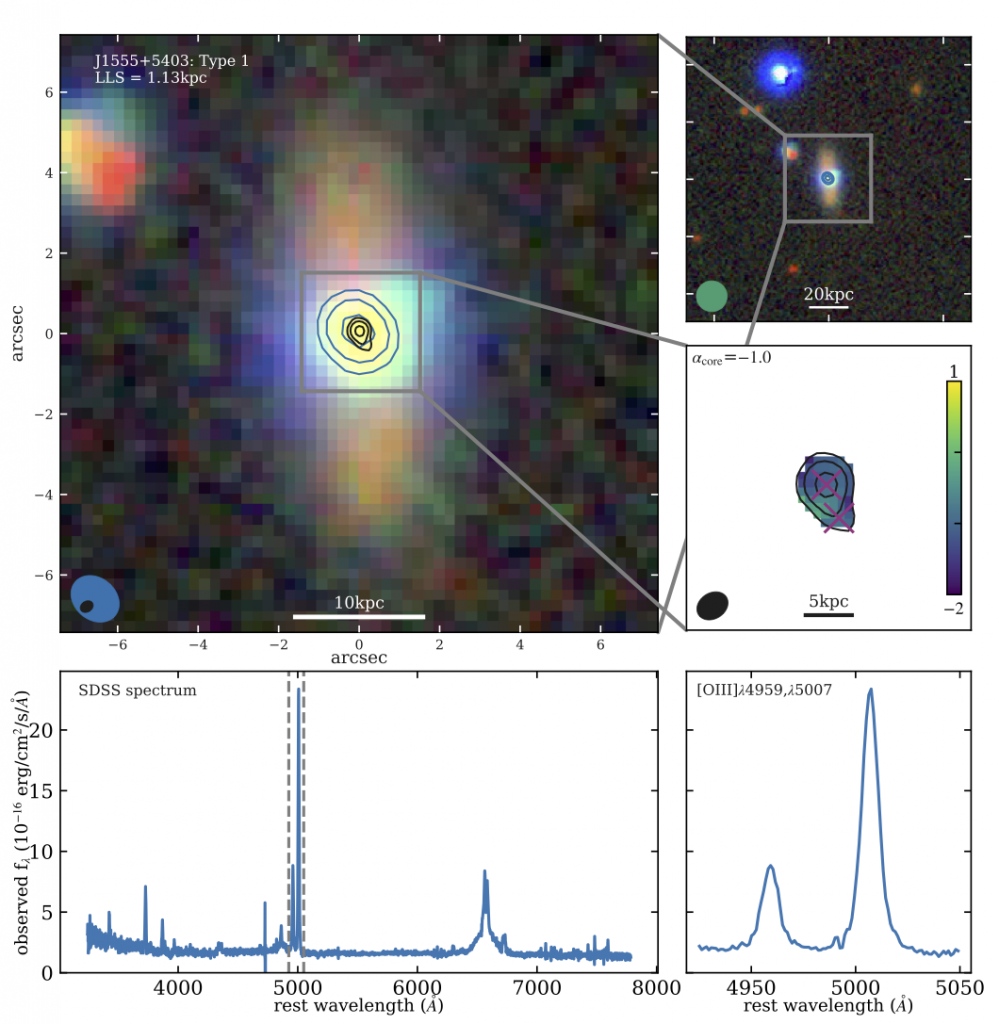
Radio Data
L-band (1.4GHz) VLA images from Jarvis+21 are available here.
C-band (6GHz) VLA images from Jarvis+21 are available here.
In-band spectral index maps (4-8GHz) from Jarvis+21 are available here.
e-MERLIN 6GHz radio maps from Njeri+25 are available here.
J1655+2146
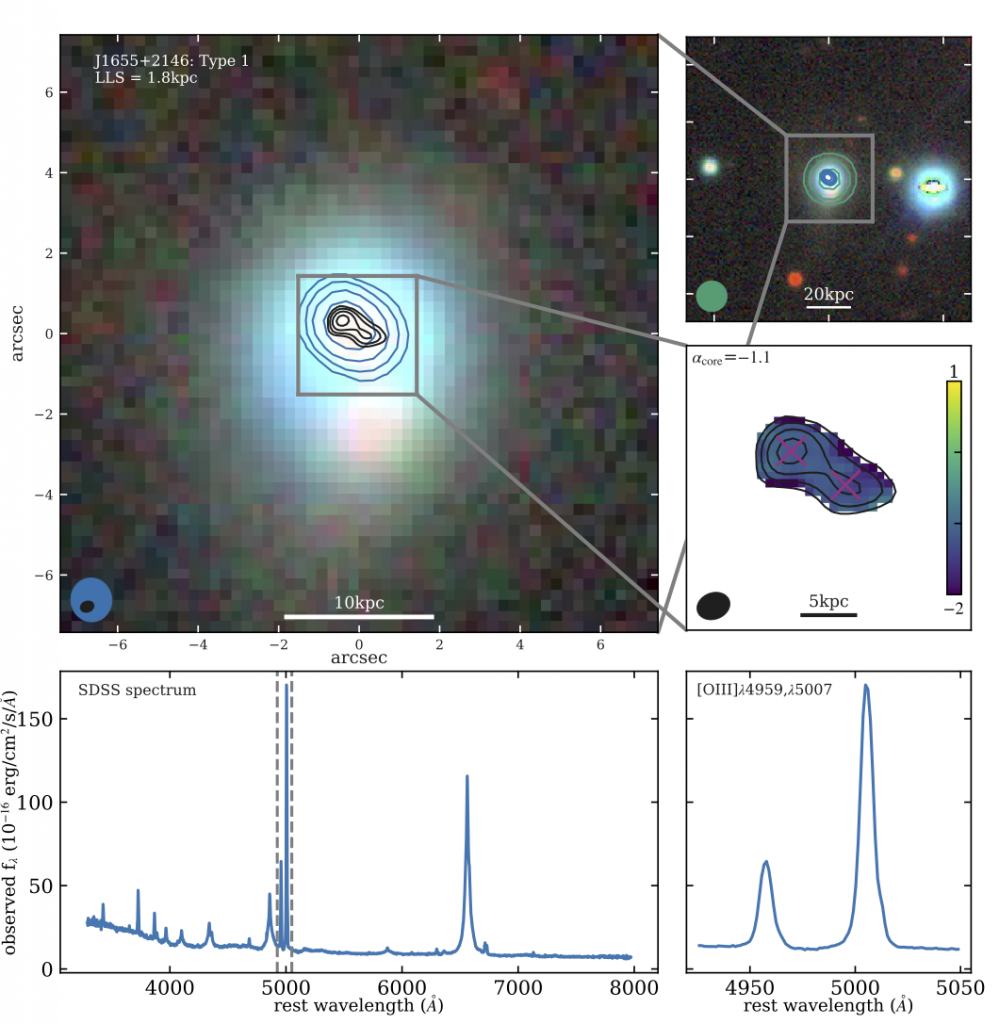
Radio Data
L-band (1.4GHz) VLA images from Jarvis+21 are available here.
C-band (6GHz) VLA images from Jarvis+21 are available here.
In-band spectral index maps (4-8GHz) from Jarvis+21 are available here.
e-MERLIN 6GHz radio maps from Njeri+25 are available here.
J1701+2226
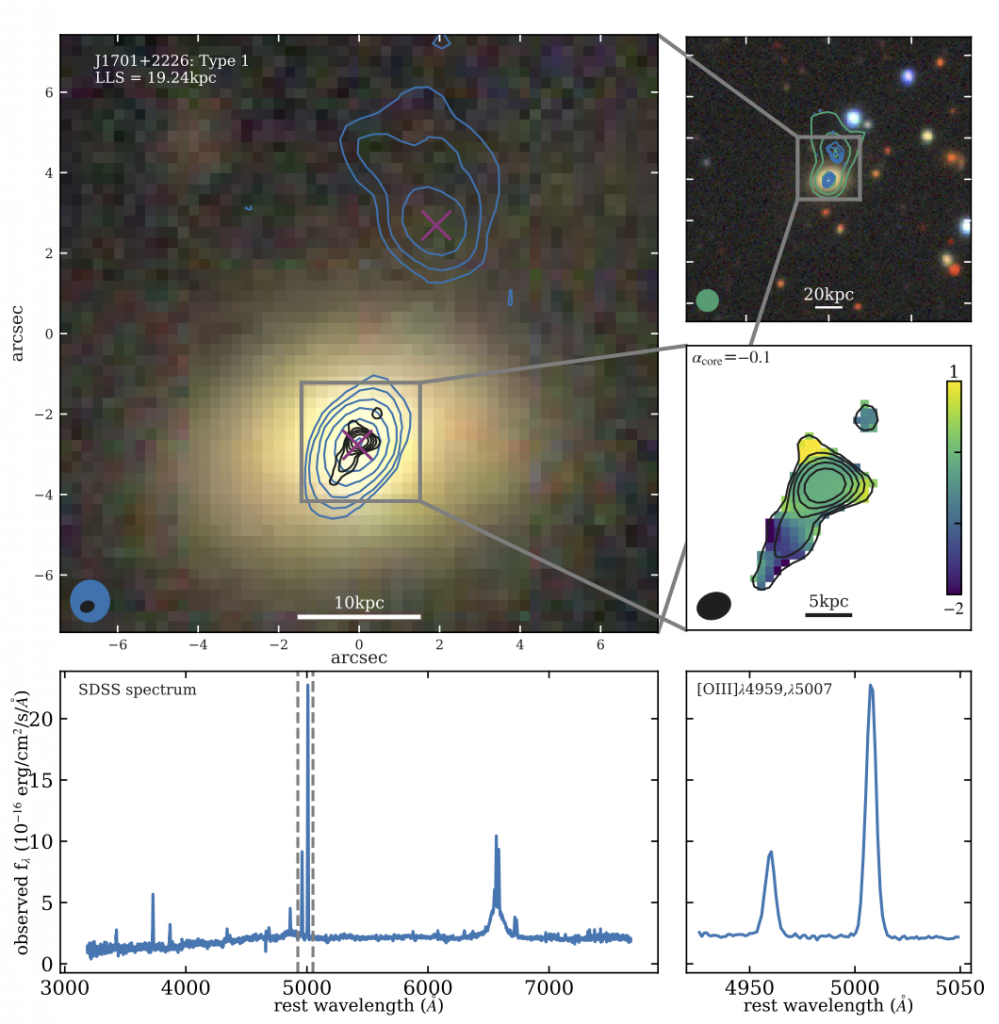
Radio Data
L-band (1.4GHz) VLA images from Jarvis+21 are available here.
C-band (6GHz) VLA images from Jarvis+21 are available here.
In-band spectral index maps (4-8GHz) from Jarvis+21 are available here.
e-MERLIN 6GHz radio maps from Njeri+25 are available here.
J1715+6008
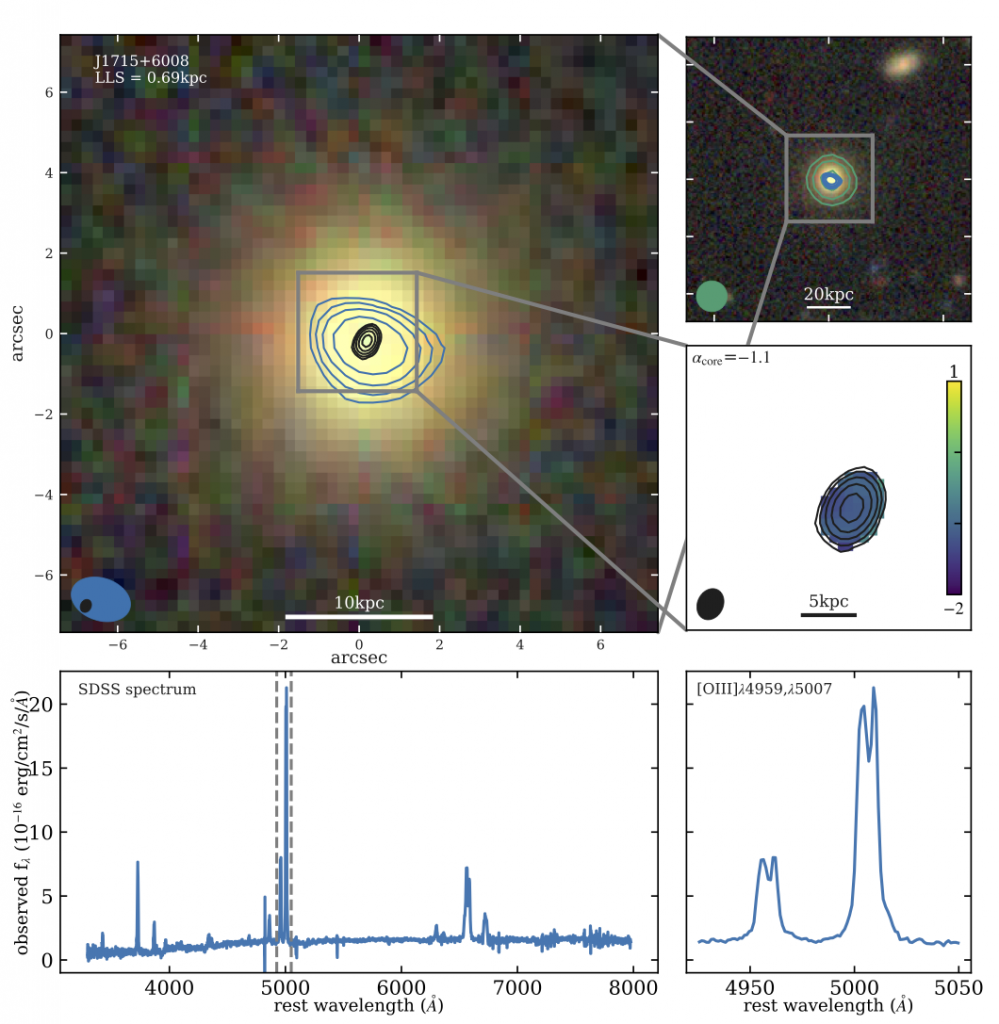
Radio Data
L-band (1.4GHz) VLA images from Jarvis+21 are available here.
C-band (6GHz) VLA images from Jarvis+21 are available here.
In-band spectral index maps (4-8GHz) from Jarvis+21 are available here.