
Ivor Catt reminded yesterday about the Wakefield 4 experiment, the description can be found here:
http://www.ivorcatt.co.uk/wak4.pdf
I have sketched the space-time cause-effect diagram for it:
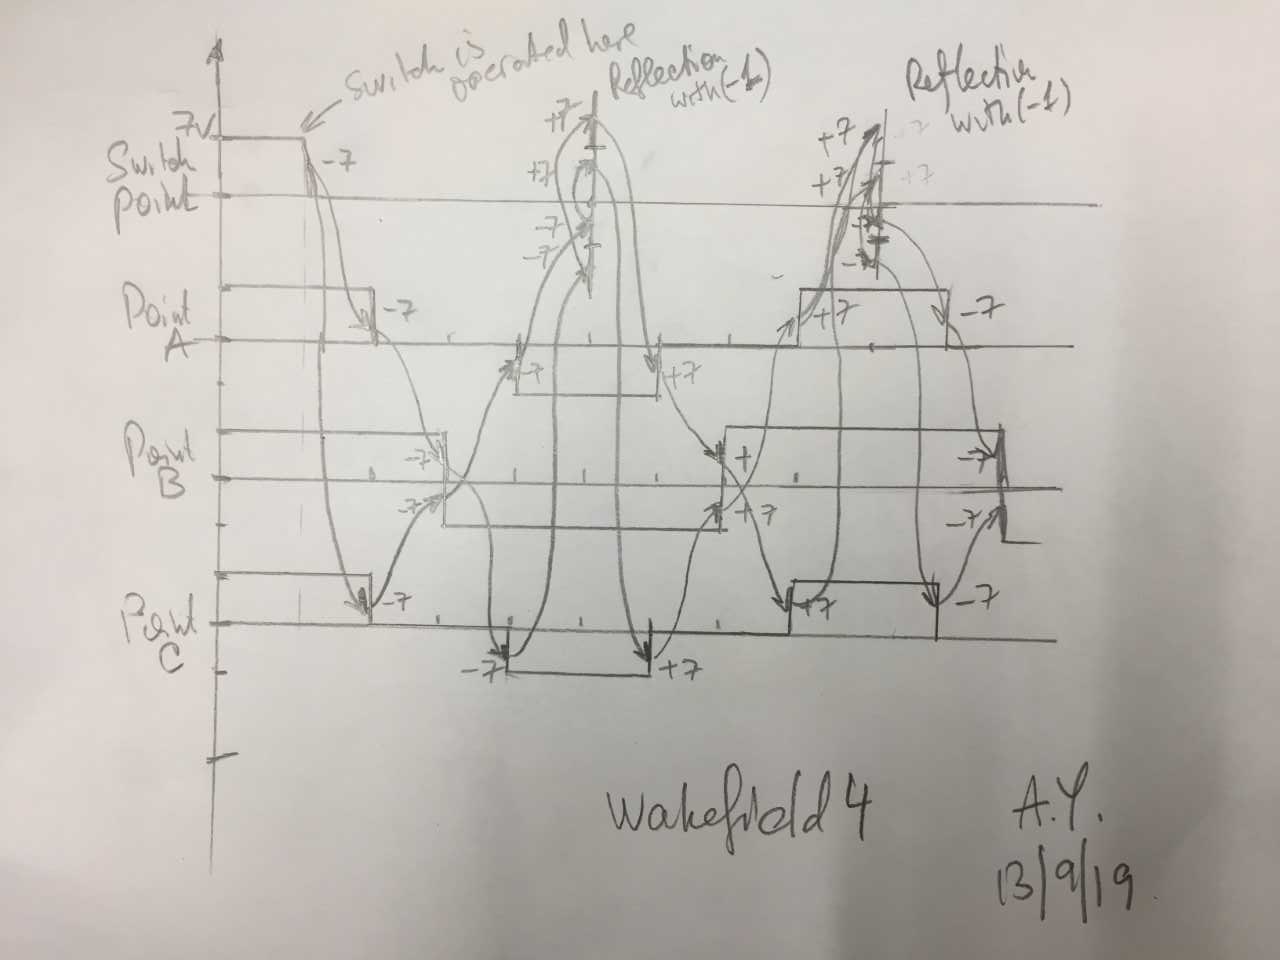
It can be seen that in the point next to the switch after we short-circuit the cable to ground, although the normal state of potential is 0V, we have transfer of energy vi the reflection of steps with a coefficient (-1). Energy comes to this point from both sides independently. This means that as soon as say a falling step of -7V arrives from the side of point A, it gets reflected into a rising step +7V and hence the overall level of potential is unchanged.
The mid-point B oscillates with the overall amplitude of 14V from +7V to -7V.
If you look at the experimental traces from the above link http://www.ivorcatt.co.uk/wak4.pdf
especially with the compressed time resolution, we have an interesting effect of sine-like wave oscillation at the level of steps (rather than conventional sine-wave as an envelope in condensed circuit-theoretic LC circuits) which takes place in the middle of the loop – point B, and this oscillation is totally ‘hidden’ from the view at say point of the switch, which ‘thinks’ that the cable is in static 0V state. This is a wonderful effect from the distributed-capacitor of the Tx line. The moving energy current is invisible to the outside world from the terminal point but it actually stays in the Tx line for a a fairly long time even with the unmitigated natural losses of the real-copper cable. The system has hidden memory to perform energy transfer!