
The hosting of the British Science Festival 2013 by Newcastle University gave staff and researchers of the School of Civil Engineering and Geosciences a chance to “show off” some of their research to the general public, whilst also gave the opportunity to generate interest in science, technology, engineering and maths (STEM) subjects via hands-on activities delivered to school children from the North East. One such activity, named “BlueLine”, organised and delivered by Dr Geoff Parkin (Senior Lecturer in Hydrology), Professor Hayley Fowler (Professor of Climate Change Impacts), Dr Vedrana Kutija (Lecturer in Computational Hydraulics), Dr Claire Walsh (Researcher in Water Resources), Mr Vassilis Glenis (Researcher in Water Resources), Mr Philip James (Senior Lecturer in GIS), and Mr David Alderson (Researcher in GeoInformatics), focussed on explaining the complex nature of flooding and extreme flooding to separate groups of secondary school children from local schools in the North East. The schools represented are listed below:
– Shotton Hall Academy, Peterlee
– Berwick Academy, Berwick
– Ponteland High School, Ponteland
– Thomas Hepburn School, Felling
The sessions began with Dr Parkin delivering a brief summary of some of the causes of flooding and extreme flooding, citing many references that relate to flood events experienced in recent years within the UK, including those that occurred in Cumbria in 2005, Tyne and Wear in 2008 and 2012, and many others. However that was just the standard “in-class” part of the activity, and although the seminar generated interest from the students in such topics as the water cycle, climate change, global warming, and the impacts of flooding, the “really” interesting part came when the children were let loose outside on the University campus, to take part in a crowd-sourcing exercise.
Crowd-sourcing in it’s most simple terms involves members of the public contributing data, information, comments, stories, pictures etc, which are then subsequently used within some form of analysis. Within the School of Civil Engineering and Geosciences, there has been a concerted effort since the flooding in a local market town, Morpeth, in 2008, by water and geomatics researchers and lecturers alike to collect as much crowd-sourced based information about flooding and flood events that occur within the region. The contributions from the general public about the locations and timings of floods, alongside photography giving a reasonable indication of flood depths, levels and wrack lines, can be used to validate computer simulations of flood models, developed within the School. Some of the results of these crowd-sourcing endeavours can be found here.
So the purpose of crowd-sourcing in the context of flooding was explained to the students in attendance at the Blueline event, and how it can be used to help better understand how a flood propagates through different environments. Since the floods in 2008 and 2012, Philip James has developed an Android-compatible “app” that helps to facilitate this process, by allowing a user to use the location technologies within an Android device (tablet, smart phone etc) to locate themselves, and then subsequently use the camera to take a picture. The great thing about the app is that this data can then be sent to a server and published immediately onto a website, giving a near-real time record and subsequent archive of a flood event. As stated, this type of data is invaluable to understanding how a flood arises and then subsides. For more information about the app and the technologies employed to deliver this solution, have a look here.
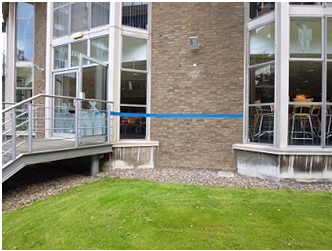
So the school children were escorted outside where a “pretend” flood had been erected around Newcastle University campus (effectively just a line of blue tape indicating a flood level based on a particular amount of rainfall), and asked to use the app and a tape measure to record information about the depth of this “flood”. This seemed to go down a storm (sorry) as it offered them a chance to do all the things that children seemingly would rather be doing i.e. being outside and playing with technology! Each pairing were asked to try to record at least one reading at each point where we stopped around campus. Further to this a series of QR codes had been erected along the blue line that the students were able to scan, subsequently directing them to a site of historical photography of the flooding that occurred on campus in 2012, as well as some “constructed” imagery of the imaginary flood that they were measuring. For more information on this site and the photos, please follow this link.
Post by David Alderson
 |
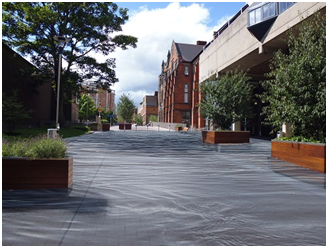 |
| The “BlueLine” around campus, denoting an imaginary flood level | The reconstructed flood represented by the “BlueLine” |