Paper: Signal-to-noise in gravitational-wave detection

Common-spectrum process versus cross-correlation for gravitational-wave searches using pulsar timing arrays, by Joseph D. Romano, Jeffrey S. Hazboun, Xavier Siemens, and Anne M. Archibald

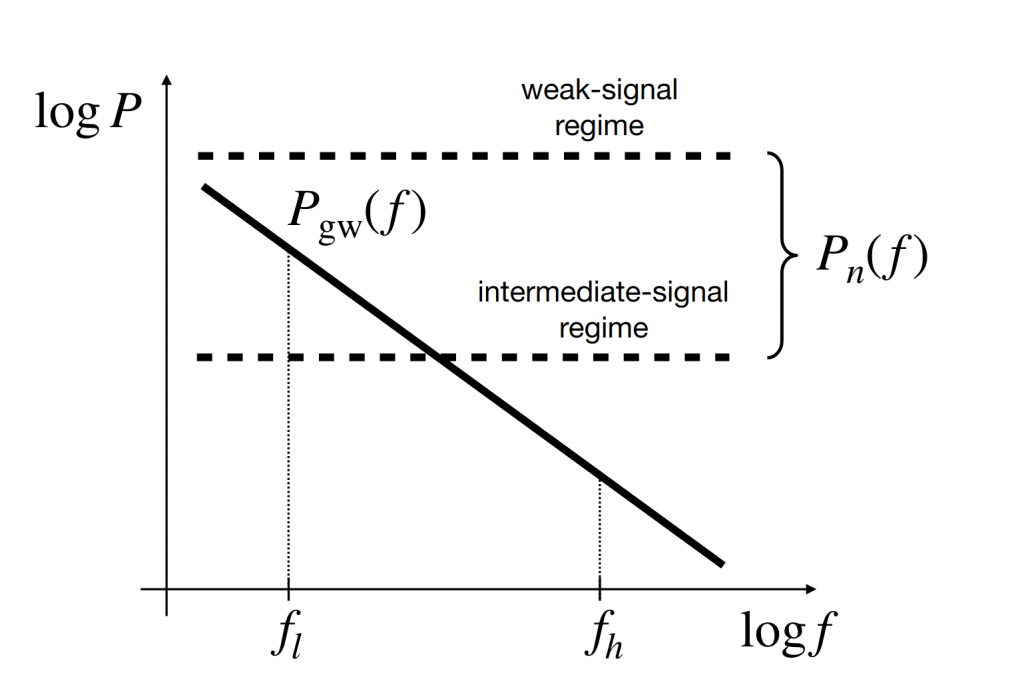
Pulsar timing arrays are trying to detect gravitational waves with periods of years by sensing their effect on the arrival time of pulses from pulsars all over the sky. A gravitational wave passing over the Earth compresses space in some directions and expands it in others, and this should produce a correlated pattern of delays between multiple pulsars. At these frequencies, the signal we expect to detect is a mixture of gravitational waves from all the supermassive black hole binaries in the Universe; this should look like random noise with a power-law spectrum, strongest at the lowest frequencies. Recently, NANOGrav detected hints of such a spectrum. It detected these hints not in the cross-correlations between pulsars, but as a common spectrum of noise in the autocorrelations of individual pulsars. By contrast, LIGO’s attempt to detect a stochastic gravitational-wave background is expected to find evidence in the cross-correlations first. (And of course we will find cross-correlations much more convincing evidence for a gravitational-wave origin than auto-correlations – there are many fewer alternative sources of cross-correlated noise.) So why did NANOGrav find evidence first in the autocorrelations? This paper uses a simple toy model to explain why.

The gravitational-wave signal, with a “red” spectrum where the lowest frequencies dominate, must be distinguished from pulsar intrinsic noise, which is largely the same at all frequencies. If the non-gravitational noise dominated even at low frequencies, as it does for LIGO, then the cross-correlations provide greater averaging and a detection will happen first in the cross-correlations. If the gravitational-wave signal is stronger than the noise at low frequencies, as it is for current pulsar timing arrays, then what limits our ability to characterize it is the fact that it is itself a noise process – its own intrinsic variance limits our ability to measure it well enough to believe it is real. In this case the cross-correlations no longer have independent noise, and averaging them provides much less benefit. In this situation, the paper shows, autocorrelations have a higher signal-to-noise.

Paper: New Tool for Pulsar Timing

PINT: A Modern Software Package for Pulsar Timing by Jing Luo, Scott Ransom, Paul Demorest, Paul S. Ray, Anne Archibald, Matthew Kerr, Ross J. Jennings, Matteo Bachetti, Rutger van Haasteren, Chloe A. Champagne, Jonathan Colen, Camryn Phillips, Josef Zimmerman, Kevin Stovall, Michael T. Lam, and Fredrick A. Jenet.

The defining characteristic of pulsars — that they emit regular pulses of radio waves or other radiation — also provides one of the most powerful tools for studying them and their environments: we can measure the arrival time of these pulses at our telescopes quite precisely. These arrival times carry information about the rotation of the pulsar (affected by the energy loss to a particle wind and by interaction of the crust with the internal superfluid), the orbit of the pulsar if it’s in a binary system (including tidal and relativistic effects on the orbit, and relativistic time dilation and light bending), the location of the pulsar in relation to the Earth’s orbit (including its distance), the interstellar medium (varying as our line of sight sweeps through it), and possibly even gravitational waves passing over the Earth. But to extract the interesting science from these measurements, we need a tool that models how all these physical processes affect the observed arrival times. PINT is such a tool.

Numerous data points with error bars, all lying near a horizontal line.
The difference between observed arrival times and arrival times modelled with PINT. The parameters of the model, including position on the sky, pulsar spin period, and pulsar orbital parameters, have been adjusted to match the observed data as well as possible, and the discrepancies are within about 20 microseconds, and are broadly consistent with the uncertainties on the measurements themselves.

Of the tools that exist to do this task, TEMPO has a proud history of scientific discovery but was written in FORTRAN in the 1980s and was never designed to operate with sub-microsecond accuracy. The tool TEMPO2 was meant to be its successor, written in the 2000s, but much of TEMPO2’s code is simply original TEMPO code converted to C++, and the package can be difficult to work with. PINT is intended as a largely independent development project, and indeed the process of developing PINT has revealed at least one long-standing error (now fixed) in TEMPO2’s computations. PINT is also written to be a flexible python library, well documented and well tested, so that its data structures and tools can be applied to tasks that do not fit naturally into traditional pulsar timing.

PINT is an open-source project under active development; you can find it on GitHub. It has extensive, if still in-progress, documentation as well.

Talk: Lessons from timing the triple system

This was a lightning talk I gave at the NANOGrav Fall 2020 meeting. Our project to test the Strong Equivalence Principle with PSR J0337+1715 did precision pulsar timing using the same telescopes in the same modes as NANOGrav but we found we needed to analyze the observations differently. So this is a lightning talk to point out some of the things we did differently and spark discussion about why. Most notably we found the polarization calibration procedure inadequate and so we implemented a procedure that fits for the polarization calibration simultaneously with fitting for the pulse arrival time; as a happy side-effect, polarization structure in the pulsar signal helps constrain pulse arrival times. You can read the slides, or the video is below (only the five minutes starting at 0:17 is my talk):

Event: LGBTQ+ in STEM day

Wednesday November 18th is LBGTQ+ in STEM day, a day to celebrate the diversity of people who contribute to science, technology, engineering, and mathematics. The date represents American astronomer and gay activist Frank Kameny’s Supreme Court fight against workplace discrimination. For more information see https://prideinstem.org/lgbtstemday/ .

#LGBTSTEMDAY 18 November 2020 #LGBTQSTEMDAY
LGBTQ+STEM Day on social media

Here at Newcastle, this falls in our undergraduate “buffer week”, a short breather between classes. We would therefore like to invite students (PGR and undergraduate, LGBTQ+ and allies) to an online social get-together at 12:00; the zoom details were sent by email, contact us if you’d like to be included. We will suggest a few topics for discussion and/or a few social games, but please feel free to have lunch or a snack handy, and we will break into smaller groups for conversation.

A few topics I’d be happy to hear discussion on:

  • What can Newcastle and our School do to better support LGBTQ+ people?
  • How is the pandemic difficult for LGBTQ+ people in particular?
  • How can we build supportive communities under these conditions?

I would also like to draw your attention to a few resources that may be of interest:

I know that this list is somewhat US-centric, and also centred around physics and astronomy; I welcome suggestions to broaden its scope.

Anne Archibald (she/her) and Danielle Leonard (she/her)

Paper: Polarization details shed light on the origin of fast radio bursts

Microsecond polarimetry of the repeating FRB 20180916B by K. Nimmo, J. W. T. Hessels, A. Keimpema, A. M. Archibald, J. M. Cordes, R. Karuppusamy, F. Kirsten, D. Z. Li, B. Marcote, and Z. Paragi

Fast Radio Bursts are millisecond-long incredibly bright radio flashes from distant galaxies. They are clearly produced by some kind of coherent emission process but the details or even basic nature of this process remain mysterious. Observational clues as to what it might be are few and far between, but polarization can provide hints about the geometry and magnetic fields in or near the emitting region. For this paper we managed to find polarization structure at very short timescales inside the burst – this is a clear sign that relatively small structures are producing elements of the radio burst. We still do not know what kind of structures these might be, but the Crab pulsar produces “giant pulses”, albeit still many orders of magnitude fainter than fast radio bursts, from coherent emission regions about 30 cm across. So this hint at detailed small-scale structure in fast radio bursts sheds a little light on their still-mysterious origin.

Plot showing bursts and their polarization.
Figure 4: detailed polarization structure of different sub-bursts. Note the microsecond time-scale on the bottom panel. Black bars indicate total intensity, red indicates linearly polarized intensity, and blue circularly polarized intensity (with sign). Note that these sub-bursts are almost completely linearly polarized. The grey bars in the top panels indicate the direction of linear polarization, with fuzziness indicating uncertainty. Note that there appears to be structured variation in the direction on microsecond timescales in the sub-burst shown in the bottom panel.