Hidden supermassive black holes reveal their secrets through radio signals

An artist’s impression of a red quasar. Red quasars are enshrouded by gas and dust, which may get blown away by outflows from the supermassive black hole, eventually revealing a typical blue quasar.
Credit: S. Munro & L. Klindt, Licence: Attribution (CC BY 4.0)

A team of international astronomers, led by Newcastle University, have used new data from the Dark Energy Spectroscopic Instrument (DESI), which is conducting a five year survey of large scale structure in the universe that will include optical spectra for ~3 million quasars; extremely bright galaxies powered by supermassive black holes. They found that quasars that contained more dust, and therefore appeared redder, were more likely to have stronger radio emission compared to the quasars that had very little-to-no dust, appearing very blue.

Photograph of the Mayall Telescope, which hosts the Dark Energy Spectroscopic Instrument, at Kitt Peak National Observatory. Credit: Marilyn Sargent, photographer. Copyright: © 2018 The Regents of the University of California, Lawrence Berkeley National Laboratory

Almost every known galaxy contains a supermassive black hole, which are black holes with a mass millions to billions that of our Sun, at its centre, including our own Milky Way. In some galaxies there is lots of material in the centre, feeding and growing this supermassive black hole, making it very energetic and “active”. The most powerful type of these active galaxies are called “quasars”, which are some of the brightest objects in the Universe. Most quasars appear very blue, due to the bright disc of matter that orbits and feeds the central supermassive black hole which is very bright in optical and ultraviolet wavelengths. However, astronomers have found that a significant fraction of these quasars appear very red, although the nature of these objects is still not well understood.

In order to understand the physics of these red quasars, “spectroscopic” measurements are required, which can be used to analyse the quasar light at different wavelengths. The “shape” of the quasar’s spectrum can indicate the amount of dust present surrounding the central region. Observing the radio emission from quasars can also tell you about the energetics of the central supermassive black hole; whether it is launching powerful “winds” or “jets” that might shape the surrounding galaxy.

Images of DESI quasars, going from blue (typical) quasars on the left to the red quasars on the right, taken from the Legacy Survey Viewer. The redder quasars are more likely to have strong radio emission compared to the bluer quasars. Credit: V. Fawcett, using images from https://www.legacysurvey.org/viewer

This new study, led by Dr Victoria Fawcett of Newcastle University, and previously Durham University, uses spectroscopic observations from DESI to measure the amount of dust (reddening) in a sample of ~35,000 quasars and link this to the observed radio emission. They find that DESI is capable of observing much more extreme red (dusty) quasars compared to similar/previous spectroscopic surveys, such as the Sloan Digital Sky Survey (SDSS). They also find that redder quasars are much more likely to have strong radio emission compared to typical blue quasars (see link to movie at the end of the article).

This reddening-radio connection is likely due to powerful outflows of gas driven away from the supermassive black hole, which slam into the surrounding dust, causing shocks and radio emission. These outflows will eventually blow away all the dust and gas in the central region of the galaxy, revealing a blue quasar and resulting in weaker radio emission. This is consistent with the emerging picture that red quasars are a younger, “blow-out” phase in the evolution of galaxies. Red quasars may therefore be extremely important for understanding how galaxies evolve over time.

Paper: https://academic.oup.com/mnras/article/525/4/5575/7273139?login=true

Paper: Testing a Novel Approach to Measuring the Intrinsic Alignment of Galaxies

Charlie MacMahon has just submitted his first paper as first author for publication, and it is already available as a pre-print on the arXiv! In it, he and his supervisor Danielle Leonard investigate a novel method for measuring intrinsic alignment.

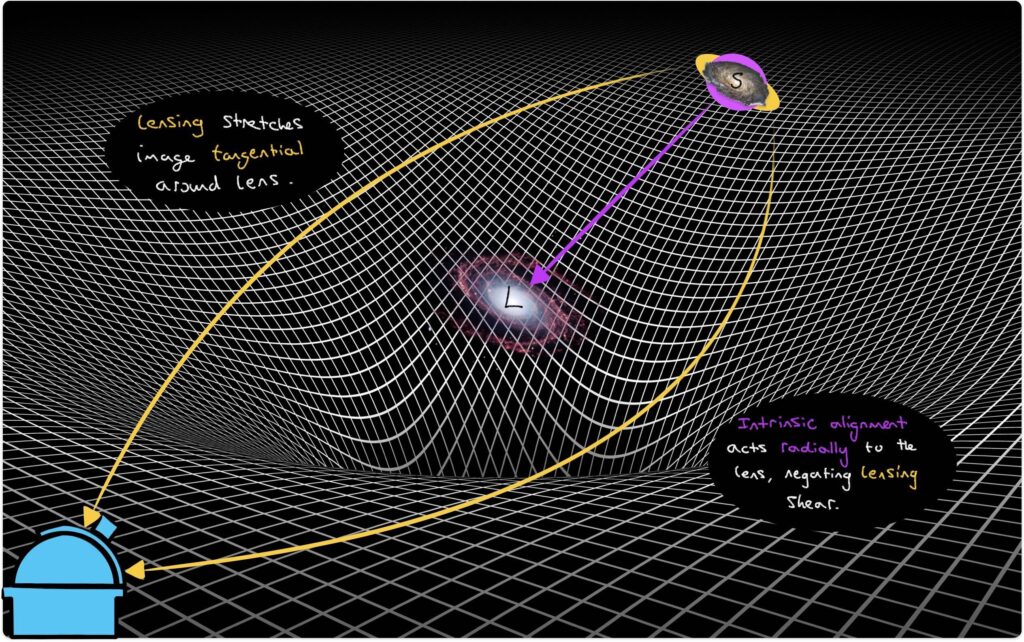
A simplistic diagram showing how intrinsic alignment influences our measurements of galaxy shape and why this affects weak lensing measurements.

Intrinsic alignment refers to a phenomenon in which galaxies near to each other will align with local, large-scale gravitational fields in a way that causes their shapes to become statistically correlated. These correlations can bias weak lensing measurements, but are themselves also interesting tracers of galaxy evolution and underlying cosmology.

Taking the difference of the shape estimates at the two different measurement scales allows us to recover the difference in the intrinsic alignment signal.

Charlie’s paper looks at measuring intrinsic alignment using two different estimators of galaxy shape, which are individually sensitive to different parts of galaxies, because it’s expected that the outer regions of a galaxy should be more aligned with local fields than the inner regions. This method allows a portion of the intrinsic alignment signal to be recovered in a way that is more robust to uncertainty in galaxy redshift than other methods.

In the paper, the method is applied for the first time to real galaxy shape data from the Dark Energy Survey Year 1, and various assumptions of the method are tested to help develop a framework of necessary considerations and steps for using this method. The paper shows the difficulty of working with observational data and the importance of rigorous testing for contamination and systematics.

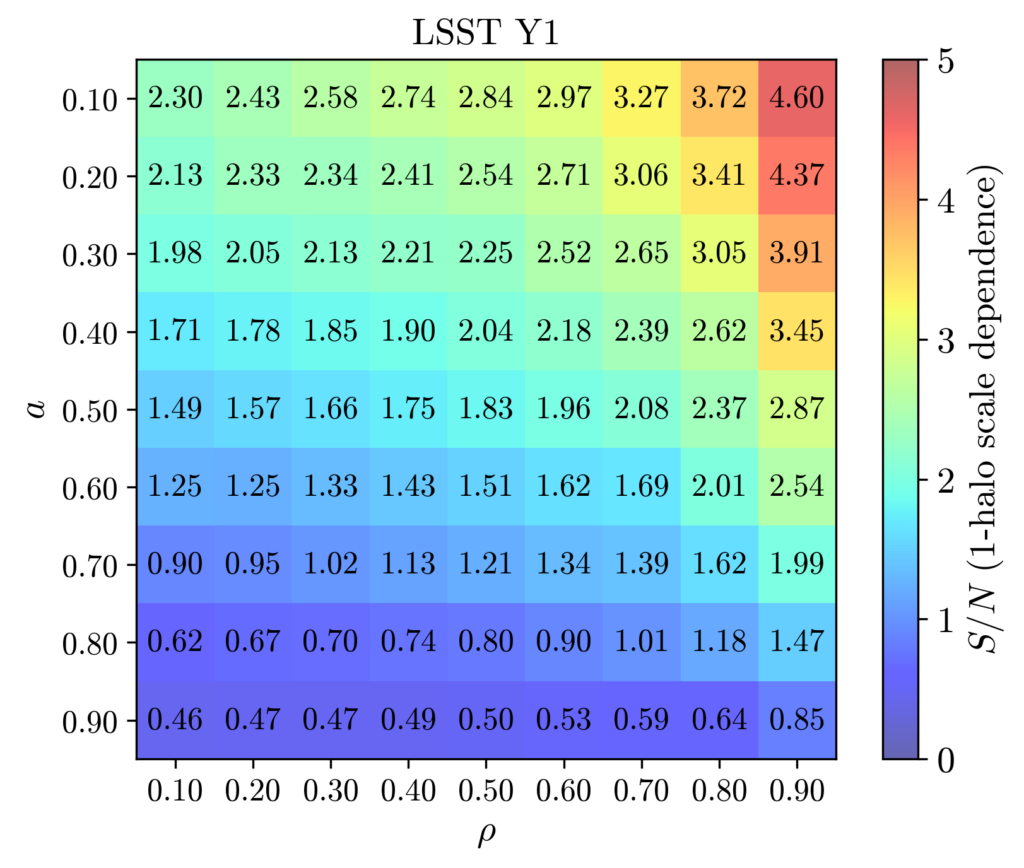
Constraining power of the method for different combinations of shape estimator parameters, when fitting a model of intrinsic alignment to mock Rubin Observatory data.

Taking what is learnt from this first application to data, forecasts are conducted using a mock catalogue of Rubin Observatory data (part of the next generation of lensing surveys) and a contemporary model for intrinsic alignment. With this data, the performance of the method is evaluated in various contexts, and requirements are then placed on the shape estimators to ensure robustness to systematics and a strong measurement are achieved. Overall, the paper proposes a clear path for the continued development of the method, and demonstrates promise for its use with future Rubin Observatory data.

Hidden supermassive black holes brought to life by galaxies on collision course

A new study, led by Sean Dougherty who carried out this work whilst an MPhil student in our group, was publicly released today. The study found that supermassive black holes obscured by dust are more likely to grow and release tremendous amounts of energy, when they are inside galaxies that are expected to collide with a neighbouring galaxy. It is published in Monthly Notices of the Royal Astronomical Society and is available on the arXiv

A press release was produced to celebrate the results, shared by both the Royal Astronomical Society and Newcastle University

This study presents a new statistical method to overcome the previous limitations of measuring accurate distances of galaxies and supermassive black holes. It applies a statistical approach to determine galaxy distances using images at different wavelengths (i.e., ‘photometric redshifts’) and removes the need for spectroscopic distance measurements for individual galaxies, which are only available for a small fraction of galaxies.

They applied this new method to hundreds of thousands of galaxies in the distant universe (looking at galaxies formed 2 to 6 billion years after the Big Bang) to better understand the so-called ‘cosmic noon’, a time when most of the Universe’s galaxy and black hole growth is expected to have taken place.

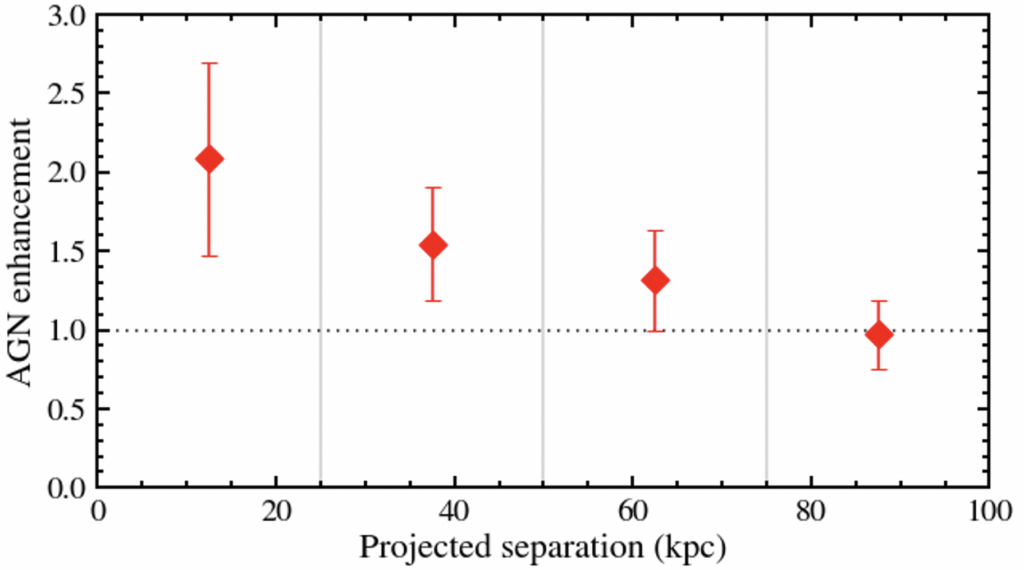
Using this new method, Sean investigated the number of growing supermassive black holes (called active galactic nuclei), in galaxies which are in close pairs with other galaxies.  This was compared to the number found in galaxies without close pairs i.e., ‘isolated’ galaxies.  In agreement with previous work, it is found that the fraction of galaxies containing active galactic nuclei identified with X-rays is the same for both galaxy pairs and isolated galaxies. However, those which are hidden in the X-rays due to obscuring dust, and are only seen in infrared light, are twice as common in the close galaxy pairs.  

The excess (or ‘enhancement’) of obscured active galactic nuclei (growing super massive black hole) found in galaxy pairs, compared to isolated galaxies, as a function of separation to another galaxy. The results show that there is a boost in the number by a factor of ~2 for the closest galaxy pairs.

The difficulty in finding these black holes and in establishing precise distance measurements explains why this result has previously been challenging to pin down for these distant `cosmic noon’ galaxies.  

The expectation is that these close galaxy pairs are on the route to colliding, and eventually merging. This process helps drive gas down onto the black holes. On its journey this gas releases a tremendous amount of energy and heats up the surrounding dust, which glows in the infrared.

Paper: Making (dark matter) waves – how wave interference can help model cold dark matter

Alex’s first first-author paper is now available on arXiv! An art piece Alex made related to this work also placed 2nd in the Art of Science competition hosted by the SAgE faculty at Newcastle. You can see more images and descriptions in Alex’s twitter thread on the paper (and the associated art piece).

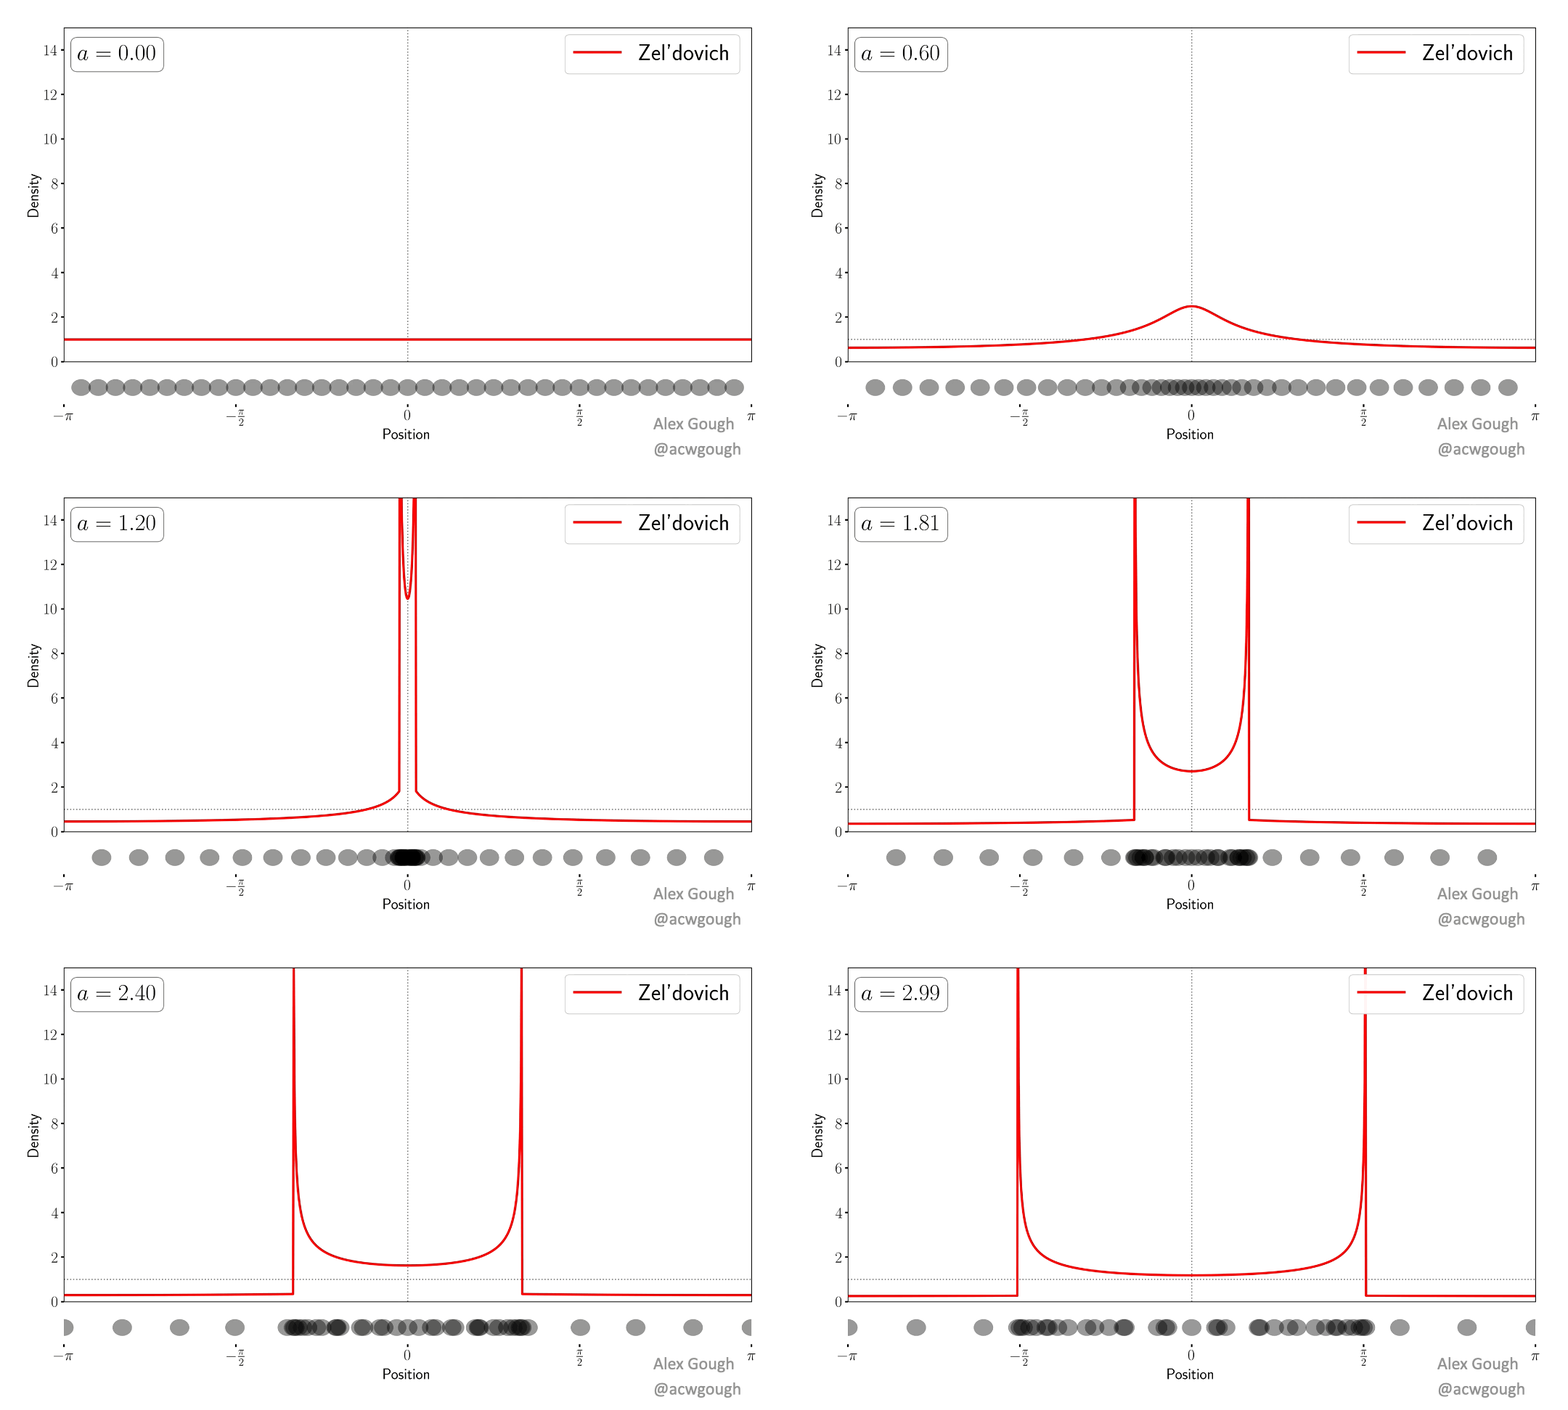
This paper models the dark matter field as a single wavefunction, rather than traditional fluid variables or collisionless particles. We show explicitly how the complex phenomenology of multi-streaming (caused by collisionless particles flowing through each other) is encoded in the interference and oscillations of the wavefunction in a simple toy model. This wave model avoids the infinite density spikes which occur when evolving classical cold dark matter collapse.

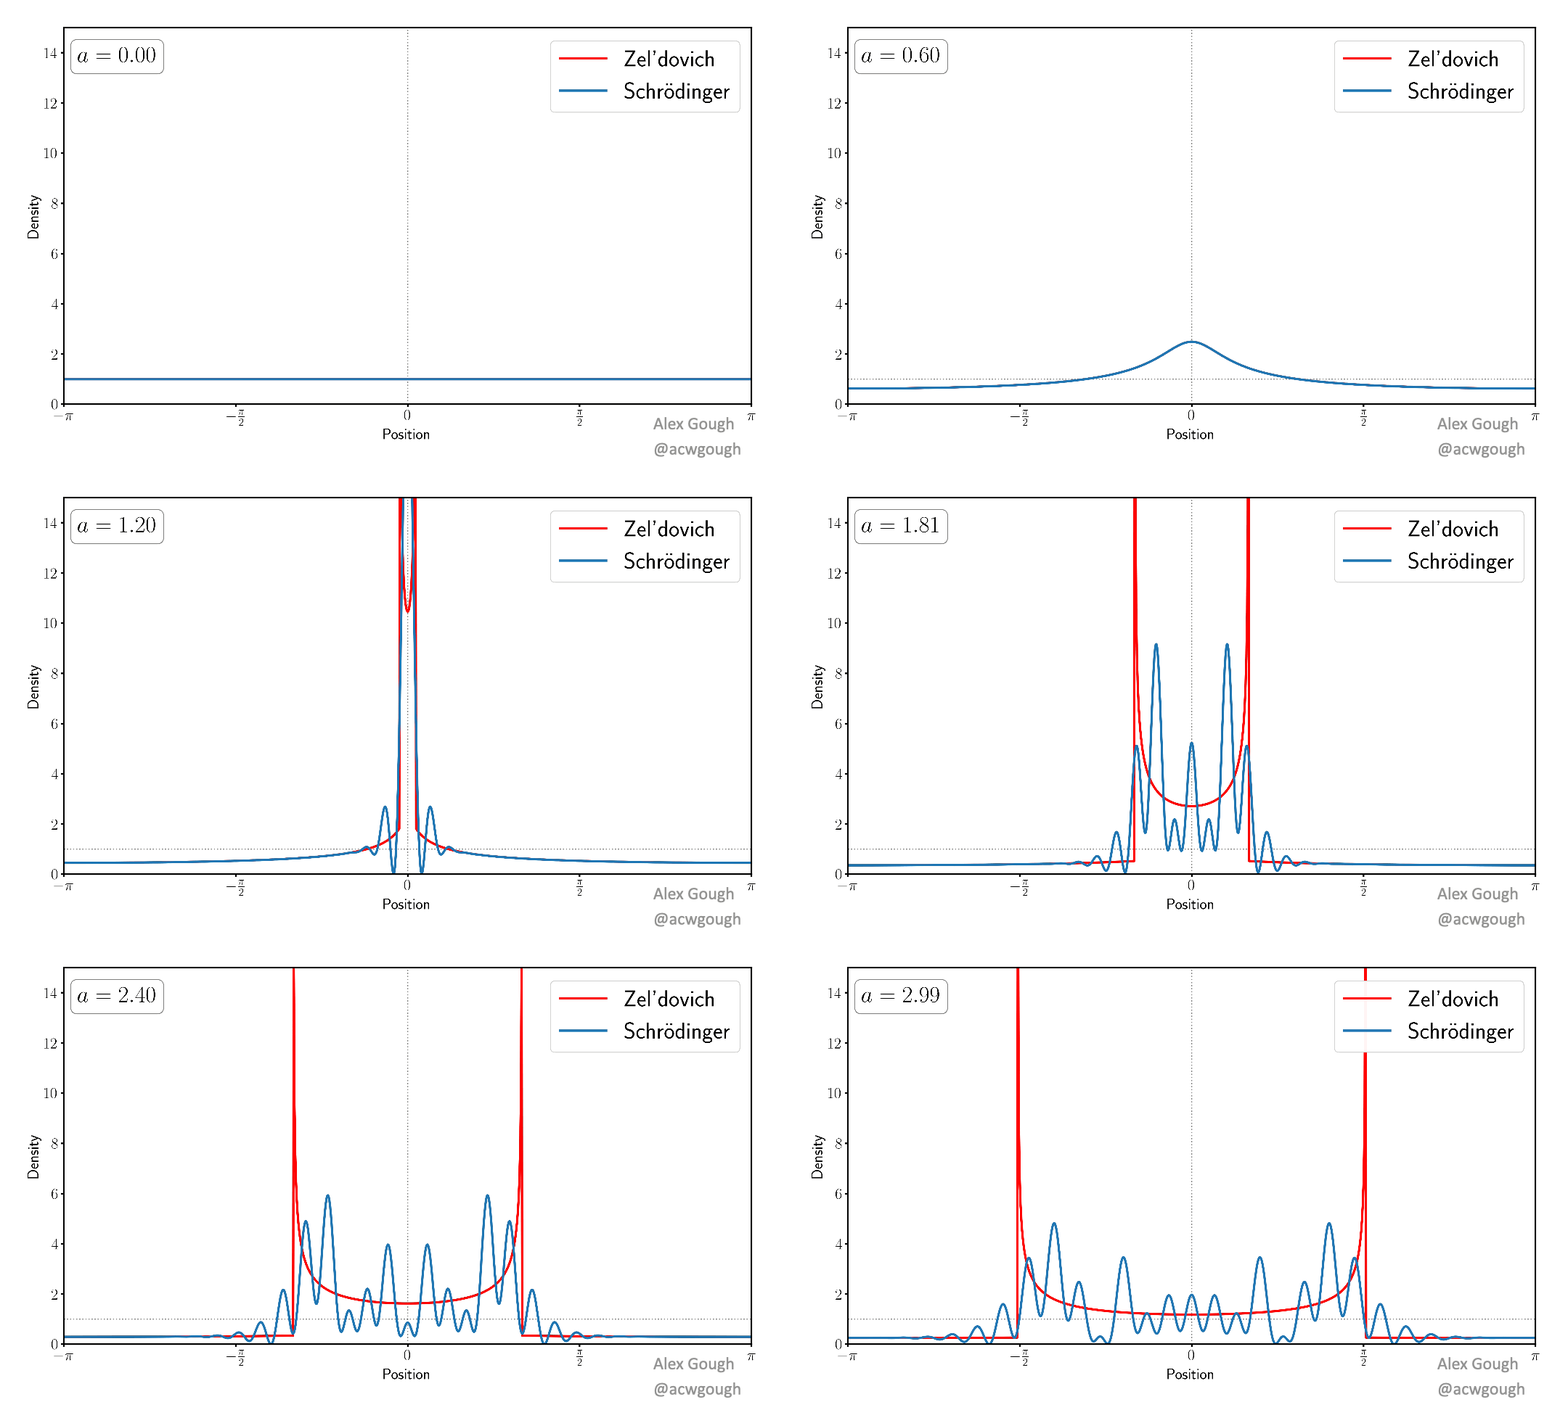
Evolution of the position and density of a set of cold dark matter particles under the Zel’dovich approximation.

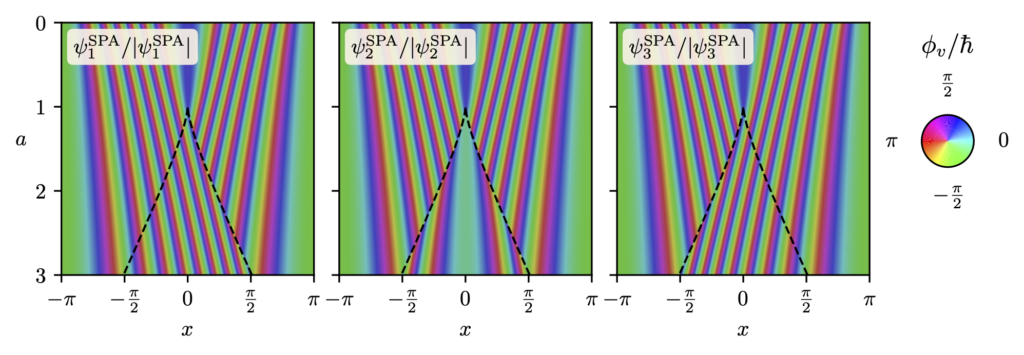
This paper demonstrates how the oscillations in the wavefunction can be “unwoven” to recover a set of wavefunctions corresponding to the set of classical streams in the Zel’dovich approximation. In the multi-stream region, where the dark matter cannot be described by a perfect fluid, we demonstrate how to separate the wavefunction into an “average part”, which describes the classical fluid behaviour, and an oscillatory “hidden part” which is responsible for producing beyond perfect fluid quantities such as velocity dispersion.

Comparison between the Zel’dovich approximation for cold dark matter and evolution of a wavefunction under the free Schrödinger equation. The wavefunction avoids the infinite density spikes (caustics) seen in classical cold dark matter, and introduces small scale interference to decorate the classical density.
Splitting of the wavefunction into three parts, each corresponding to classical dark matter trajectories.

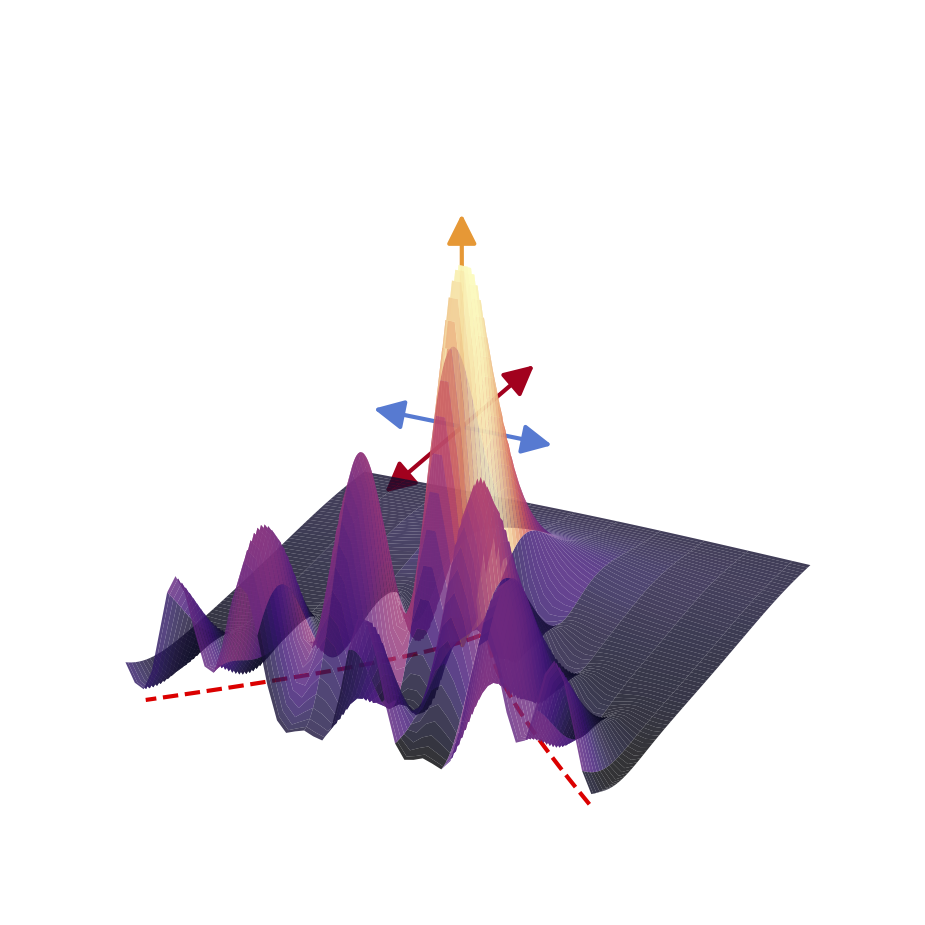
The dense caustics formed by cold dark matter are replaced with diffraction caustics in the simple wave model, which provide classification of these caustics, and certain universal features related to the wave nature of the model. Such features are akin to those found in truly wavelike models of dark matter, such as fuzzy dark matter and ultralight axions.

The wave field corresponding to a cusp caustic. The scaling of the peak height and fringe widths are universal features, classified by catastrophe theory.

Paper: New Tool for Pulsar Timing

PINT: A Modern Software Package for Pulsar Timing by Jing Luo, Scott Ransom, Paul Demorest, Paul S. Ray, Anne Archibald, Matthew Kerr, Ross J. Jennings, Matteo Bachetti, Rutger van Haasteren, Chloe A. Champagne, Jonathan Colen, Camryn Phillips, Josef Zimmerman, Kevin Stovall, Michael T. Lam, and Fredrick A. Jenet.

The defining characteristic of pulsars — that they emit regular pulses of radio waves or other radiation — also provides one of the most powerful tools for studying them and their environments: we can measure the arrival time of these pulses at our telescopes quite precisely. These arrival times carry information about the rotation of the pulsar (affected by the energy loss to a particle wind and by interaction of the crust with the internal superfluid), the orbit of the pulsar if it’s in a binary system (including tidal and relativistic effects on the orbit, and relativistic time dilation and light bending), the location of the pulsar in relation to the Earth’s orbit (including its distance), the interstellar medium (varying as our line of sight sweeps through it), and possibly even gravitational waves passing over the Earth. But to extract the interesting science from these measurements, we need a tool that models how all these physical processes affect the observed arrival times. PINT is such a tool.

Numerous data points with error bars, all lying near a horizontal line.
The difference between observed arrival times and arrival times modelled with PINT. The parameters of the model, including position on the sky, pulsar spin period, and pulsar orbital parameters, have been adjusted to match the observed data as well as possible, and the discrepancies are within about 20 microseconds, and are broadly consistent with the uncertainties on the measurements themselves.

Of the tools that exist to do this task, TEMPO has a proud history of scientific discovery but was written in FORTRAN in the 1980s and was never designed to operate with sub-microsecond accuracy. The tool TEMPO2 was meant to be its successor, written in the 2000s, but much of TEMPO2’s code is simply original TEMPO code converted to C++, and the package can be difficult to work with. PINT is intended as a largely independent development project, and indeed the process of developing PINT has revealed at least one long-standing error (now fixed) in TEMPO2’s computations. PINT is also written to be a flexible python library, well documented and well tested, so that its data structures and tools can be applied to tasks that do not fit naturally into traditional pulsar timing.

PINT is an open-source project under active development; you can find it on GitHub. It has extensive, if still in-progress, documentation as well.

Paper: When galactic foregrounds are allowed to vary

A minimal power-spectrum-based moment expansion for CMB B-mode searches by S. Azzoni, M. H. Abitbol, D. Alonso, A. Gough, N. Katayama, T. Matsumura

Primordial gravitational waves, thought to be sourced by inflation in the very early universe, should imprint themselves on the polarisation signal of the cosmic microwave background (CMB). Direct detection of the “B-mode” polarisation characteristic of these gravitational waves would provide strong evidence for an inflationary period in the early universe, as well as providing insight into the mechanisms driving it. The strength of the tensor perturbations which correspond to gravitational waves is parametrised by the “tensor to scalar ratio”, r

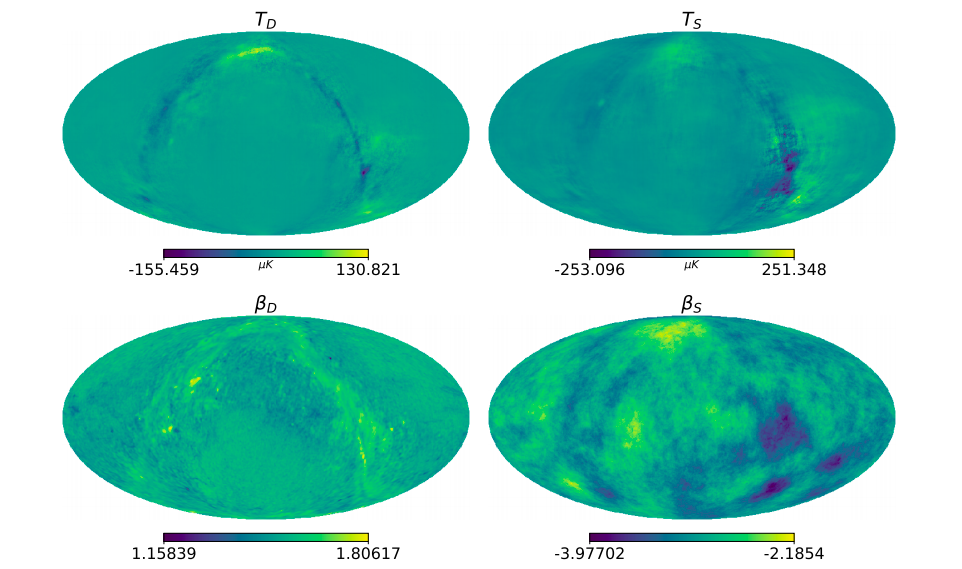
Detecting true B mode signal from the CMB is difficult, as the primordial B mode signal is dominated by foreground elements, such as thermal dust emission and synchrotron emission within our own galaxy. These galactic foregrounds can be dealt with by masking—cutting the portions of the sky where the galactic plane is out of the signal—though this has the disadvantage of throwing away true signal. The other approach is to model the foreground elements statistically, with some dependence on frequency.

The standard technique is to characterise the foreground elements’ spectral energy density (a function of frequency) by an amplitude and a spectral index. These spectral indices are usually considered to be constant across the sky, which, given that they are empirically fit parameters, rather than motivated by underlying physics, is not well justified. For small sky fraction surveys, the difference is thought to be negligible, but for future CMB experiments, this assumption should be relaxed. This paper is a proof of concept for an extension beyond assuming a constant spectral index.

Allowing the spectral indices of dust and synchrotron emission to vary across the sky, we propagate forward the effect on the total observed power spectrum in a very general way using a moment expansion. A highly simplified case of this model is then tested against simulations of varying degrees of realism, to see whether this kind of expansion tightens the constraints on r compared to not using the moment expansion. The result is not possible to significantly detect the effects of this variation on the foreground multi-frequency power spectra for Simon’s-Observatory-like sensitivities, at least using the strong simplifications we used to test against simulations. Nevertheless the methodology set up in this paper, as well as potential extensions, will be useful for analysis of ground based CMB experiments such as Simon’s Observatory and CMB-Stage 4.

Paper: Polarization details shed light on the origin of fast radio bursts

Microsecond polarimetry of the repeating FRB 20180916B by K. Nimmo, J. W. T. Hessels, A. Keimpema, A. M. Archibald, J. M. Cordes, R. Karuppusamy, F. Kirsten, D. Z. Li, B. Marcote, and Z. Paragi

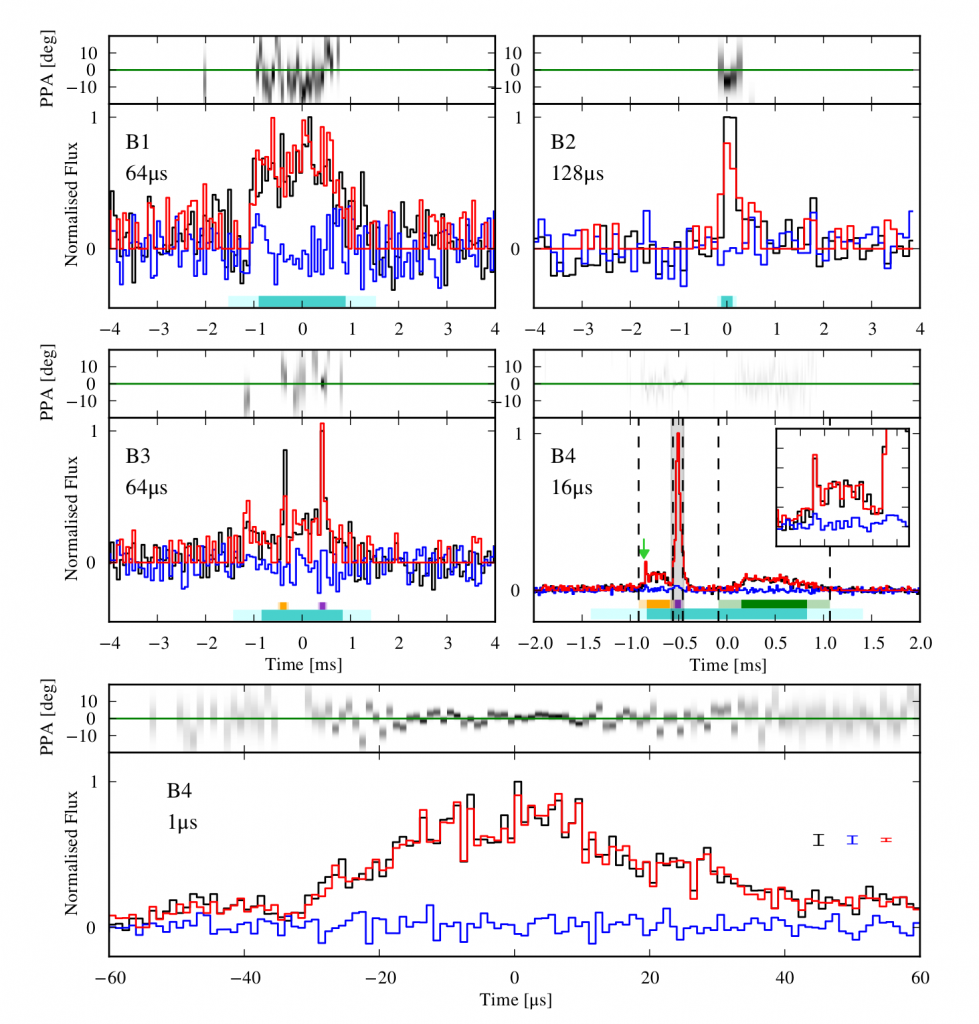
Fast Radio Bursts are millisecond-long incredibly bright radio flashes from distant galaxies. They are clearly produced by some kind of coherent emission process but the details or even basic nature of this process remain mysterious. Observational clues as to what it might be are few and far between, but polarization can provide hints about the geometry and magnetic fields in or near the emitting region. For this paper we managed to find polarization structure at very short timescales inside the burst – this is a clear sign that relatively small structures are producing elements of the radio burst. We still do not know what kind of structures these might be, but the Crab pulsar produces “giant pulses”, albeit still many orders of magnitude fainter than fast radio bursts, from coherent emission regions about 30 cm across. So this hint at detailed small-scale structure in fast radio bursts sheds a little light on their still-mysterious origin.

Plot showing bursts and their polarization.
Figure 4: detailed polarization structure of different sub-bursts. Note the microsecond time-scale on the bottom panel. Black bars indicate total intensity, red indicates linearly polarized intensity, and blue circularly polarized intensity (with sign). Note that these sub-bursts are almost completely linearly polarized. The grey bars in the top panels indicate the direction of linear polarization, with fuzziness indicating uncertainty. Note that there appears to be structured variation in the direction on microsecond timescales in the sub-burst shown in the bottom panel.