By Thomas Hopkin, Katie Markham, Rhiannon Mason and Bethany Rex
Here, we discuss the regional impact that cuts to local authority budgets are having on museums, parks and libraries across the UK.

[Image description: image shows piles of coins arranged into gradually smaller stacks]
As covered in the introduction to our conference programme, publicly funded cultural organisations in the UK have faced unprecedented cuts to their budgets over the past ten years. Stimulated in large part by the work done by the Conservative-led Coalition Government party’s decision to cut budgets for the (then) Department for Communities and Local Government (now MHCLG), local authorities as a whole in the UK have endured severe reductions to their funding, with the Local Government Association estimating that by 2020, councils across the UK will have experienced a total reduction in core government funding of £16 billion (LGA, 2018).[1] This shortfall in governmental cash is further exacerbated by rising costs of social care as well as the transfer of key responsibilities, such as the delivery of public health services from government to local councils.[2] A combination of these factors has meant that across one year alone (2016/17-2017/18), councils in the UK experienced a direct funding shortfall of £2.4 billion – something that the Local Government Association expects will rise to £7.8 billion by 2020 (LGA, 2018).
Figures covered in our conference programme give some sense of the impact that these reductions have had on publicly funded cultural institutions as a whole. However what is less well understood is the way that these reductions are impacting museums, parks and libraries on a regional level. Such information is often difficult to get hold of. Indeed, whilst data from central government sources shows a reduction in local authorities’ overall net expenditure on Cultural Services in England (down from £3.4 million in 2009/10 to £2.1 million in 2018/19), and further disaggregated statistics suggest that total local authority expenditure spending on museum/galleries, open spaces and libraries in England has declined by roughly £12 million, £227 million and £96 million respectively between 2011/12 and 2017/18, precise information about how these feed into real term spending cuts endured by museums, parks and libraries on a regional basis is hard to obtain.[3]
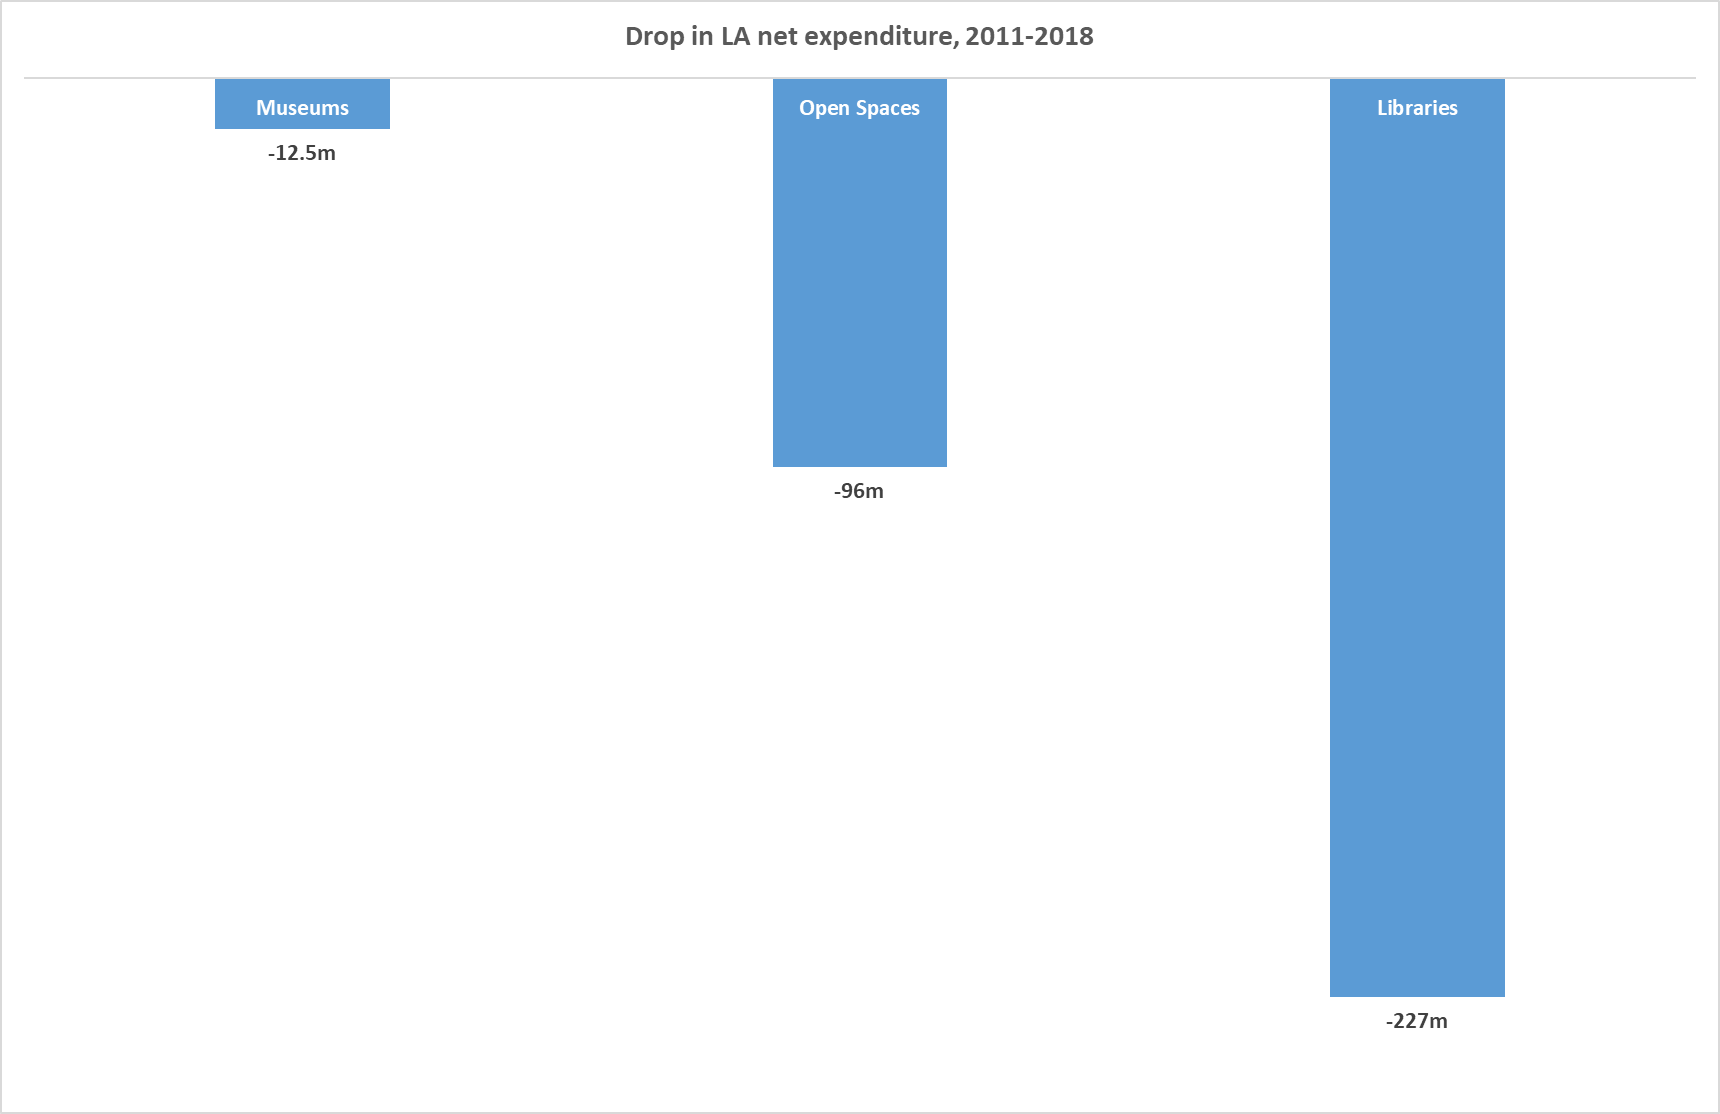
Graph showing cuts in Local Authority spending on Museums, Open Spaces and Libraries in England from 2011 to 2018.
The difficulty in acquiring these numbers can be attributed to two factors. On the one hand, there is a lack of disaggregated data provided by government on these issues. For example, parks are usually included in ‘open spaces’ funding, however this category also includes playgrounds, churchyards and allotments. Relatedly, when this data is then collected by the larger sectoral bodies, it tends to be self-reported by individual museums/parks/libraries, which makes building a complete picture of the regional differentiation impossible. For example, whilst the last Museums Association survey of the cuts in 2015 revealed that 24% of all surveyed museums in the UK had experienced a decrease in the number of full time equivalent staff they employed, there were no disaggregate figures for local authority, independent, or national museums. Nor does this figure account for the disproportion with which staff reductions impacts museum services in regions where cultures of volunteerism are reduced, or the demand on museums’ outreach and community services is greater. Even a basic regional comparison of DCLG figures on library budgets fails to give us any sense of the real spectrum of choice made available to local authorities in terms of possible co-location or asset transfer, when faced with library closure.
Understanding the regional dynamics of the cuts to museums, parks and libraries is important, not least because the ability of these cultural organisations to respond to a shortfall in local authority funding (whether by attracting private/Arts Council funding, or by levying on entrance fees) is often determined by a range of factors (levels of deprivation, the popularity of the authority as a tourist ‘hot spot’, the attractiveness of local authorities to business investors) which are themselves drastically uneven. Certainly, this is a pattern that Anna Barford and Mia Gray (2018) have observed in relation to cuts to local government spending overall where, they argue, the extent to which a local authority has depended on central government grants in the past is a strong determinant of the way this impacts service spend on the ground. This is further exemplified by research from the Centre for Cities (2019) which has shown a huge variation in the cuts to overall service spending by local authorities in cities with some such as Oxford reporting an increase in overall spend, whilst others, such as Barnsley, have had to reduce day to day spending by 40%. Somewhat unsurprisingly, the geographical displacement of these spends and cuts tend to reinforce the North-South divide (Gray and Barford, 2018; Centre for Cities, 2019) and is one that we anticipate is also being replicated in the amount of local authority money being made available to museums, parks and libraries across these geographies.
Anecdotally, we know this to be true. Indeed talking to those working in the parks, museums and libraries sector, both during the conference and in preparation for our forthcoming article on this topic, revealed that whilst some cultural organisations have been able to weather the financial storm with a reasonable degree of success, others have had a much harder time of it. Newcastle upon Tyne, for example, (a city with a comparatively high level of need and spending cuts of 26.6%) cut its parks budget by 97% in the three years prior to 2016, before finally transferring parks over in their entirety to a new parks trust model in 2019. Meanwhile, although Newcastle has, on the whole, avoided library closures, other local authorities have had to transfer the majority of their library services over to community control, resulting in a 5000% increase in volunteer run libraries across the UK since 2010 (Cain, 2018). The ability of local communities to then take on the work of running these library services is something that is again, quite often dependent on a range of different factors, including levels of demand within the community, and the number of available volunteers who have the skills sets and time required to establish and run such complex, public facing organisations. Such factors are, too often, correlated with the socio-economic status of these places.

[Image description: Image shows someone in a hi-vis jacket digging in a park]
Some of these patterns have been addressed in the Government’s Fair Funding Review, which looked at the role that factors such as deprivation levels and authorities’ attractiveness to business has played in local government’s ability to respond to budgetary cuts (MHCLG, 2018). However, although the government has talked of using this review to create a more equitable funding model from 2020 onwards for local authorities, there is as of yet no indication as to what that model might look like. Tellingly, whilst respondents to this consultation were asked to discuss the impact that cost drivers such as deprivation, might have on core services such as Adult Social Care and Waste Collection, the review failed entirely to include cultural services in its list of services impacted by budgetary cuts. To a certain extent this mirrors the academic research in these areas, where considerations of the impact that austerity is having tends not to focus on the cultural sectors as a whole (the tendency instead to focus on museums, parks or libraries individually), nor is there much consideration given to the sectors’ responses to the cuts (for an exception see: Rex, 2018; Rex, 2019).
This is where our current project intervenes. By interviewing those working in museums, parks and libraries in Newcastle, as well as national leaders from these sectors, we hope to build a cross-sectoral picture of the constraints that have been imposed on museums, parks and libraries by austerity, and their responses to this. A core part of the project is thinking through the impact that the cuts are having on the civic mission of these organisations – something that the quantitative data gathered on this topic cannot reflect. By investigating how austerity has been configured and experienced within a single city we hope to build a more nuanced understanding of what is at stake as people working in different parts of the cultural sector attempt to keep the doors open.
References
Gray, M. and Barford, A. 2018. ‘The depth of the cuts: the uneven geography of local government austerity’. Cambridge Journal of Regions, Economy and Society. 11(1): 541-563
Cain, S. 2018. ‘Nearly 130 public libraries closed across Britain in the last year’. Guardian.[Online]. December 7th 2018. Available from: https://www.theguardian.com/books/2018/dec/07/nearly-130-public-libraries-closed-across-britain-in-the-last-year
Centre for Cities. 2019. Cities Outlook Report 2019. London: Centre for Cities. https://www.centreforcities.org/publication/cities-outlook-2019/
DCLG (Department for Communities and Local Government). 2013. Stastical Release Local Authority Revenue Expenditure and Financing England 2010-2011. London: DCLG
MHCLG. 2019. Local Authority Revenue Expenditure and Financing: 2019-2020 Budget, England. London: MHCLG.
MHCLG. 2018. Revenue Outturn (RO5 – cultural, environmental, regulatory and planning services) 2017 to 2018 (revised). https://www.gov.uk/government/statistics/local-authority-revenue-expenditure-and-financing-england-2017-to-2018-individual-local-authority-data-outturn
LGA (Local Government Association). 2018. Local Government Funding: Moving the Conversation On. London: Local Government Association. https://www.local.gov.uk/sites/default/files/documents/5.40_01_Finance%20publication_WEB_0.pdf
Local authority revenue expenditure and financing England: 2019 to 2020 budget individual local authority data. https://www.gov.uk/government/collections/local-authority-revenue-expenditure-and-financing#2019-to-2020
MCHLG. 2012.Revenue Outturn (RO5 – cultural, environmental, regulatory and planning services) 2011 to 2012 (revised). https://www.gov.uk/government/statistics/local-authority-revenue-expenditure-and-financing-england-2011-to-2012-individual-local-authority-data–2
MHCLG (Ministry of Housing, Communities and Local Government). 2018. Fair Funding Review: a review of relative needs and resources – Technical consultation on relative need – December 2017. London: MHCLG
MHCLG (Ministry of Housing, Communities and Local Government). 2019. Local Authority Revenue Expenditure and Financing: 2019-2020 Budget, England. London: MHCLG.
Museums Association. 2015. Cuts Survey 2015. London: Museums Association.
Rex, B. 2018. Local authority museums after the cuts: a study of other-than-public forms of management. PhD Thesis. Newcastle University
Rex, B. 2019. ‘Which museums to fund? Examining local government decision-making in austerity’. Local Government Studies. [Online]. DOI: 10.1080/03003930.2019.161955
[1] the Department for Local Government experienced the single largest budgetary cuts of any governmental department between 2010 and 2016, second only to the CLG for Local Government (Centre for Cities, 2019)
[2] The Local Government Association estimates that compared to a decade ago, there are 300 more child protection investigations raised each day, a growth in the number of homeless households that outsrips the total population growth by 11:1.
[3] DCLG. 2013. Statistical Release Local Authority Revenue Expenditure and Financing England 2010-2011. London: DCLG: https://assets.publishing.service.gov.uk/government/uploads/system/uploads/attachment_data/file/254642/Revised_01-November-2013_-_Revenue_Outturn__RO__2010-11_Final_Statistical_Release_-_Final__2_.pdf
MHCLG. 2019. Local Authority Revenue Expenditure and Financing: 2019-2020 Budget, England. London: MHCLG. https://assets.publishing.service.gov.uk/government/uploads/system/uploads/attachment_data/file/812505/Local_Authority_Revenue_Expenditure_and_Financing_2019-20_Budget__England.pdf
MHCLG. 2018. Revenue Outturn (RO5 – cultural, environmental, regulatory and planning services) 2017 to 2018 (revised). https://www.gov.uk/government/statistics/local-authority-revenue-expenditure-and-financing-england-2017-to-2018-individual-local-authority-data-outturn
Local authority revenue expenditure and financing England: 2019 to 2020 budget individual local authority data. https://www.gov.uk/government/collections/local-authority-revenue-expenditure-and-financing#2019-to-2020
MCHLG. 2012.Revenue Outturn (RO5 – cultural, environmental, regulatory and planning services) 2011 to 2012 (revised). https://www.gov.uk/government/statistics/local-authority-revenue-expenditure-and-financing-england-2011-to-2012-individual-local-authority-data–2
[4]Earlier statistical models provided by the Ministry of Housing, Communities and Local Government, for example, included only total expenditure on these services, whereas the most recent data (2017/18) compares this expenditure with the amount of funding actually received by the services, which gives a much better picture of the financial constraints that museums, parks and libraries are operating under.
See, for example, the Museums’ Association Cuts Surveys, annual data released by CILIP and the Heritage Lottery Fund’s two reports on The State of Public Parks in the UK.