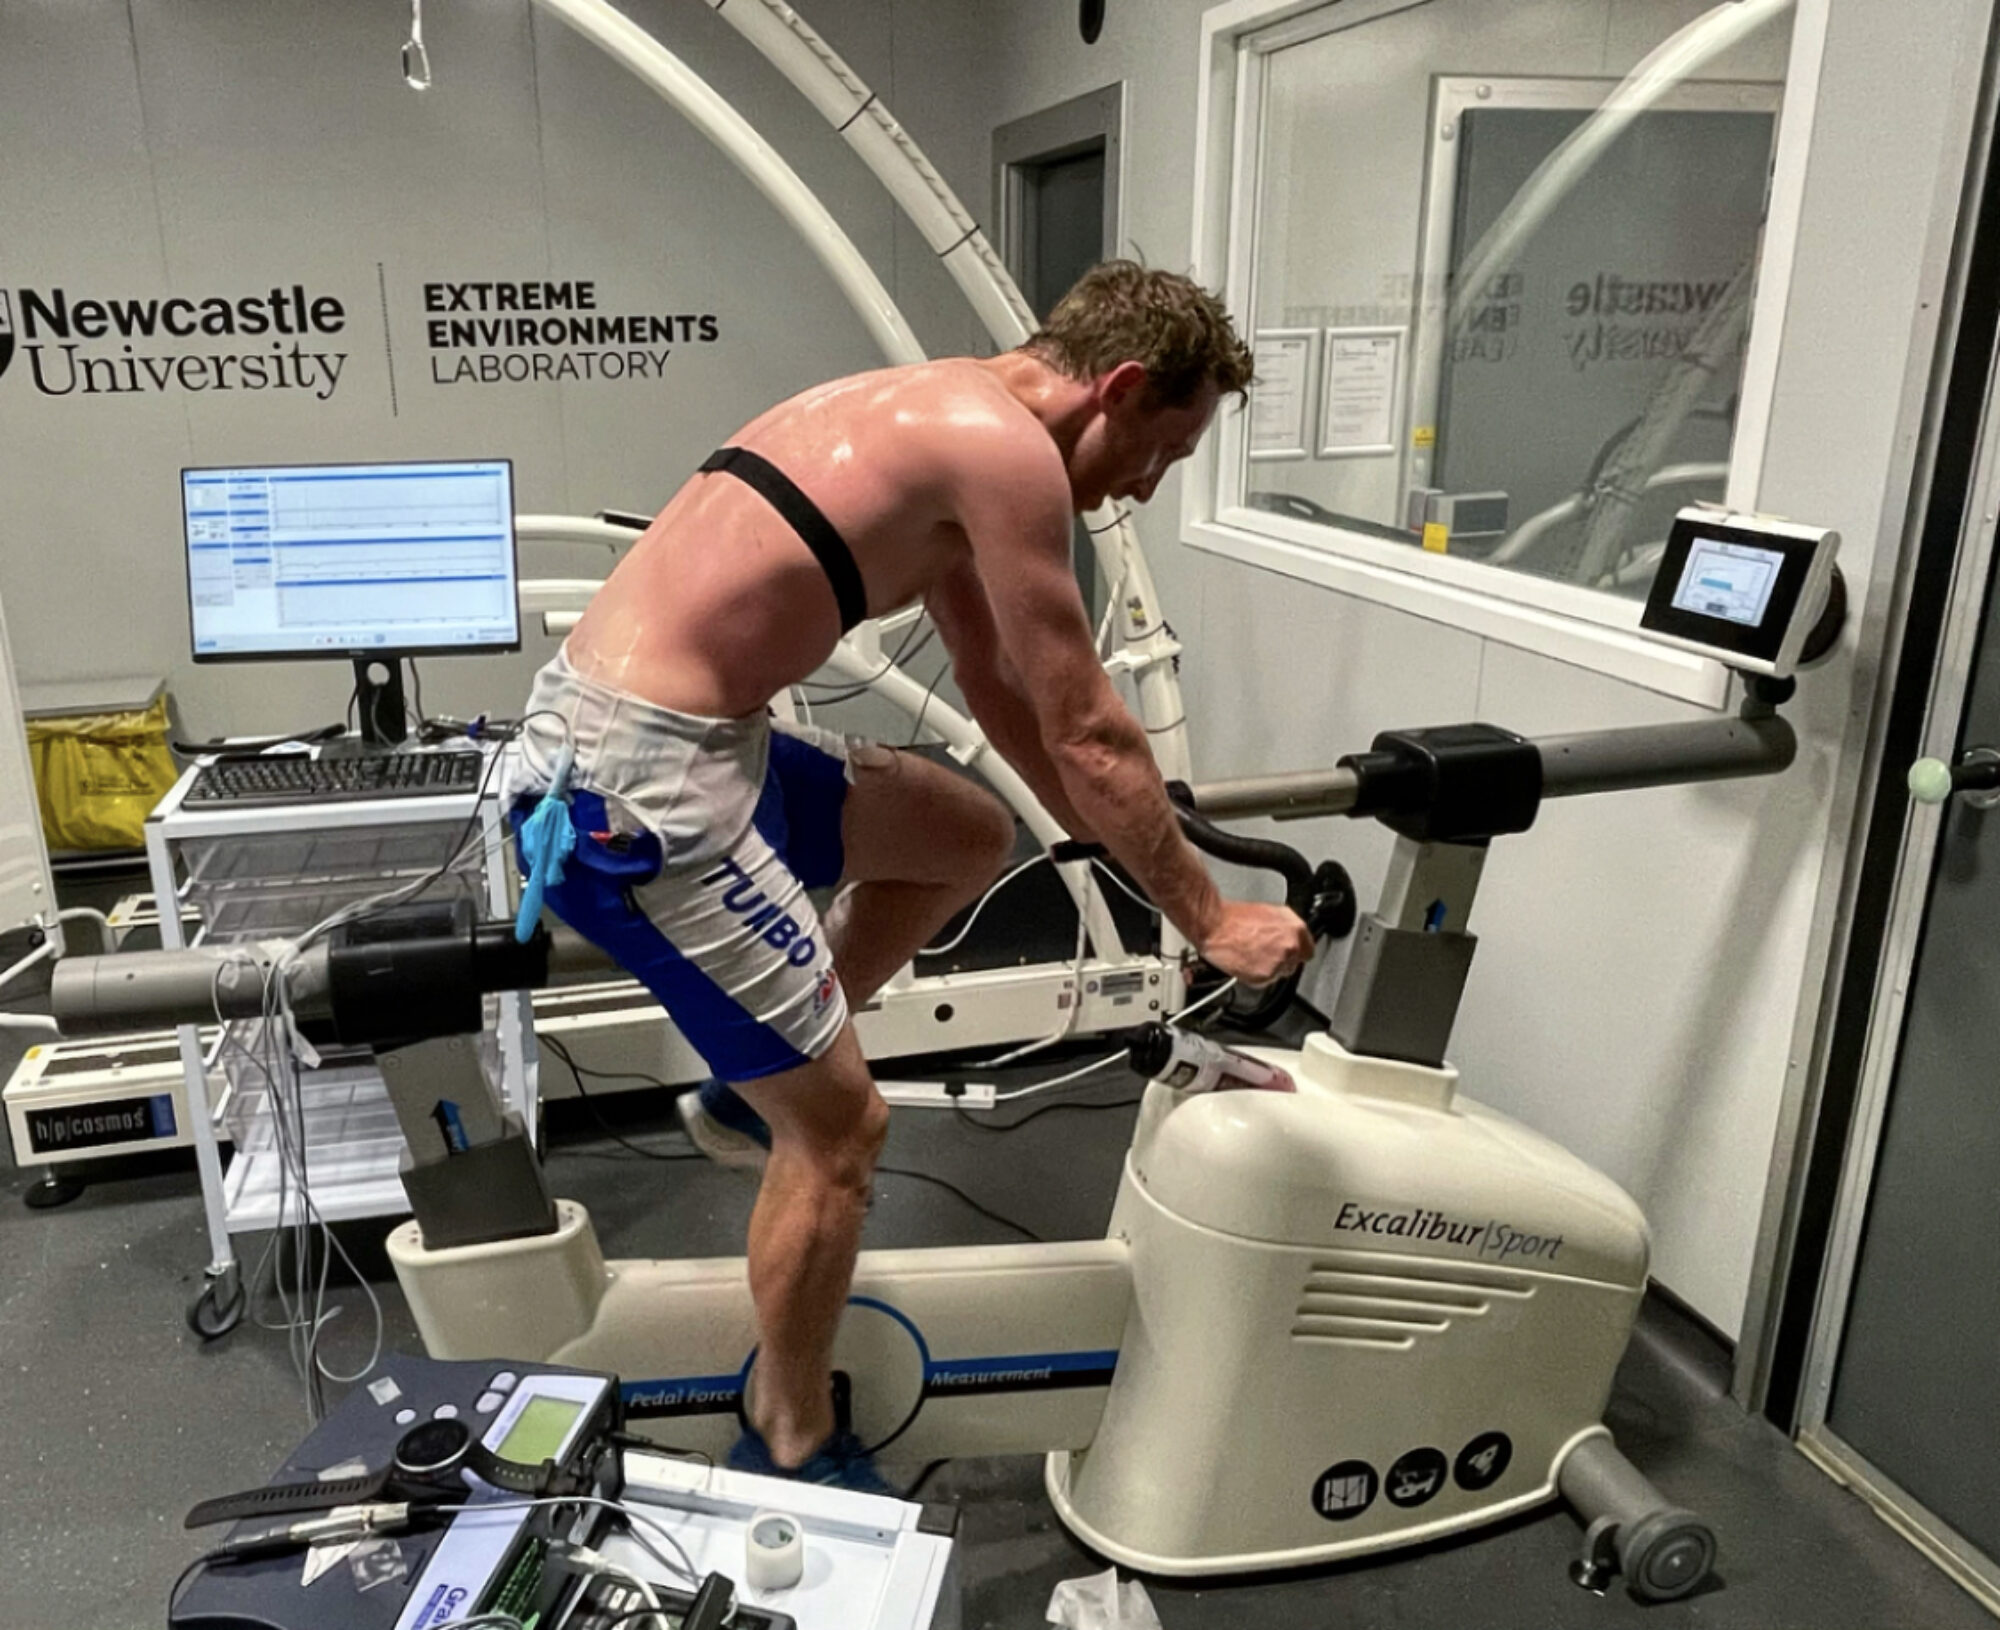
Michael attended our Laboratory at Newcastle University over a 4 week period scheduling in 7 heat sessions. The block was in preparation for refereeing games at the forthcoming FIFA Club World Cup football tournament in USA.
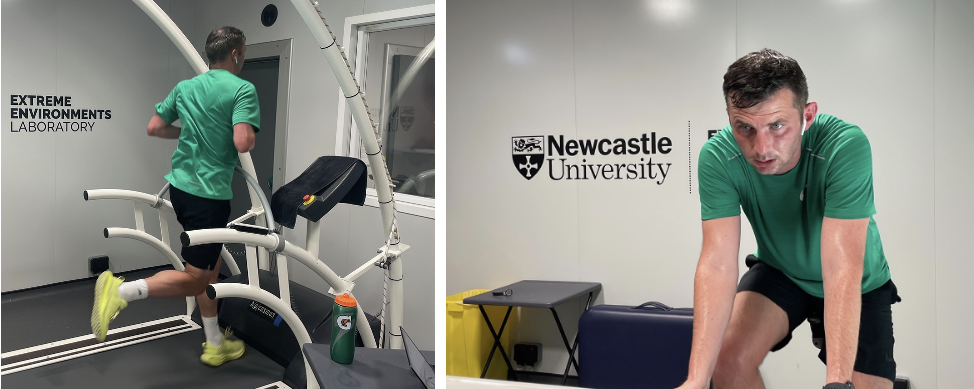
Figure 1. Michael pictured training in the Environmental Chamber during a series of heat acclimation sessions for the upcoming Club World Cup.
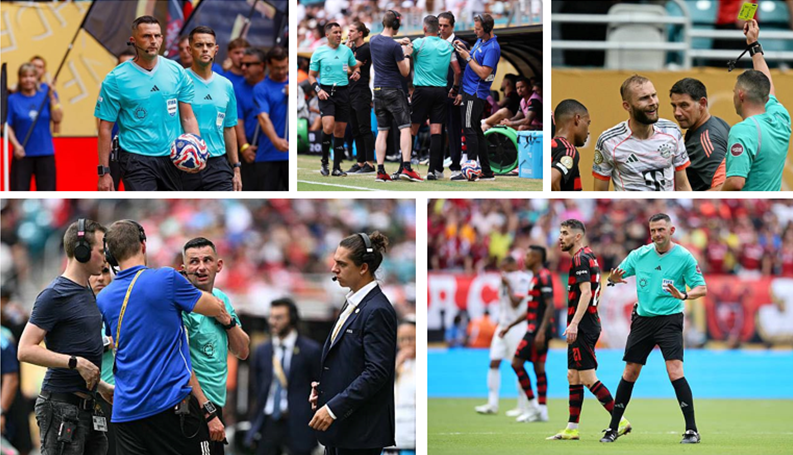
Figure 2. English referee Michael Oliver in action during the FIFA Club World Cup 2025, round of 16 match between Flamengo and Bayer Munich, at the Hard Rock Stadium in Miami where temperatures were reported as highs of 33oC and humidity was 60%RH (Heat stress index = 40oC).
Heat acclimation training
Michael had no prior experience of heat acclimation protocols and did not report any prior heat illness events. Sessions ranged in environmental conditions: set at 40 oC but with low humidity (30 %RH) and progressing to moderate humidity (50 %RH), the latter increasing the heat stress index (HSI) (strain on the body) from 45 to 57 oC.
We conducted a pre and post test to identify the adaptations Michael made during the heat acclimation protocol (data presented in figure 3). The protocols used during sessions were designed in collaboration with Dr Steven McNally Performance Support Director at Professional Game Match Officials Limited (the body responsible for refereeing games in English professional association football) to meet the athletic needs of Michael and enable robust data capture. In the pre/post test the protocol involved a 30 min intermittent running protocol, followed by 5 min rest and then a 25 min steady state cycling protocol.
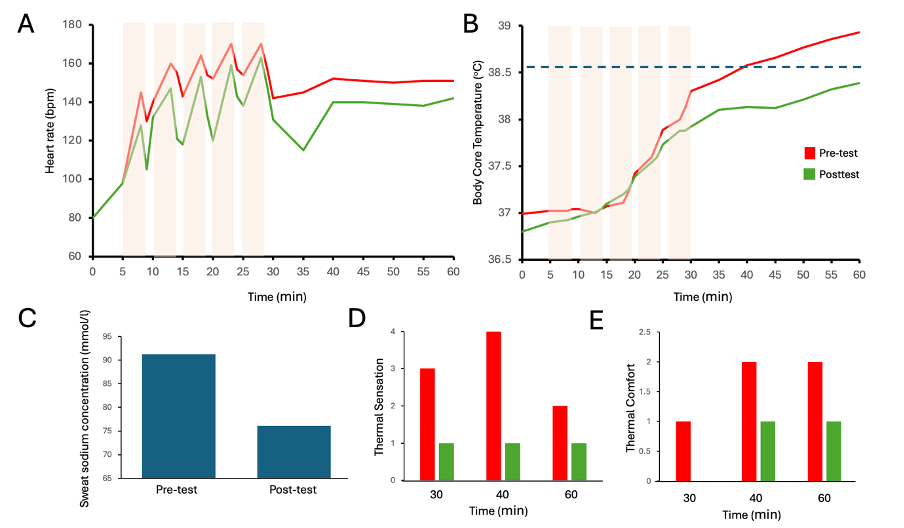
Figure 3. Pre-test (red) Post-test (green) for (A) Cardiovascular strain – heart rate (bpm). (B) Body core temperature (oC). (C) Sweat sodium concentration (mmol/l). (D) Thermal sensation. (E) Thermal comfort. Red vertical boxes in A&B represent high intensity running intervals with low intensity between bouts. Dashed line in B represents the internal body core temperature target.
The data illustrates very clear physiological and perceptual adaptations to the same heat strain protocol conducted in 40 oC and 30 %RH. The reduction in heart rate (A) demonstrates reduced cardiovascular strain. Resting body core temperature is reduced at the start of the test in (B) and after an initial induction phase demonstrates clear separation with a lower body core temperature throughout – a reduced body core temperature is the classical hallmark of heat acclimation. Sweat sodium concentration shows a moderate reduction (C) which again is typical of heat acclimation, as the body learns to retain more sodium typically lost in sweat. Perceptual measures of thermal strain were both reduced, and probably the most noticeable to Michael when he compared his first and last session. Reductions in thermal sensation (how you feel in yourself) (D) and thermal comfort (how you feel in your environment) (E) can be observed. Note that changes in body mass were also recorded, which indicate sweat loss, which changed from 1.1 L to 0.5 L meaning that less sweat was produced due to the reduced thermal strain.
In the tournament
Match 1: Fluminense RJ vs. Ulsan HD FC, at the MetLife Stadium in New York temperature was 31oC and humidity was 38%RH (Heat strain index = 31oC)
Match 2: Flamengo vs. Bayer Munich, at the Hard Rock Stadium in Miami temperature was 33oC and humidity was 60%RH (Heat strain index = 40oC – extreme caution).
*Heat and humidity data has been extracted from historical data in the region on the day of the game, so may not be entirely accurate on weatherspark.com
Heart rate data provided below is from the two games Michael refereed – captured on a Polar watch. Here, heart rate is elevated in the two halves of the game, represented by the sustained peaks in the red lines interspersed by half time were heart rate drops and preceded by the 30min before kick off. In the second graph (right) which is taken from the game played in Miami, heat strain index was much higher (HSI = 40 oC). Further the time spent in the yellow band 4 heart rate zone is substantially higher (~30 min longer). Energy consumed (which is calculated based on heart rate and just an estimate) is higher reflecting the greater metabolic demand. Therefore the higher heat strain may have increased the physiological demands on Michael. Interestingly, Michael reported no issues in the first game where heat strain was still relatively high (HSI = 31oC).
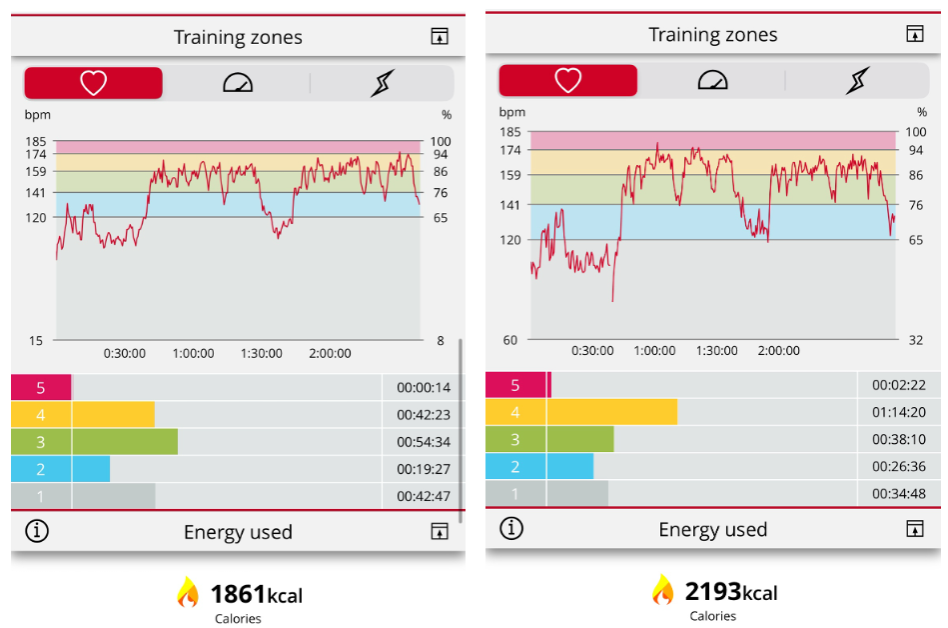
Figure 4. Heart rate data during match 1 [Left] at the MetLife Stadium in New York (HSI 31oC) and match 2 [Right] at the Hard Rock Stadium in Miami (HSI 40oC). You can clearly see the increased cardiovascular strain (higher heart rate & longer time spent in zone 4) in the graph right were the game was played in much higher heat & humidity.
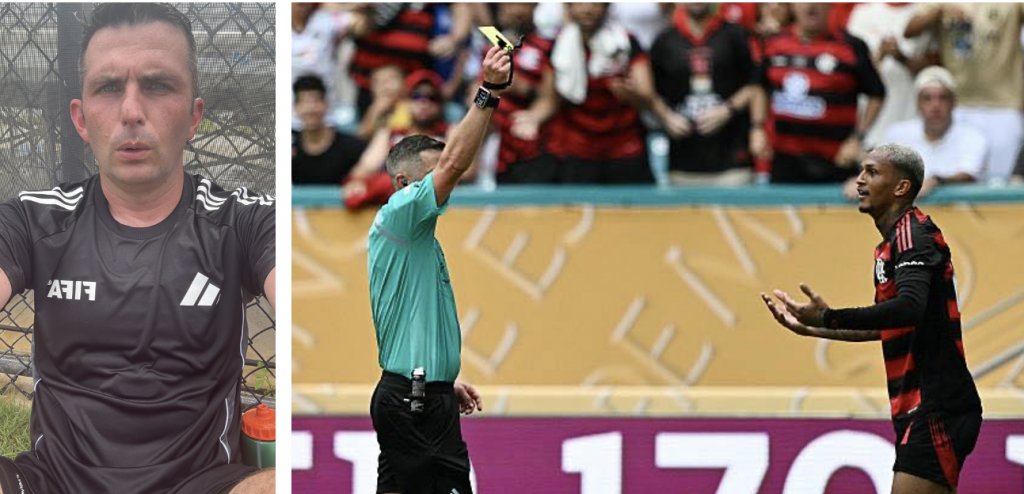
Figure 5. [Left] Daily training sessions were tough in the high humidity of Miami (where he was based for the tournament) pictured here soaked through with sweat! [Right] Awarding a yellow card in Miami match.
Question & Answer post tournament
1. You refereed two games at the recent Club World Cup, one in New York and the other in Miami, how did you get on?
The heat wasn’t so much of an issue to be honest, but the humidity was a killer. We were based in Miami so had to deal with this on a regular basis during the morning training sessions. Games wise were as you would expect based on the temperatures / location. The first in New York wasn’t an issue at all, however the second in Miami was particularly challenging with the humidity. Having watched the game back, it doesn’t come across too much in the pictures but from memory I certainly felt like I struggled in that one (particularly the first half).
2. Did you use any cooling strategies?
During the games there were pre-organised cooling breaks at around 25 & 70 minutes. Drinks and towels wrapped with ice were ready for all participants and it was a 3 minute break. At training in the morning, the only real cooling strategy was having our drinks stored in ice and a lot (!) of ice available to hold in your hands.
3. Did you consider hydration – was this planned at all on game day?
We were provided each morning with hydration sachets to have at breakfast and then arriving at training there were various drinks already made up (pre-workout, hydration, recovery etc). We were given a detailed timetable of what to eat and drink throughout the day (on the day of a match), broken down into what time to have it and what to take.
I would like to thank Michael for his time and for sharing insight and data from the recent tournament. He hopes to get back in the heat chamber ahead of the World Cup next year!
References: