A while ago here at Newcastle we set up a system to record the locations of football fans on twitter. Whilst this system was mainly a bit of fun and also a great means of testing our infrastructure it also very rapidly provided us with a considerable amount of data. And with an upcoming talk about our football tweet work I was given the opportunity to again carry out some analysis on this data.
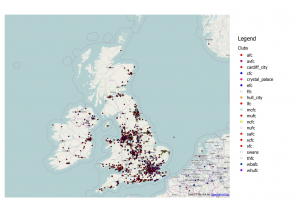
Last time round when I analysed the football data I used about a month’s worth of data to look at football team fan locality. However this selection of data wasn’t particularly fair as it contained a number of different fixtures with teams playing both home and away which would have heavily affected the distance from tweet to club. For instance if Newcastle were playing away at Fulham it’s not fair to measure the distance from “#NUFC” tweets to St James Park “ooh look Newcastle have loads of fans in London, they’re not local supporter are they”. So this time round I looked at just tweets taking place in the UK during the recent international break during which there were no Premier league games. The map below shows this data subset.
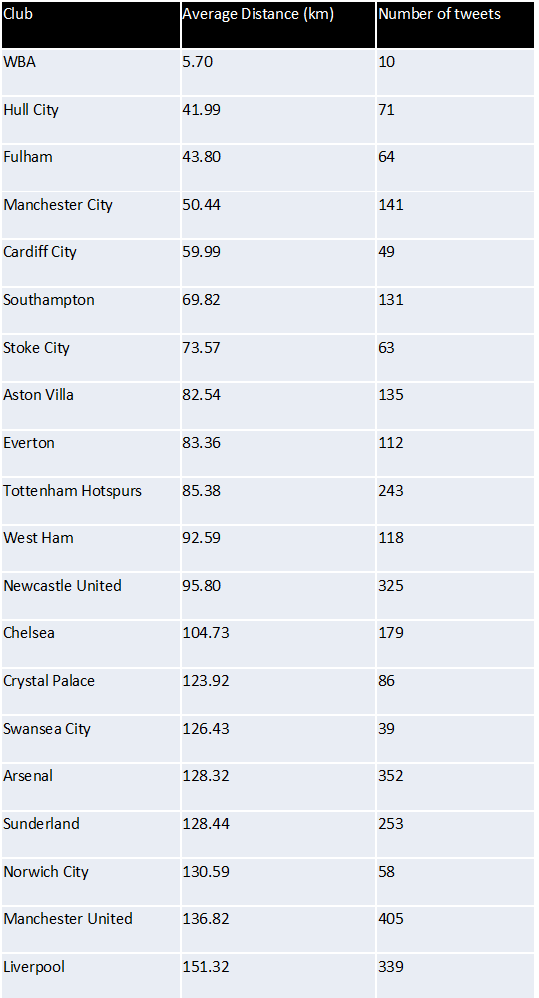
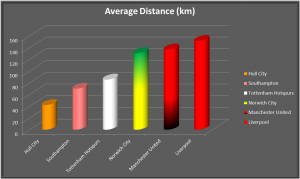
Firstly I carried out the same analysis as last time whereby I measured the distance from tweet to the ground of the club it was about. These distances were then averaged per club to give an average tweet distance for each club. The result are below (click to enlarge). The club with the shortest distance was West Brom with a very impressive average distance of 5.7km. However we only actually recorded 10 tweets during this period, so in short not many people tweet about West Brom but the ones that do are very close to The Hawthorns. At the other end of the spectrum you have your expected “glory” clubs. Your Liverpools, your Man Us and your Norwich Citys…
…hang on Norwich City?? I myself am a Norwich City fan so found this stat at little hard to believe, you’d be hard pressed to call me a glory supporter. I tried to think about why Norwich may have scored so highly here. My conclusion was that as Norwich is the only football league team in Norfolk it represents a larger area than most clubs. Therefore this large distance could maybe be justified.
 |
 |
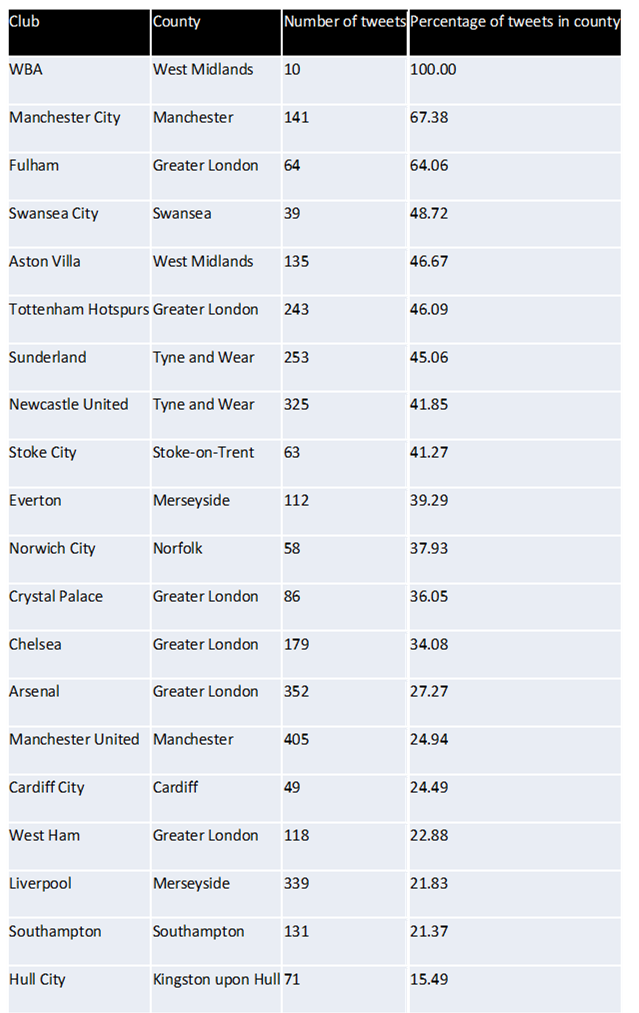
So my next piece of analysis was to look at whether the tweet about a club fell in the same county as that club. Again my results are shown below. Yet again West Brom performed the best with 100% of its tweets falling in the west midlands. And Norwich city had disappeared from the bottom 3 into mid table (something I wish we’d do in the premiership). But now the worst performer was Hull City. Had their rebrand to Hull City Tigers really caused them to have a wider fan base? Probably not, this is probably caused by Kingston upon Hull being considerably smaller in comparison to a lot of other football team counties. And you could very easily be from outside Kingston upon Hull with Hull city still being your nearest (premier league) club.
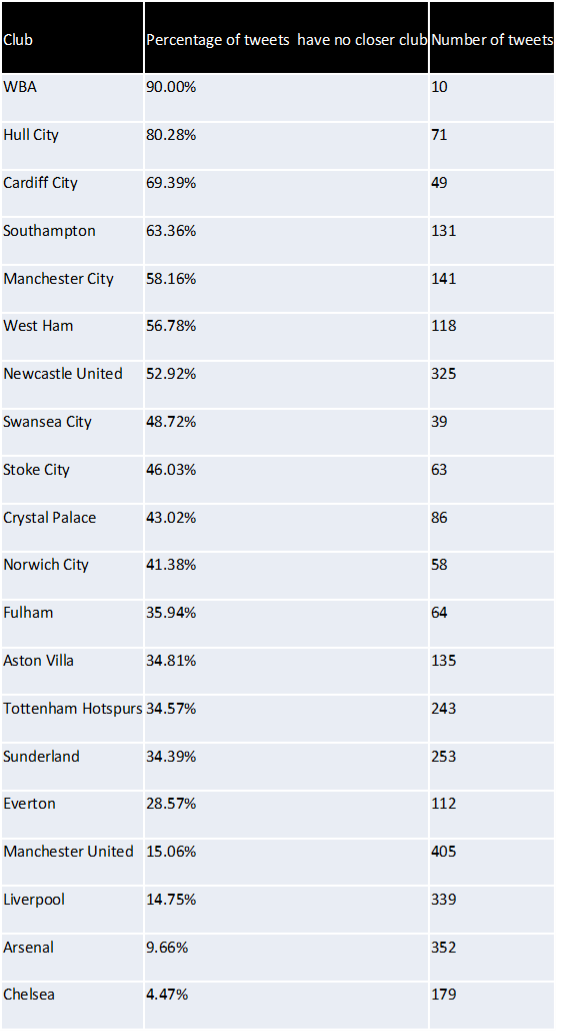
Therefore I thought I’d carry out another piece of analysis this time looking at whether or not the tweet was about their nearest club. Once again my results are displayed below. Here Hull have leapt from bottom to 2nd and Southampton have also made a considerable leap up the table. However again I noted something from the results which was that this time the bottom 5 is made up of clubs with another in very close proximity so the tweet may still be about a “nearby” club but not be counted as there is a club closer.
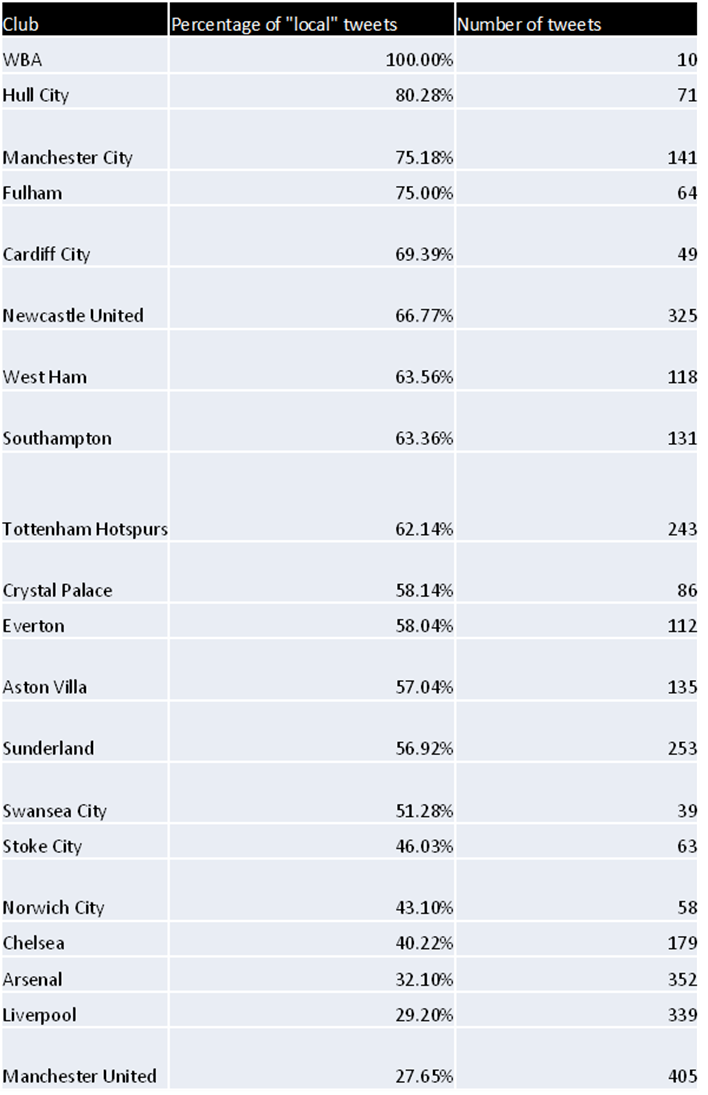
To account for this I needed some meaningful distance which would be considered as local. After a quick search I found that CAMRA consider any ale produced in a 20 mile radius of the pub to be local, could this be applied to football fan? Therefore I conducted one last test using this CAMRA metric of “localness” which counted the number of tweets which had no closer club OR were with 20 miles of the club. And for a final time my results are shown below.
Hopefully this shows some interesting results produced by just a few simple POSTGIS queries.
Neil – @neil_py_harris

