International Map Year

Did you know that 2015-16 is International Map Year?  Newcastle University has representation on the working group promoting this UN-endorsed project. See http://mapyear.org/about-international-map-year/ for details about the world-wide nature of this set of events and awareness raising.

One IMY-badged event which took place in June 2016 in Newcastle, at the renowned Literary and Philosophical Society on Westgate Road (http://www.litandphil.org.uk/) was an exhibition by Karen Rann, tracing the history of the contour line.  There is some merit to the claim that Geordie mathematician and surveyor James Hutton was the first to apply contour lines to assist in the mapping of terrain.  The task of measuring the Scottish mountain of Schiehallion was a scientific project of immense significance and, as Karen describes in her extensive blog (https://thegreatlinesproject.wordpress.com/), Hutton was charged with producing the equivalent of a surface model for the geophysicists to work with.  Karen’s blog relates her story of a dedicated search for the origin of the contour line, and her exhibition reflected that.

Cartographic methods of displaying terrain data have some synergy with the creative endeavour shown in Karen Rann’s work.  David Fairbairn’s contribution reproduced below considered some of the more traditional characteristics of contour mapping, as undertaken by geomaticians – but with an artistic output:

Representing the land surface using contours

As is evident from Karen Rann’s Great Lines project, a pattern of contour lines can be used to quantitatively model a rigorous framework for terrain, but can also be applied more impressionistically to convey a sense of the shape and variations of the earth’s surface.

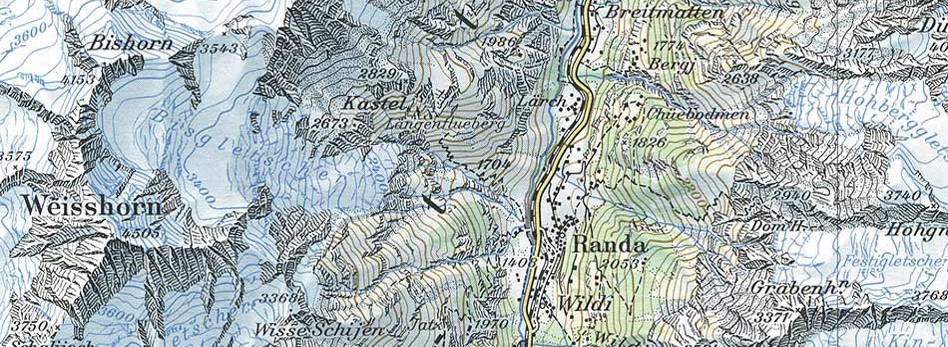
Mapmakers have no control over the location of the contour lines which represent reality, but their graphical appearance can be modified to give particular effects.  For example, the colour of a contour line on a standard topographic map can be used to reflect the nature of the surface: blue contour lines over ice, black contour lines over rock, brown contour lines over soil:

Picture3

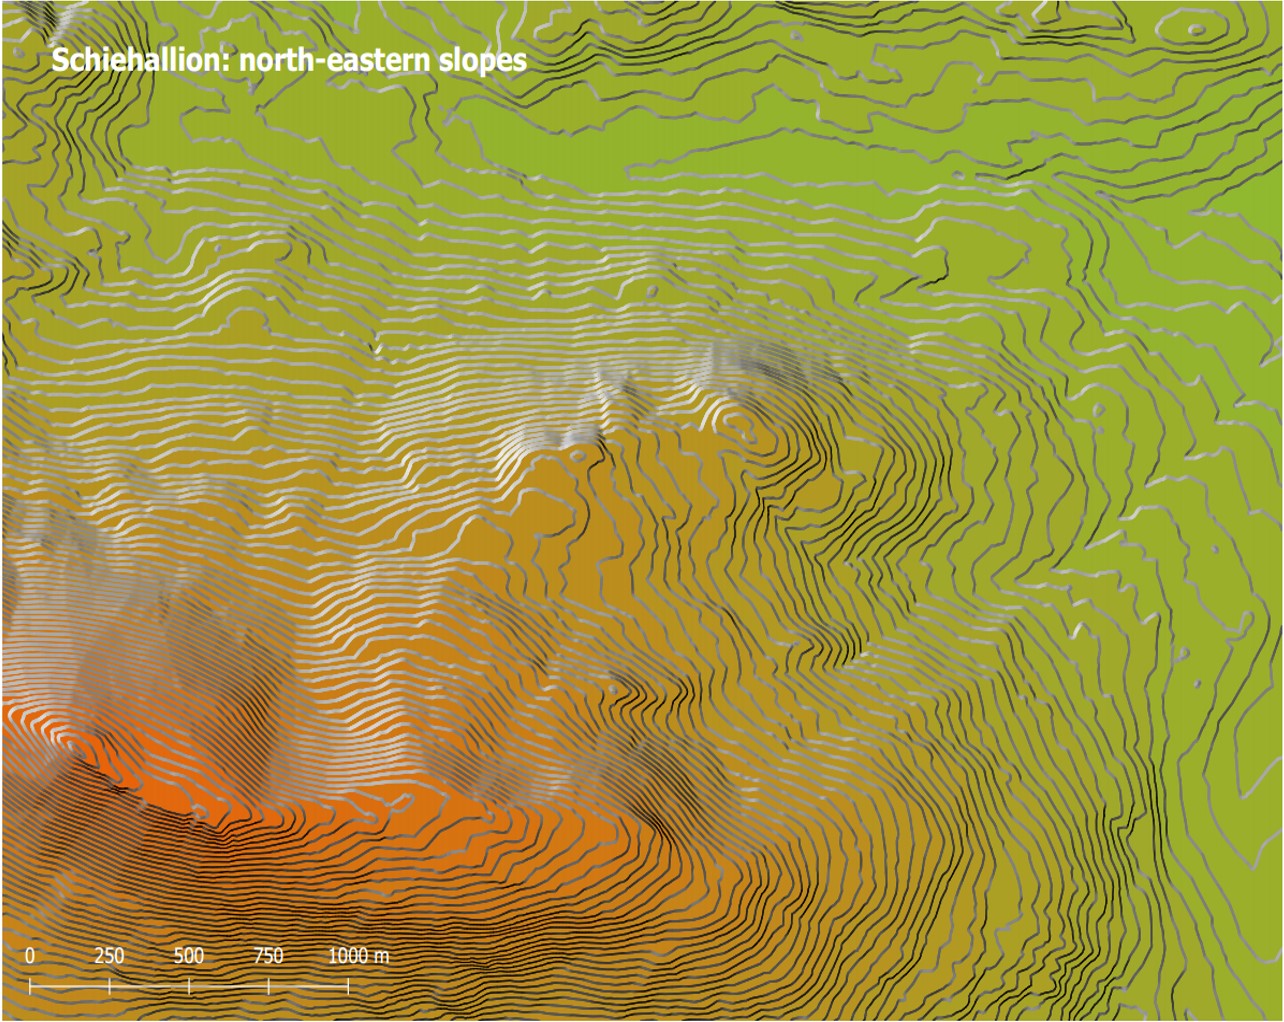
Other characteristics of lines, such as form (dashed lines, continuous lines) and thickness, can be used to modify the appearance of the contour pattern.  An effective combination, varying colour/shade and thickness, is that proposed by Japanese cartographer Kitiro Tanaka in the 1950s.  Sometimes called ‘illuminated contours’, this method of rendering the contour lines shows them lighter if they are on a terrain slope facing towards the north-west, and darker on slopes facing south-east.  In addition, the lines are made slightly thicker if they face directly north-west or south-east, and thinner otherwise.  The example below shows this method applied to the contours of Schiehallion: the result is a pseudo-three-dimensional portrayal of the terrain surface, helping with the interpretation of the contour pattern:

Picture2


ESRI UK User Conference Tuesday 17 May

This year’s ESRI Annual Conference took place once more in the QEII Conference Centre in the heart of Westminster.  It was good to meet up with several Newcastle graduates, each making their mark on the GI industry.  The major ‘take-away message’ from this year’s conference was the increasing ease by which the traditionally ‘clunky’ ArcGIS desktop can be left behind in favour of developing using ArcGIS Pro and ArcGIS Online, products with regular and frequent update cycles and increasingly comprehensive functionality.

From the perspective of ESRI, David Rix (1976 graduate) and Dominic Stubbins (1995) were amongst the welcoming corporate hosts, contributing to an efficiently-run and informative event, well worth the trip from the north!  Nathan Ward (1993) was manning the Leica stall, one of several associated partners exhibiting in the building.  Laura Hanson (2003 graduate), now with Arup, and Rachel Oldroyd (2011 graduate), now with the University of Leeds, were ex-staff members spotted, along with Meredith Williams (staff 2000-2010).

Joining Dominic from the 1995 cohort was Ian Moodie, whilst from even further even back, Rob Knight and Helen Durham (both 1985) are both thriving.  Clive Surman-Wells (1988) and Andy Hopkins (1996) made their presence known also, along with some 21st century graduates – Bruce Ford (2009), Claire Watkins (2009), Victoria Short and Matt Bowerbank (2010), Matthew Bierton (2014) and Jonathan Hallam (2015).

Next week, the re-unions will continue in London at the GeoBusiness event.  There is a formal Newcastle alumni meeting on Tuesday 24 May at 15:00 hrs.  Come along to the Business Design Centre in Islington, if you are in town …

GIS students present research projects Friday 13 May

This week saw the annual ‘Final Year Conference’, the showcase for the Stage 3 Geomatics students to present their dissertation research in a formal venue to their fellow students and to the staff and postgraduates in the School.  A total of 31 Newcastle Geomatics students delivered talks in two parallel tracks with themed session titles including ‘Built Environment’, Spatial Analysis’ and ‘Geovisualisation’.  The 12 final-year Geographic Information Science students’ topics were as follows:

Nada Alabdulwahed used an impressive range of satellite remote sensing imagery from the past 20 years to track the urban development of the city of Al Khobar in eastern Saudi Arabia.  Standard image analysis and classification techniques along with ground truthing and integration with other data on population and land reclamation allowed for accurate quantification of urban growth.

Ed Drummond-Hay researched house price changes across England and Wales, using millions of records from Land Registry, ONS and commercial sources.  His hypothesis was that house price increases in London ‘rippled’ out from the capital to affect the rest of the country after a time lag.  The dynamic and animated representation of such patterns was an important part of the output from Ed’s research.

Emmanuel Egunyu aimed to create an online website resource to promote tourism in his native Uganda.  Using OpenStreetMap data and open source technologies with PostGIS and Geoserver, he reported on the creation of a map-based information portal for those planning to visit national parks and view wildlife in this country.

Alexia Fenn’s study concentrated on the validity and reliability of observations from GPS receivers worn by athletes.  A variation of sport/athletics course shapes, course distances, and exercise/movement intensities were examined.  Walking, jogging, and sprinting over various distances and in a variety of course configurations were examined, with GPS accuracies determined for each exercise regime.

Will Franklin developed a system to estimate the safety of junctions on the road network in Newcastle.  By calculating a Junction Risk Factor, based on a number of parameters related to road conditions and traffic volumes, he was able to develop a predictive model to determine the optimum location for investment in road network improvements.

Jo Gallagher’s interest in spatially-enabled Twitter data led to a study of the geolocation of football clubs’ fan base.  He found that the ‘bigger’ the club, the more dispersed the distribution of fans – backing up the popular theory that the mean location of a Manchester United fan is some distance from Old Trafford.

Patryck Janicki’s research aimed to develop a geodatabase schema able to hold both CityGML data at Level of Detail 1 and main Industry Foundation Classes (IFC) classes.  The ability of the schema to abide by standards, allow for SQL queries, hold geometry effectively, was to be supplemented by an effective visualisation flowline through export to QGIS.  The outcomes of this project have impact on the integration of BIM with GIS.

This was also the focus of the research of Anthony Morley, who examined current technologies for importing a BIM model into a geospatial environment and assessing interoperability.  This involved using a range of software and data formats, including ArcMap, ArcScene, ESRI City Engine, REVIT, AutoCAD and FME.  The geometric and semantic integrity of the model, and the needs of users were considered.

Amber Kaye-Kenyon chose the analytical capabilities of ArcMap, ArcScene and City Engine (including Buffer, Viewshed and Line of Sight (LOS)) to look at the modelling of an urban sensor network.  In the context of the instrumented city concepts being developed in Newcastle upon Tyne, particularly around the university’s new Science Central campus, ease of use, visualisation and effective monitoring of the sensor network were derived.

Ben Nicholls undertook a very detailed study of some of the rich cartographic generalisation tools in ArcGIS.  Applying these to different types of feature (railways, contours, buildings etc. as represented on large scale Ordnance Survey data), and in different locations (e.g. central urban zones, rural regions), Ben presented an impressive assessment of the data pre-processing, algorithm effectiveness and presentation quality of such procedures.

Josh Watson’s theme was a big data set dealing with cardiac arrests outside hospital.  The spatial and temporal distribution of these events was determined, as a precursor to understanding the nature of the phenomenon and to try to raise low survival rates in the North East.  Clusters of cases were apparent and these were linked to population distribution, to ambulance stations and response times, and to times of day, season and year.

Imogen Weight made a comparative study of several web mapping APIs, assessing data needs, scope of functionality, usability, and final appearance of maps created in Leaflet, Mapbox, and the dedicated Javascript APIs for Google Maps and for ArcGIS.

The remaining students (Surveying and Mapping Science students) pursued research topics in a wide range of other spatial themes, many of which have a GIS ‘flavour’.  Environmental monitoring of coasts, glaciers, urban heat, and floods used GIS tools, as did further investigations of BIM, and further social investigations of education from a GI perspective.

Reflections on GISRUK 2016

The 24th GISRUK conference took place last week in the University of Greenwich.  After significant Newcastle input to the 2015 GISRUK in Leeds, this year saw a smaller presence – just David Fairbairn and Kaizer Moreri attended, each with a poster, each on VGI and the fidelity and value of such citizen-sourced data for applications in national mapping and in land registration systems; the overall attendance and size of programme was certainly smaller than previously. 

The venue was certainly impressive, Greenwich (a UNESCO World Heritage Site) looking stunning in the spring sunshine.  The university’s vice-chancellor, David Maguire – GIS guru from his time at ESRI and his continued joint authorship of ‘the book(s)’ – welcomed us, thanking the main organisers, Zena Wood and Mike Worboys from the Greenwich GIS Research Group.

There was the usual variety of sessions and papers, with some unusual focus on gazetteers, on novel systems and applications (e.g. an innovative tourist guide to Lancaster), and on VGI issues and uses.  Those ex-Newcastle GISRUK stalwarts from Maynooth introduced us to some interesting personalities, responsible to addressing GIS concepts long before GIS was ever thought of …

Workshops and challenges, and an appeal to informality which benefits the large number of MSc students brought along to GISRUK every year, are what can be expected from this annual meet-up.

The three keynotes, well-scheduled throughout the programme, were the highlights: Ross Purves (University of Zurich) demonstrated the enduring value of his long-standing research on tags, semantics, ontologies, and full text retrieval and analysis; Nye Parry (University of Greenwich) took us on a tour of music (and dissonance) which had a spatial aspect to it; and Jeremy Morley (an external examiner at Newcastle in a previous life), demonstrated, amongst other things, the response of Ordnance Survey to changes and opportunities in GIS technologies, in a wide-ranging and thoughtful presentation.  Amongst his assertions was that fundamentally GIS has not changed in the past 30 years, and that all developments have been incremental ‘add-ons’.  It was ever thus, of course, with Ordnance Survey itself being recognisable, even today, to the apocryphal cavalry officer for whom its maps were created from 1791.  The main debate of the conference, and perhaps one its main outcomes, was about the nature of change in GIS, and whether GIS needs a revolution or continued evolution.

LiDAR & hedgerows at the British Ecological Society Conference

I attended the British Ecological Societies 2015 conference over 4 days in December in the beautiful city of Edinburgh complete with Christmas jumpers and a ceilidh. It was a great opportunity to present my work – using LiDAR to model and measure the effects of cutting and rejuvenation management on hedgerow structural condition as wildlife habitat; to over 1500 delegates and to engage with the more ecology focused side of my PhD.

(image credit: BES on twitter)

The conference saw talks and posters from across a range of ecological disciplines including using various remote sensing techniques to measure and monitor forests from the global to the local scale. This included Markus Eichhorn from The University of Nottingham who has invited me to present my work to his research group in the new year and was keen to hear of other relevant work going on in Newcastle CEG. I would encourage anyone in CEG whose work is based around forest ecology to consider attending next year’s meeting as their was a decent sized community of forest modelers in attendance.

poster (2)

Ensuring I could effectively communicate the potential of my work to such a broad range of scientists attending the conference was a big challenge and exciting opportunity. The conference was a great reminder for those working with emerging technologies or applying existing technologies to new challenges that communicating to the end users of your work is key. In my case this includes agricultural ecologists and policy makers with a range of interest and familiarity with remote sensing and LiDAR. I was asked everything from “What is LiDAR?” to questions about how LiDAR could add to a huge range of ecological monitoring challenges, stressing the real need for communication and sharing of ideas across disciplines. I also believe attending BES was a great way for my work to stand out and to really engage with what is novel about my project, as the only presenter (that I heard of) attending from a civil engineering discipline I was in a really unique position.

Lyndsey

Geospatial in Vienna

It has been a good start to my two month sabbatical in Vienna.  Georg Gartner and his  team at the Technical University (TU) Wien Cartography department have been most welcoming, and my apartment (rented on the viewing of web-site photos alone) is gemutlich.  It is great to be staying in one of my favourite cities.

I remember watching the 2006 World Cup final in a bar in Vienna full of excited Italians.  By contrast, the Liverpool-Newcastle game was dull fare earlier this week: Flanagan’s was still smoky (I’d forgotten what watching a game in a bar where smoking is still allowed is like), but the capitulation of the Toon was no excitement for the (extremely small number of) black and whites.  From the ridiculous to the sublime, the walk back home took me past the final aria of that night’s Opera performance, being beamed live from inside the Vienna Opera House to a sizeable crowd outside.

Included in that crowd I spotted Prof Ana-Maria Coutinho, opera buff and cartography academic from Rio de Janeiro (also vice director of the forthcoming International Cartographic Conference in Brazil in August).  I caught up with her later in the week when she visited the department at the TU.  We had a good chat about the joint ICA Commission on Education &Training/Commission on Maps & the Internet workshop which I am co-organising in Curitiba, before the main event in Rio.

I have been able to put the finishing touches to my presentations for next week in the US, and also finalised some proposals in liaison with the Newcastle archaeologists.  And the texts for the Rio proceedings are due this month – my solo one already in, the paper by Kaizer, Phil and myself just about ready to go.

Auf wiedersehen …

Dr David Fairbairn

RSPSoc Wavelength 2015

From Monday 30th March till Wednesday 1st April, the department hosted the annual Remote Sensing and Photogrammetric Society (RSPSoc) Wavelength Conference. Since it’s rebranding from the student conference, which was last hosted in Newcastle nine years ago, young professionals are now also welcome to present their research and latest developments in all aspects of remote sensing and photogrammetry. The conference was organised by third year PhD student, Andrew McClune, whose research is focussing on the automatic reconstruction of 3D building models from aerial photography.

The conference was well attended by approximately 40 delegates, mainly from UK institutes but with some travelling from as far as Nigeria and Turkey especially for the conference. A wide range of research topics were presented. The opening session was dedicated to the research of  dust & gas detection from satellite platforms, before second year PhD student Magdalena Smigaj, presented her work entitled ‘’Remote sensing for UK forest health monitoring” in the first of the two vegetation sessions. The final session of the first day was a keynote session given by the International Society of Photogrammetry and Remote Sensing (ISPRS) Council members, who were in the area for an ISPRS Council meeting. Chen Jun opened with an introduction to the society before Christian Heipke, Leibniz Universität Hannover, and Marguerite Madden, University of Georgia, discussed their individual research topics “New approaches for automatic classification or aerial and satellite images” and “Geospatial Information Supporting Animal Movement and Habitat Studies”, respectively. The final day was closed with a meal at Blackfriars Restaurant, where ISPRS Council members and delegates continued to network and discuss research.

The conference prides itself on offering a strong scientific and social programme, with Tuesday morning being designated to the first batch of social activities. Whilst a small group went to battle it out over the annual game of laser quest, a local tour guide led the rest of the delegates around the many scenic delights that Newcastle has to offer. Although the weather did not hold up with a heavy downpour encountered mid-tour, the tour gave an insight into the history development of the city. The tour started along the Quayside visiting the many bridges along the river before working their way back to the University via the castle, Grainger market and Grey’s Monument.

Presentations resumed after lunch with the urban management topic which saw presenters from GetMapping UK present their street level imagery dataset and the online GIS platform for local parish councils, as well as the use of historical imagery for assessing planned urbanization. The second oral session of the day saw the second vegetation session of the conference and included the winner of Best Oral Presentation from Emily Norton, from Bournemouth University for her research entitled “Multi-Temporal remote sensing of mass graves in temperate environments”. She was proudly presented with a remote sensing book, kindly donated from sponsors Taylor & Francis.

A wide range of poster were presented towards the end of the second day with second year PhD Elias Berra discussing “Forest phenology monitoring by unmanned aerial vehicle” and first years Ben Grayson and Fikiri Mhenga presenting their proposed PhDs researching “Digital photogrammetric techniques in aid of UAV trajectory determination” and “Using remotely sensed products for improved hydrological models in high mountain hydrological regimes.” The final session of the second day was a sponsor session, where representative from Sterling Geo presented the latest developments of the ERDAS software suite whilst promoting the CHEST agreement, which entitles universities to purchased licences for the software at a heavily reduced price.

The second day finished with a meal on the Quayside before the second social event of the conference which saw delegates go bowling. For some it was their first time and they either took to bowling like a duck to water or were experiencing some beginners luck.

The final day was opened with a session dedicated to disaster management and prevention, which saw Maria Peppa and Polpreecha Chidburee, both second year Newcastle PhDs presented their individual PhD research topics entitled “Development of a UAV-based landslide monitoring system” and “Development of a low-cost, real-time photogrammetric monitoring system for landslide hazard analysis”. This was followed by a session of data integration before the conference was closed with a keynote address from David Holland, Ordnance Survey, presenting research on the creation of 3D datasets, a topic which he has been supervising Andrew on as part of his PhD.

A big thank you to the staff and PhD students that helped in the organisation and success of the conference, as well as Edward Malina from the Mullard Space Science Laboratory, part of University College London. Edward will now become the Wavelength Rep for RSPSoc and will now start to organise the next Wavelength conference in 2016.

Wavelength Delegates


RSPSoc 2014 – Aberystwyth

The annual RSPSoc conference was held from the 2nd till the 5th September at Aberystwyth University. In attendance from Newcastle University were School Research Fellow Dr Pauline Miller and 2nd year PhD student Andrew McClune, who both presented on their own projects. Whilst the title of the conference was ‘New sensors for a changing world’, a large variety of research was presented over the three days from mass grave detection to using citizen sensor data to classify remotely sensed imagery.

The first day of the programme consisted of four workshops: lidar processing using high performance computing; the habitat inventory of Wales; an RSPSoc UAV special interest group (SIG) meeting; and a NERC Field Spectroscopy Workshop. The UAV SIG meeting was attended by Pauline, who is involved in a number of UAV research projects at Newcastle. This meeting was held jointly with ARPAS-UK (Association of Remotely Piloted Aircraft Systems), and provided a good opportunity for the academic community to interact with industry representatives from a number of UAV service sectors. The workshop was centred around debate on some highly topical issues, including how to optimise the quality of scientific UAV sensors, and aspects surrounding legislation and licensing. Overall, it provided an excellent forum for academia-industry discussion, and will hopefully be a forerunner for similar future meetings. An ice breaker reception was held on the evening of this first day at the National Library of Wales, with the opportunity to visit the Dylan Thomas exhibition and view the impressive map collection which consists of over 1.5 million maps (though there was not enough time to get round them all!).

The second day saw the official opening of the conference with a keynote session from Dr Susan Brown of Winrock International, who spoke about measuring carbon stocks in tropical forests. Pauline chaired the first morning session on Image-Based Measurement Techniques and Applications, and also presented her research on the use of photogrammetric approaches for measurement of multi-decadal Antarctic glacial mass change. The afternoon started with another keynote address from Dr Masanobu Shimada from the National Space Development Agency of Japan before technical sessions on LiDAR and REDD+. The second day was concluded with a steam train journey along the Vale of Rheidol railway, sponsored by Newcastle PhD student Mitko Delev’s company Bernard Geomatics, to Devil’s Bridge for some refreshments.

Picture of the front of the stream train which took delegates to Devil's Bridge, with the journey sponsored by Bernard Geomatics
Picture of the front of the stream train which took delegates to Devil’s Bridge, with the journey sponsored by Bernard Geomatics

The third day started with Dr Richard Lucas delivering a keynote presentation regarding sensor interoperability in the context of new sensors. Technical sessions covered a wide range of topics from landslides and mass movement to observations and impacts of fire and ice. A diverse range of topics were also presented in the poster session, where Andrew presented his work on 3D building reconstruction from aerial photography. The conference dinner and award ceremony was held in the evening and the recipient of the best doctoral thesis award was Newcastle Geomatics graduate Dr Matthias Kunz (2014), for his research on ‘Elevation changes of mountain glaciers in the Antarctic Peninsula using ASTER-controlled archival aerial photography.’

For those still standing after the previous night’s ceilidh, Professor Mark Danson provided the final keynote session entitled ‘Laser spotlight on forest structure’ before the final series of technical sessions on landcover and landuse and UAVs, which brought the conference to a close for another year.

Overall the conference was a resounding success and a great platform for the RSPSoc 2015 conference, hosted in Southampton, to build upon.

SOCET GXP Image Exploitation

Last week I attended a training course in Cambridge on Image Exploitation using SOCET GXP. The photogrammetric software, developed by BAE Systems, is the latest release and the successor of the SOCET SET software. As this is going to be the intended software I will be using for my 3D modelling of buildings, and with nobody in the Geospatial Engineering department having any experience with SOCET GXP (SOCET SET is currently installed on the computers), I was chosen as a representative from the University. The majority of the attendees had military backgrounds, two from the Swiss and two from the American military. There was a few from industry, including two from a 3D modelling company in London.

The four day course started with a basic introduction to the software and getting to know our way around the windows. SOCET GXP has made several alterations to SOCET SET, most significantly the interface. GXP has two main windows, the Workspace Manager and Multiports. The Workspace Manager is where all the data is managed, and the Multiport is where the data is displayed. Data is loaded from the Workspace Manager into Multiports. Previously, SOCET SET could only load two images at a time. Now with GXP, four images can be loaded, either as a singular view with the imagery in layers, similar to that of ArcGIS, or in a tiled panel. GXP has also adopted the ribbon menu approach, similar to that seen in Microsoft Word, which makes it much easier to find things compared to SET. After drawing and editing the image, various formats can be used as outputs, for example a screenshot can be exported straight into PowerPoint, shapefiles can be created in a geodatabase, and GeoPDFs can be produced.

After the first two days of familiarisation with the software, the final two days looked at the capability of data extraction, in both 2D and 3D using stereo. Tools in the toolbox are segmented into different types depending on their functionality; draw tools, mode tools (which describe how the draw tool operates) and modifier tools. Cue Cards help explain how to use the tool, making them very straightforward to use. One of the main tools in the software which may prove worthwhile in my project is the Automatic Feature Extraction tool, which can depict building outlines and trees based on a set of parameters. Having only used this tool on lidar data, it will be interesting to see what results it yields for aerial imagery. For 3D extraction, several models exist in GXP, such as planar roofs and gabled roofs. These can usually be utilised by defining a ground point and the rooftop points. Although this is an easy option for modelling, it cannot be incorporated into my work-flow due to its heavy reliant on manual interpretation of ground and roof points. The accuracy of the building is therefore dependent on the analyst.

As well as learning about the software a vast amount of ‘networking’ was undertaken over the four days.

The course has given me an insight into the new and existing capabilities of SOCET GXP and how it can potentially be utilised in my research project.

Andrew

Google should do Google Geometry search (or why Inspire might be a waste of time)

I have spent the last 10 years organising, analysing and presenting spatial data in a variety of projects. My research has led me into the dark corners of transport modelling, climate statistics, energy modelling and a whole host of other fields. Spatial data underpins all these disparate activities (and we also make cool maps and use cool tech). However, I am increasingly frustrated by the effort that goes into finding and looking for spatial data. In the UK we are sort of OK as far as it goes as we have the Ordnance Survey and a few commercial and academic portals that provide (at a price) one stop shopping for most things. I suspect the situation is similar in most first world nations but that certainly is not the case in many other places.

I have now sat through a number of presentations on INSPIRE, have looked through geoportals both open and closed, battled with OGC metadata specs, geoserver config and openlayers and come to the realisation that we should just let Google do it. Think about it, they have the financial clout, the technical clout and they are probably (definitely in my case) smarter than us anyway. I envisage a Google geometry search so that I type a place name and I find spatial data stored as a file of geometry (raster or vector) as the result.

Ah, but will it be the right one – well surely this is just another good use for Page Rank? Is it not the case that more likely than not in the UK we will use an Ordance Survey Opendata admin boundary. Surely their metrics will show this? I mostly want the best information for the job and this could give it, quickly, easily and cleanly. Page rank for spatial can do what ISO 19115 will never do and provide a filter of perceived utility.

Ah, but “spatial data is more complex”. Is it really? What is complex about it that big compute and big tech cannot sort? Take projections – why can’t we just reproject our data a la Google translate (easier as it is just maths not language). What about layers of geometries that interact spatially – well this is resolved using a spatial index in a database – I suspect having a massive spatial index of all the objects in the world would not be a stretch for a company whose starting point is an Index. And format conversion – that is just compute – shouldn’t be an issue (or perhaps just index and cache call the converted versions for everything). Linking spatial data to a rich keyword based and natural language processing means we should be able to find things – alternative geographical names fall out of the system (and as a not insignificant byproduct the number of neogeography talks may dwindle).

Imagine a world where I want data on Nigeria Rivers and I type into Google Geometry such a query term – the result, peer reviewed by the vast caucus of humanity (or those special ones interested in spatial anyway) is a link to a file that I can visualise online, download and add value to or combine in a web based “mash up”. One suspects our tools would be simplified as well when data is easy to find, view and retrieve.

We can then ditch the metadataverse and multiple WMS/WFS endpoints and catalogue services that make up the current crop of portals and the INSPIRE vision and do what we do best – use spatial to help understand the world and make better decisions.  If this is the way that users expect spatial data then there is incentive to put your data out there (and let Google find it and index it).  There’ll need the spatial index anyway to do sensors properly (but that’s another story).

GeoAnorak. Changing the world one vertex at a time.