Introduction
Bayesian statistical have become very popular in the last 5 to 10 years amongst environmental scientists, due to their much greater flexibility than conventional frequentist approaches. They also have an intuitive appeal: many people still incorrectly mis-interpret p-values, thinking that they are testing the significance of a hypothesis, when of course in reality they are giving the probability of the data, given the null hypothesis. This ‘back-to-front’ approach of the traditional methods also causes problems for students learning statistical methods.
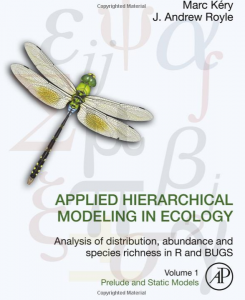
Several excellent books have been published in the last few years on Bayesian stats, aimed at ecologists. I particularly like the approach taken by Marc Kery and colleagues, who now have now published three texts on the subject.


You’ll have spotted that the most recent book has ‘Volume 1’ in the title, so we look forward to the second volume in the series. As you’ll have guessed from the titles, the difficulty and complexity of the models increases with each book. If you’re new to Bayesian stats, start with the Introduction to WinBUGS for Ecologists. This covers models which could mainly be done with standard frequentist statistics (some of the mixture-models described in the last chapters would be tricky however). A big advantage of this approach is that the book initially covers straightforward analyses using the linear model lm command, examines the outputs, and then shows the identical analysis done from a Bayesian approach. This approach rapidly illustrates the much ‘richer’ amount of information that can be obtained from a Bayesian rather than frequentist approach. So the book shows how to calculate a mean (yes, I know that sounds trivial, but still useful), equivalent of a t-test (but via lm for the frequentist method), one- and two-way anova, regression, glm, and mixed-effects models. Yes, all these can be done by conventional methods. If I’m doing a simple regression, I’ll still use lm rather than writing BUGS code, but as a way of describing Bayesian methods its clarity is difficult to fault.
As you might expect, all the R code for the analyses described in the book can be downloaded from the web. But intriguingly, not the datasets. This is because Kery has a bottom-up approach to the data (see pages 7 and 8 of his introductory book):rather like a motorbike mechanic, you can only fully understand how the motorbike works if you have assembled all the pieces together before riding off on it. Likewise with a model: Bayesian models can become complex, so rather than presenting the reader with a set of data to analyse, the reader creates a set of data with known properties (mean, sd etc.), which is then assembled for modelling. Then the reader can look at the output of the model, and see how well it matches the original inputs. This avoids the ‘black-box’ problem of not understanding what the model is up to. It isn’t really needed for a simple familiar model like the Bayesian regression we’re about to discuss here, but for complex mixture, hierarchical random-effects or state-space models it seems an excellent method to test that your Bayesian code, in BUGS, JAGS, Stan or Greta, is doing what you think it should, before trying it out on real data.
The book uses WinBUGS, although the code works fine for OpenBUGS (still under active development), and with minor tweaks for JAGS. More changes would be needed for Stan, the newest Bayesian framework. I’ll admit here that there are a number of things that I strongly dislike about existing Bayesian methods:
-
You have to learn yet another language. BUGS, JAGS and Stan all have a different syntax to R, with slightly different function names etc.
-
You have to write a set of instructions to an external text file outside of R, which is then called via the relevant R library (e.g. R2OpenBUGS) to carry out the Bayesian analysis.
-
The BUGS/JAGS/Stan instructions cannot be debugged readily in R: it is fired off in one block for Bayesian analysis making debugging tricky with complex models. If you use RStudio, the IDE simply sees the code as a block of text and so ignores it.
I was there very intrigued by the new Greta R package by Nick Golding https://greta-dev.github.io/greta/ which was released on CRAN a few months ago. Potentially, this has the potential of providing R users with a much more intuitive interface for running Bayesian models. It works directly in R (no more writing of external text files), calling the Google Tensorflow backend for the heavy lifting. So, out of curiosity, I thought I’d try to run one of the simple examples from Marc Kery’s first book via lm, R2OpenBUGS and greta for comparison.
This is a slightly simplified version of the example in Chapter 8 of Kery’s book; a simple regression of Swiss wallcreeper numbers, which have declined rapidly in recent years:

As Kery comments, strictly-speaking it would be better to use a generalised linear model (since these are proportion data), but as a simple example this is OK. As usual, he generates the data to play with, for 16 years worth of data, intercept of 40, slope of -1.5 and variance (sigma-squared) of 25:
set.seed(123)
n <- 16 # Number of years
a <- 40 # Intercept
b <- –1.5 # Slope
sigma2 <- 25 # Residual variance
x <- 1:16 # Values of covariate year
eps <- rnorm(n, mean=0, sd=sqrt(sigma2))
y <- a + b*x + eps # Assemble the data set
plot((x+1989), y, xlab=“Year”, las=1, ylab=“Prop. occupied (%)”, cex=1.2)
abline(lm(y ~ I(x+1989)), col=“blue”, lwd=2)

Note: I have set a random seed, so your data should be the same. However, whilst the linear model results will be identical, the Bayesian results will still differ due to the MCMC.
Conventional analysis via linear model
Let’s look at the results from a standard analysis using lm
print(summary(lm(y ~ x)))
## Call:
## lm(formula = y ~ x)
##
## Residuals:
## Min 1Q Median 3Q Max
## -7.5427 -3.3510 -0.3309 2.0411 7.5791
##
## Coefficients:
## Estimate Std. Error t value Pr(>|t|)
## (Intercept) 40.3328 2.4619 16.382 1.58e-10 ***
## x -1.3894 0.2546 -5.457 8.45e-05 ***
## —
## Signif. codes: 0 ‘***’ 0.001 ‘**’ 0.01 ‘*’ 0.05 ‘.’ 0.1 ‘ ‘ 1
##
## Residual standard error: 4.695 on 14 degrees of freedom
## Multiple R-squared: 0.6802, Adjusted R-squared: 0.6574
## F-statistic: 29.78 on 1 and 14 DF, p-value: 8.448e-05
Bayesian analysis using OpenBUGS
I’m using OpenBUGS simply because WinBUGS is no longer being actively developed if I’ve understood the changes correctly. Remember that the bulk of the commands go into an external file, before being called by the bugs function. Kery’s original code also calculates predicted and residuals for each observation, plus Bayesian p-values.
library(R2OpenBUGS) # or library(R2WinBUGS) if using WinBUGS
# Write model
sink(“linreg.txt”)
cat(“
model{
# Priors
alpha ~ dnorm(0,0.001)
beta ~ dnorm(0,0.001)
sigma ~ dunif(0,100)
# Likelihood
for(i in 1:n){
y[i] ~ dnorm(mu[i], tau)
mu[i] <- alpha + beta*x[i]
}
# Precision
tau <- 1/(sigma * sigma)
}
“,fill=TRUE)
sink()
# Bundle data
win.data <- list(“x”,“y”, “n”)
# Inits function
inits <- function(){ list(alpha=rnorm(1), beta=rnorm(1), sigma = rlnorm(1))}
# Parameters to estimate
params <- c(“alpha”,“beta”, “sigma”)
# MCMC settings
nc = 3 ; ni=1200 ; nb=200 ; nt=1
# Start Gibbs sampler
out <- bugs(data = win.data, inits = inits, parameters = params, model = “linreg.txt”,
n.thin = nt, n.chains = nc, n.burnin = nb, n.iter = ni)
print(out, dig = 3)
Inference for Bugs model at “linreg.txt”,
Current: 3 chains, each with 1200 iterations (first 200 discarded)
Cumulative: n.sims = 3000 iterations saved
           mean    sd   2.5%    25%    50%    75%  97.5%  Rhat n.eff
alpha     39.896 2.729 34.389 38.210 39.970 41.710 44.981 1.006 1100
beta      -1.348 0.277 -1.879 -1.524 -1.349 -1.178 -0.776 1.006  970
sigma      5.204 1.155 3.533 4.393 5.006 5.773 8.186 1.001 3000
deviance  96.374 3.015 93.000 94.187 95.600 97.652 104.200 1.001 2800
For each parameter, n.eff is a crude measure of effective sample size,
and Rhat is the potential scale reduction factor (at convergence, Rhat=1).

DIC info (using the rule, pD = Dbar-Dhat)
pD = 2.767 and DIC = 99.140
DIC is an estimate of expected predictive error (lower deviance is better).
detach(“package:R2OpenBUGS”, unload=TRUE)
So the Bayesian analysis via BUGS is giving intercept of 39.9 and slope -1.4,, with sigma at 5.2 (we set sigma-squared at 25 when generating the data).
Greta package
The new greta package (apparently named after a German computer scientist) requires Tensorflow to be setup. I’ll admit that I’ve struggled to get Tensorflow to run on a Windows PC (python bindings go astray) but it works fine on Linux.
library(greta)
# Note: R allows <- or = to assign variables. Following greta documentation
# advice to use <- for deterministic and = for stochastic variables.
x_g <- as_data(x) # Convert input data into greta arrays
y_g <- as_data(y)
# variables and priors
int = normal(0, 100)
coef = normal(0, 100)
sd = normal(0,100)
mean <- int + coef * x_g # define the operation of the linear model
distribution(y_g) = normal(mean, sd) # likelihood
m <- model(int, coef, sd) # Set up the greta model
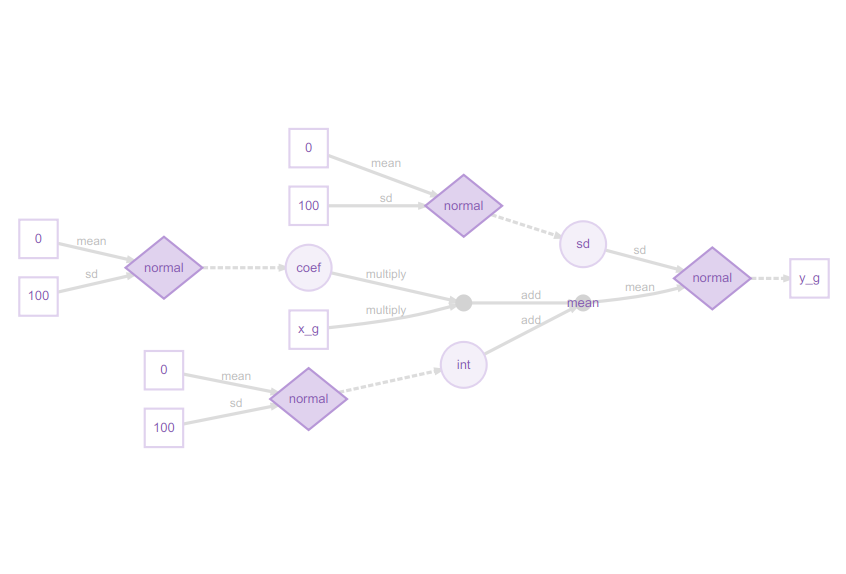
plot(m) # Visualise structure of the greta model

I really like these greta model plots, as they explain even complex models clearly from a Bayesian perspective. This may at first glance look excessively detailed for a simple regression model, but the legend shows how it all fits together:

You can now see how the slope coefficient is multiplied by the x_g (year) predictor, then added to the int (intercept), but both the slope and intercept are sampled from a normal distribution, as is the residual error. The response variable, the proportion of sites occupied (y_g) is itself sampled from a normal distribution. This might strike you as confusing at first, if you are used to the conventional way of writing a linear model as:
y = a + b.x + ε
Here, the diagram shows the approach more commonly used in Bayesian methods:
y ~ N(a + b.x, sd)
in other words, the response variable y is being sampled from a normal distribution with mean a + b.x, and standard deviation sd.
# sampling
draws <- mcmc(m, n_samples = 1200, warmup=200)
print(summary(draws))
##
## Iterations = 1:1200
## Thinning interval = 1
## Number of chains = 1
## Sample size per chain = 1200
##
## 1. Empirical mean and standard deviation for each variable,
## plus standard error of the mean:
##
## Mean SD Naive SE Time-series SE
## int 40.209 2.7641 0.079791 0.20055
## coef -1.378 0.2884 0.008324 0.02069
## sd 5.200 1.1180 0.032274 0.05647
##
## 2. Quantiles for each variable:
##
## 2.5% 25% 50% 75% 97.5%
## int 34.226 38.487 40.219 42.118 45.4184
## coef -1.955 -1.561 -1.377 -1.200 -0.7697
## sd 3.679 4.403 4.976 5.833 7.6671
Here the greta model has intercept of 40.2, slope -1.4, and sd (sigma) 5.2.
Conclusions
The greta output is very similar to that from BUGS, but to my mind the code is simpler and more intuitive. Both packages can produce the usual MCM trace plots (or ‘hairy caterpillars’ as I heard them described in one talk!). Greta is much slower to run than BUGS, so I suspect with large datasets CPU time might be an issue, and Tensorflow might be tricky to setup for some configurations.. The greta graphical description of the model, via the diagrammeR package, is particularly clear and intuitive, explaining the structure of the Bayesian model. This document was drafted in RMarkdown https://rmarkdown.rstudio.com/ which promptly crashed with BUGS, but was fine with greta.
Greta is still in an early stage of development, but its website https://greta-dev.github.io/greta/ has lots of useful examples. It is clear that people are already pushing it to its limits, implementing hierarchical models https://github.com/greta-dev/greta/issues/44 etc., so watch this space…