With COVID-19 affecting all aspects of our lives, mathematical models have been thrust into the limelight as the main way decisions are being made regarding the crisis. Models are a way to simulate possible outcomes in the real world and are useful when key information about a phenomenon is unknown. They are based on a series of assumptions and these assumptions are what determine how accurate our model is. In the case of COVID-19, these can include how likely you are to get infected to how people interact with others and their movements. We cannot predict human behaviour with 100% accuracy, nor do we know all the parameters that affect this particular outbreak, so there will be some error in any model we create, however a level of simplification is necessary for efficient computation.
A simple example of an outbreak model is the SIR model, which stands for “susceptible”, “infected” or “recovered”. The model assumes that everyone starts off susceptible – which is a reasonable choice given the information we have about COVID-19 and if you come into contact with an infected person you have a certain chance of getting infected. Since this is a relatively simple model that we will use, it does not take into account any organised travel such as travelling to a central place in a community (shops, places of worship etc), but these things can be implemented into the model. This also does not consider mitigation methods such as self-isolation, in this model, infected individuals act as susceptible individuals would. After infection you become “removed” or commonly known as “recovered”, this category refers to those who can no longer pass on the disease whether they overcome the illness or die from it.
Firstly, people are assigned to the “susceptible”, “infected” or “recovered” groups. We usually have two parameters which we can change, β and γ. The maths behind the SIR model – without births and deaths independent of the infection – is described by a set of differential equations as follows:
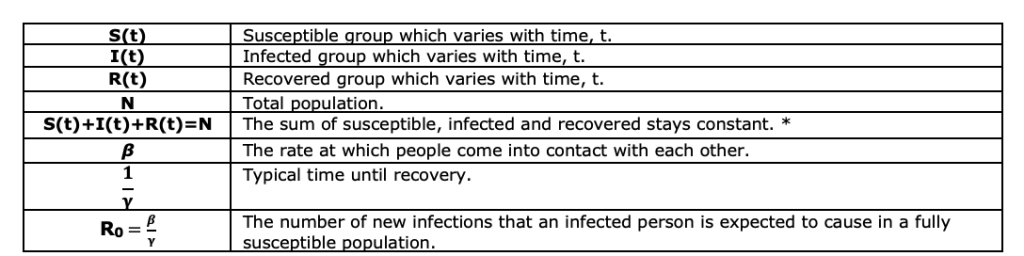
Below we have the results of a simple simulation as an example SIR model. Between the three simulations, we have kept γ constant and only changed the value of β. As you can see the last plot with the highest value of β = 5 has a very quick spike as a large proportion of the population get infected very quickly. If we decrease our parameter β = 2, we see that the infections decrease quite significantly and we have started to “flatten the curve”; you may think of this change as perhaps increased hygiene measures or self-isolation. In the first plot, we have decreased β further to β = 0.5 and we see that the infection does not really manage to get a hold, and, in fact, in most simulations, the infection does not really start, as now the R0 is below one. The main takeaway from this small simulation is how sensitive the model is to the small changes in parameters and why measures such as simple as better hygiene have been recommended.
The Imperial College London Model
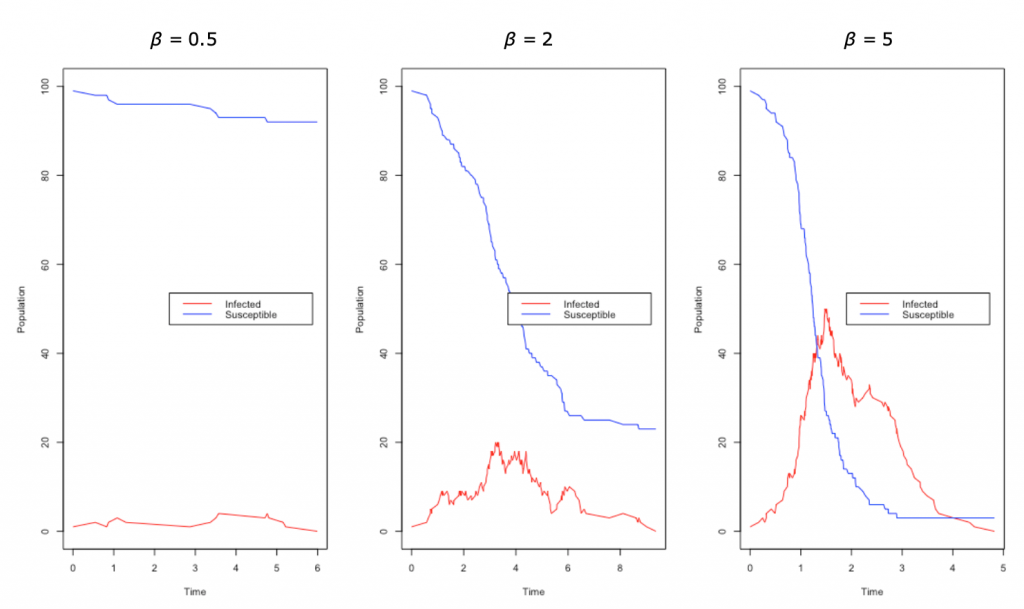
The Imperial College London model was what was cited for the policy decisions regarding the UK’s response to COVID-19. The simulations looked at both UK and the US but here we will mainly consider the results surrounding the UK. The study looked at the effects of mitigation (slowing the growth of the epidemic) and suppression (reducing R0 < 1) methods on the number of cases in the country and whether it is possible to keep cases below ICU bed capacity. The model was a modified simulation model used for pandemic flu planning but the crux of it is individuals being simulated in a similar manner to SIR. The model does, however, contain more variables such as moving people to isolation and specific movement behaviours to take into account the country’s specific challenges. For example, contact was made with individuals in households, schools and at work as well as the wider community, which was not accounted for in our simple SIR model. Clearly, if a member of your household gets infected you are more likely to also get infected than if an arbitrary person in your community is infected. The model also took into consideration demographical data such as age to determine the number of critical care beds that will be occupied. In the model, the incubation period was assumed at 5.1 days and infectiousness was assumed from 12 hours before the onset of symptoms but with reports of asymptomatic people spreading the virus, we do not know how accurate this assumption is at this moment. R0was placed at around 2.4, which is in line with estimates from Wuhan. The mitigation options that were considered in the study were case isolation in the home, voluntary home quarantine, the social distancing of those over 70 years of age, social distancing of the entire population and the closure of schools and universities. These variables all have their own assumptions on the decrease of contact due to them however an interesting assumption was that 25% of universities would remain open.
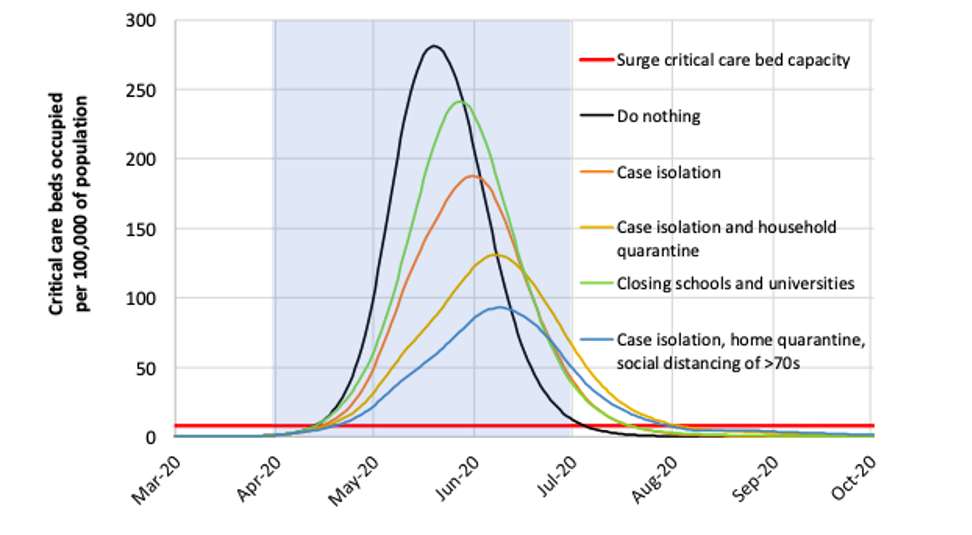
What we can see from the simulation is that in all considered scenarios we exceed the critical care bed capacity significantly, a minimum peak demand of 8 times higher than capacity.
The best outcome is seen from a combination of school and university closure, case isolation and general social distancing, however it is predicted that when restrictions are lifted that the epidemic will reach a peak later in the year.
The Oxford Model
The Oxford model gained publicity after headlines suggested up to 50% of people may have been infected. This was not quite the full story and has been contested by other scientists. The yet to be peer-reviewed Oxford paper is less modelling what will possibly happen and more a set of hypothetical scenarios given what we know right now. What the team did was use an SIR model, with the usual assumptions, with some added assumptions that deaths due to the disease were well reported and only occurred in the vulnerable subset of the population. The model also assumed R0 (the basic reproduction number) as between 2.25 and 2.75, which is where other professional estimates lie, so this seems reasonable. The other parameter which changed was the proportion of the population at risk of serious disease, this just seems to range from 0.001% to 0.1% of the population arbitrarily. The model was fitted to the first 15 days after the second death recorded to avoid the effect of control strategies put in place. Then, given a number of deaths and a proportion of the population that was at risk of these deaths, reverse engineered the model to show how many people are likely to be currently infected. Where the headlines come in is that if the proportion of vulnerable people was 0.001% then over 50% of the population must have been infected by March 15th to give us the number of deaths that we have.
This has been controversial as over 1 in 8 people in the UK are over 70 with many of those having underlying health conditions so it is unlikely that only 0.001% of the population is at risk of dying from COVID-19. What we have to bear in mind is that, in the end, we do not know how many people have already been infected as we are not doing the antibody tests to determine that.
The team themselves tweeted, saying their “results are not forecasts,” and that the country doesn’t “know the current state of the epidemic because we do not know the parameter ρ,” (the proportion of the population that is vulnerable).
In the end, modelling allows us to see the effects of our strategies quickly, before we even implement them. It’s obvious, however, that even small changes to the parameters of these models, which represent simplified versions of reality, can have large effects on the outcomes. Therefore it’s critical that we continue to gather more real-world data, by monitoring the outcomes of other countries, or measuring the real spread of the virus in the population through testing. It’s vital too that we understand the statistics behind the headlines and maintain a healthy scepticism of sensationalist stories.
- For an interactive SIR model
- John Hopkins University early outbreak model using an SEIR model
- Video on SIR model
- The COVID-19 Actuaries Response Group’s short review on challenging Imperial’s model
- Imperial’s paper on COVID-19 modelling
By Laura Etfer
Laura is a third-year Maths and Statistics student interested in medical statistics and infectious diseases. Outside of university, she helps to run a team of charity volunteers and is working on perfecting her lemon cake recipe.