
The location of the football team that you support is often a cause for debate, with chants like “we support our local team” being heard on the terrace week in week out. And now with the influx of football fans taking to twitter to support their teams this provides another way of measuring this metric.
As a group the idea of using twitter to crowd source the location of events is not a new one. Previously we have used it to record flood events across the north east allowing for a real time map to be produced. An idea which will be used heavily in the forthcoming iTURF project (integrating Twitter with Realtime Flood modelling).
So for me to develop a football script it was simply a matter of applying our previously developed scripts to record the locations of tweets related to football teams. For this I used the official hashtag for each team and then simply recorded the club, location and time, the actual body of the tweet is not stored.
Once this script was in place and I had the data feeding into a database I was able to develop a webpage displaying the tweets in real-time.

which is available here
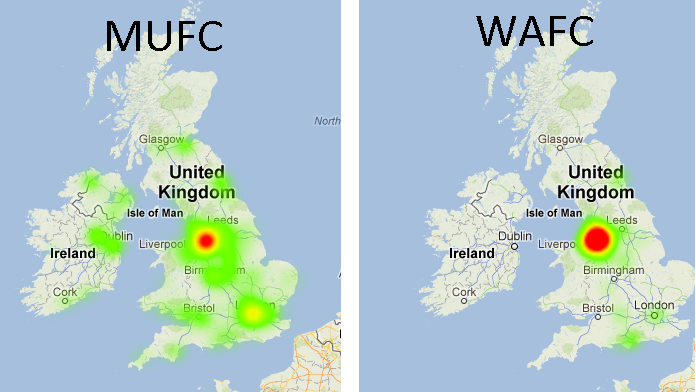
As well as this by using the google maps api I was also able to produce heat maps for each club. Showing the hotspots for the support of each team, predictably some show more spread than others.
Analysing a section of tweets also revealed some interesting statistics the club with the lowest average distance from tweet (uk based only) to their home ground was Fulham and Newcastle who pride themselves in their local support were the second furthest away.
| club | Average distance in km |
| Fulham FC |
81.64537729 |
| West Ham United FC |
82.46339901 |
| West Brom Fc |
82.78354779 |
| Wigan Athletic |
109.7845034 |
| Tottenham Hotspur |
112.3828775 |
| Southampton FC |
121.436554 |
| Stoke City |
123.7468635 |
| Manchester City |
128.4830384 |
| Chelsea |
134.4779064 |
| Reading Football Club |
141.2626039 |
| Arsenal FC |
147.5236349 |
| Aston Villa Football Club |
148.2891941 |
| QPR |
157.5900255 |
| Swansea |
162.7745008 |
| Norwich City |
164.774284 |
| Sunderland |
172.5479224 |
| Everton |
176.5113378 |
| Manchester United |
184.157026 |
| Newcastle United |
203.0311727 |
| Liverpool |
209.1425266 |
However analysing the proportion of tweets by county about team in their county, it revealed that almost 85% of the recorded football tweets in the Tyne and Wear region were about either Sunderland or Newcastle. Whilst Norfolk, which is said to be a one team county, had only 47% of the recorded tweet mentioning Norwich City.
| County | Teams | Proportion about teams |
| Tyne and Wear | Sunderland & Newcastle |
84.54% |
| Haringey | Tottenham Hotspur |
74.83% |
| Manchester | Machester United & Manchester City |
64.44% |
| Merseyside | Liverpool & Everton |
63.86% |
| Hammersmith and Fulham | QPR & Chelsea |
62.79% |
| Southampton | Southampton |
61.80% |
| Stoke-on-Trent | Stoke |
48.25% |
| Norfolk | Norwich |
46.99% |
| West Midlands | West Brom & Aston Villa |
36.12% |
| Islington | Arsenal |
30.00% |
| Newham | West Ham |
18.52% |
| Berkshire | Reading |
18.35% |
| Swansea** | Swansea |
11.11% |
| Richmond upon Thames | Fulham |
8.51% |
**Note the low proportion for Swansea is suspected to be due to the clash with Stoke City. Whilst Stoke City hashtag is #scfc and Swansea City’s is #swansfc are large number of #scfc are still recorded in south wales.
The hope is for this work whilst relatively simple and rather unscientific it demonstrates what can be achieved by using twitter as a source of information. It also provides a good way of load testing our code and backend database that we will use in the iTURF project