As part of the School of Civil Engineering and Geosciences involvement in University student recruitment activities, prospective 6th form and college students can attend Open and Visit Days. These days give students the opportunity to come and learn a little bit more about the courses that are offered at the University, including those taught within the School. Within Geomatics, prospective students are given some experiences of what it might be like to study Geographic Information Science (GIS), or Surveying and Mapping Science (SMS) Undergraduate courses via a handful of taster exercises. These exercises are designed to enable staff members to talk about some of the basic concepts that a prospective student might learn about should they decide to apply and study GIS or SMS.
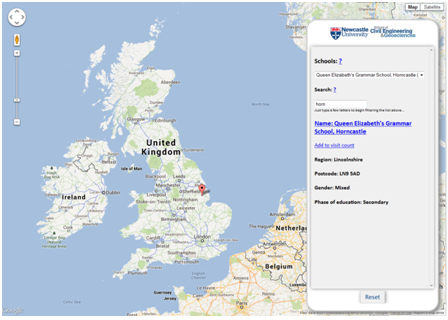
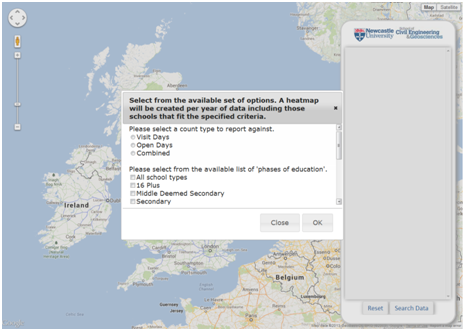
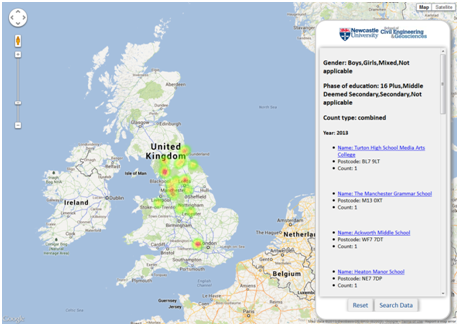
A key student recruitment activity within the School and more widely the University, involves the coordinated marketing and distribution of promotional materials focussed on Undergraduate courses to different colleges and schools around the UK. In order to better understand how the School’s involvement in this activity leads to prospective students attending the University Open and Visit Days, thus showing an interest in the courses on offer from the School, a very simple web-based tool has been developed to record where prospective students are travelling from on Visit and Open Days, by recording against the school or college at which the student attends. However not only does this begin to allow recruitment staff to understand how marketing activities are leading to prospective students attending the Visit and Open Days, it also doubles as a taster exercise in explaining some of the basic concepts of data capture, management and visualisation that a student would learn more about within the GIS and SMS courses. A prospective student is able to search for the school or college that they attend from a geocoded set of more than 60,000 schools, and then subsequently increment a count against that particular school for the particular year in which they attended a Visit or Open Day. All this information is stored within a PostGIS-enabled PostgreSQL relational database, and is served out to the webpage via JSON following the use of standard SQL queries to query the underlying data. As a result a prospective student, as well as recruitment staff, are able to create custom Heat Maps (intensity, not temperature!), all powered by the Google Maps API, of their data, or data from previous years. The query interface allows different HeatMaps to be created based on sub-selections of school type, gender (boys only, girls only, or mixed gender schools) and years of interest.
For clarification the database stores no other information about the student other than a count against a particular school or college at which the prospective student attends, and the addition of new information is protected behind a username and password. The following images give some illustrations of this interface and tool: