
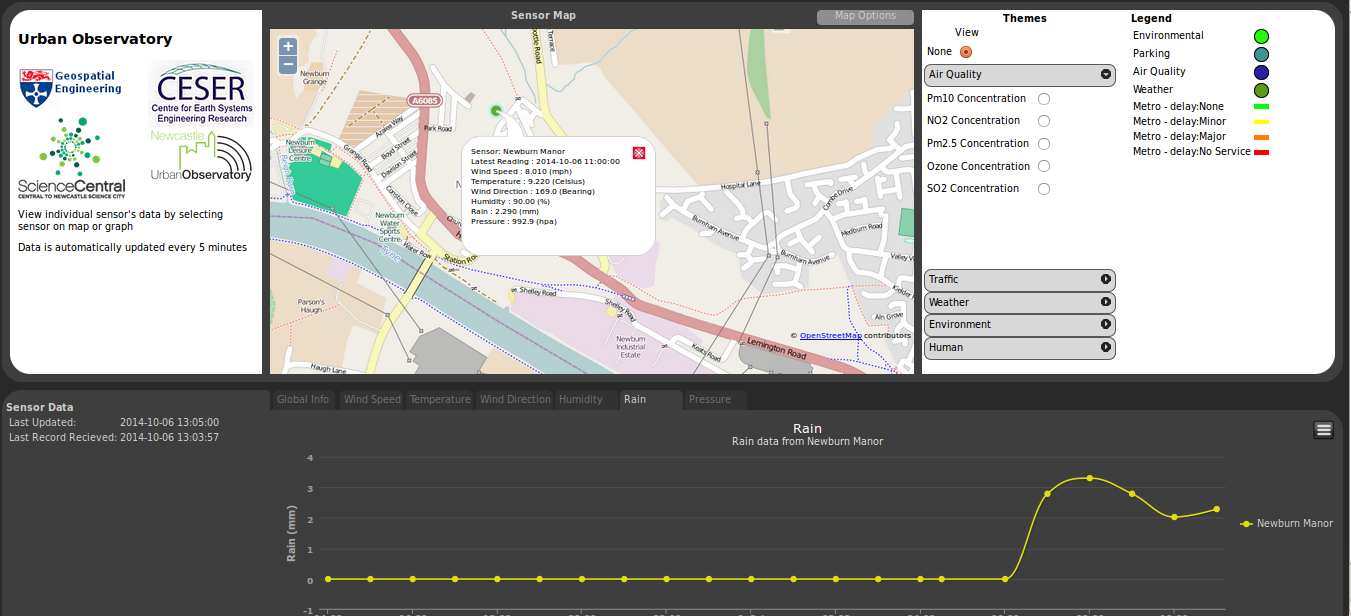
The Urban Observatory programme is deploying sensors and exploring the use of data to help inform the public about city services, and to help researchers better understand how cities work.
The data for this comes from a number of different streams and is held in a schemaless data structure. A python based middleware layer has been developed to ease the interactions with this structure. Facilitating the storing of data, the management of data and also creating different views onto the data.
It is through this middleware layer that a portal has been developed. By using django, the Python Web framework tool. That allows data to be extracted that works with a number of JavaScript libraries e.g openlayers , highcharts.
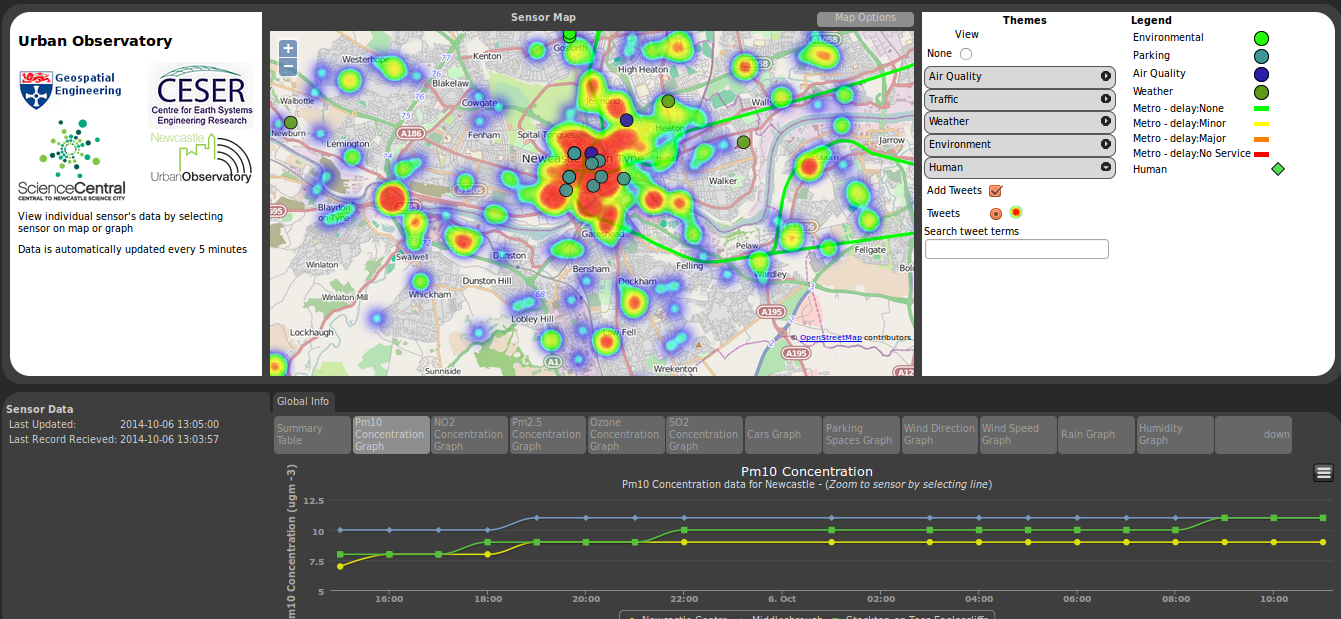
The portal itself show the location of the sensors, provides graphs of the sensor data. As well as some extra functionality like heat mapping.
 |
 |
 |
With the deployment of a wave of new sensors being planned in the next few months. You should see a few more dots appearing on this map shortly.
The portal is available http://ceg-sense.ncl.ac.uk/lturf/public/
Neil – @neil_py_harris