
Between June, 10th and 18th, 2016, I travelled to Boston in USA, for attending the NECSI (New England Complex Science Institute) 2016 summer school course, which was about general theory and models of complex science. The course was held in MIT tang center, where there was roughly thirty attendies from diverse backgrounds (economics, neurosciences, physics, biology, civil engineering, etc.). Besides those from USA, many of us came from different continents (New Zealand, Malaysia, UK, Japan, etc.), so it was rather cool to meet Francesco Castellani from same university of mine! Francesco was a very interesting Italian PhD student, who was studying urban infrastructure vulnerability and resilience against external hazards.
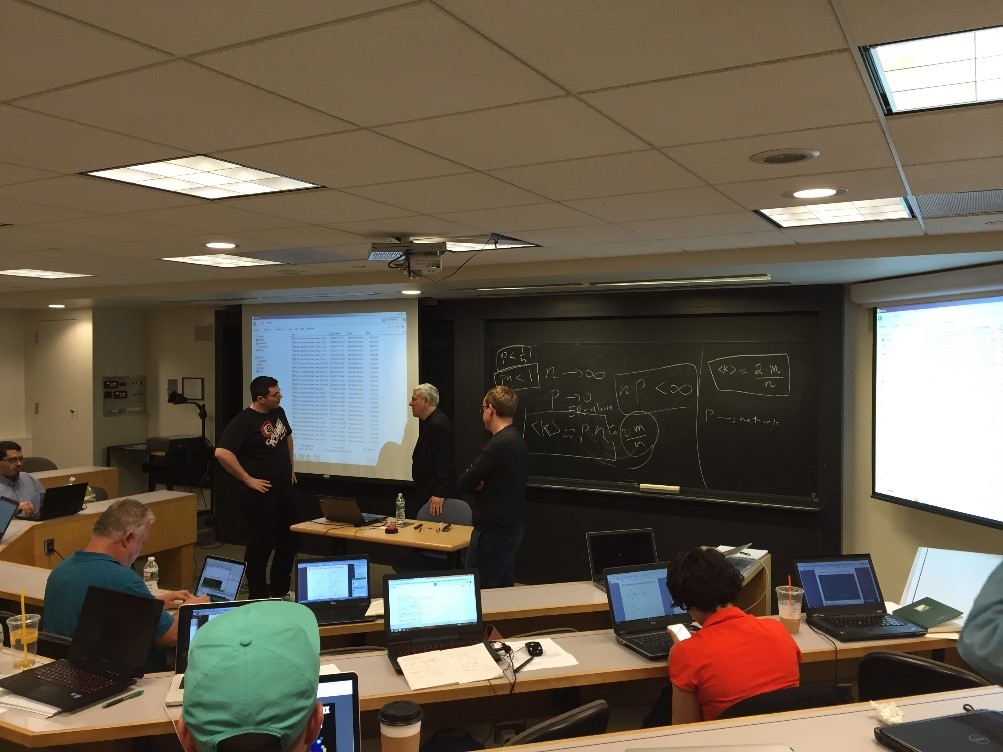
The main course lasted for four days, and was chaired by Assistant Professor Hiroki Sayama, Professor Dan Braha (Fig 1). We were introduced to the basic concepts in complex systems and some specific and most commonly used models for dealing with them, such as cellular automata, networks and agent based models.
Then Joseph Norman and Alfredo Morales joined them to show us some real life case studies (data mining and machine learning) using such models. One interesting moment during the course was about the social network analysis. Alfredo demonstrated how to listen to social media, such as twitter and to extract the user information to construct a social network in Python. All attendies were asked to register a twitter account and to tweet for any information he/she wanted using a hashtag. In the end, we got a cool social network (tweeting network) which was ready for visualization and network-related analysis (Fig 2).

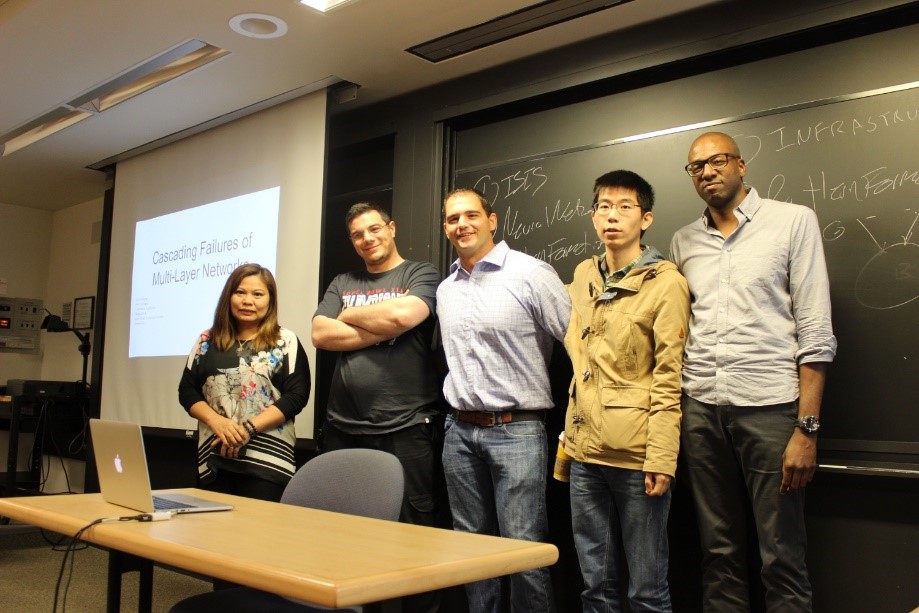
During the course, we were also required to form teams to do a project using the tools and techniques we had learned. I teamed with Cristi, Francesco, Alex and John (Fig 3) to finish an interesting project about interdependent urban infrastructure networks and the cascading failures from them to economic sectors. Francesco and I were in the urban infrastructure network research field, while Cristi, Alex and John were economic data users in their daily work. That’s why we had the idea for this project. We used a very simple model of interdependent infrastructure networks (power, water supply and telecom) and simulated different failure scenarios to model the cascading failure and its impact on the economic sectors using some economic models.
The course was short but intensive, and it was interesting to learn and team up with people from different backgrounds and with different experiences. I wish all the best for my team members in the future work and it was a pleasure to meet them.
Besides academic work
The course started on Monday, June 13th, while I arrived at Boston on Friday, June 10th, which means I was to lucky to have two free days for some adventures and sight-seeing in the city before the course!
One thing I would never forget was the extremely pleasant weather in Boston. Being at almost the same latitude of Spain created warm and sunny days during my stay there. Since it is at coastal area, there was always breeze, which is really nice in the summer. The city was highly connected by its underground train system, which made my travelling plan even easier. And let’s start!
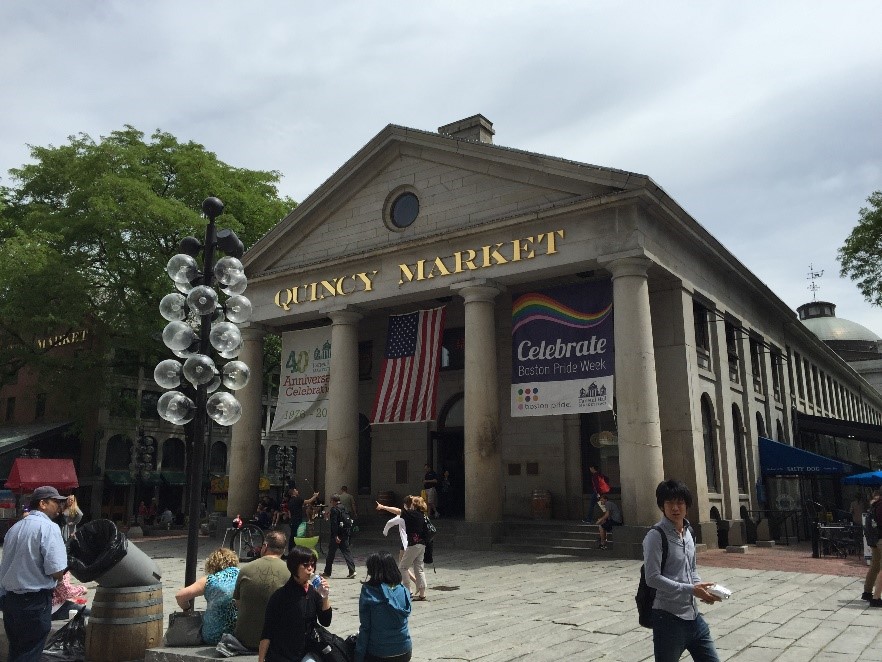
Quincy market is always the most welcome place for the first time travelers. It is a Roman style architectures (Fig 4) where there are lots of stores for fancy food and souvenirs. You can always find a place to have meals of tasty lobsters at a decent price!
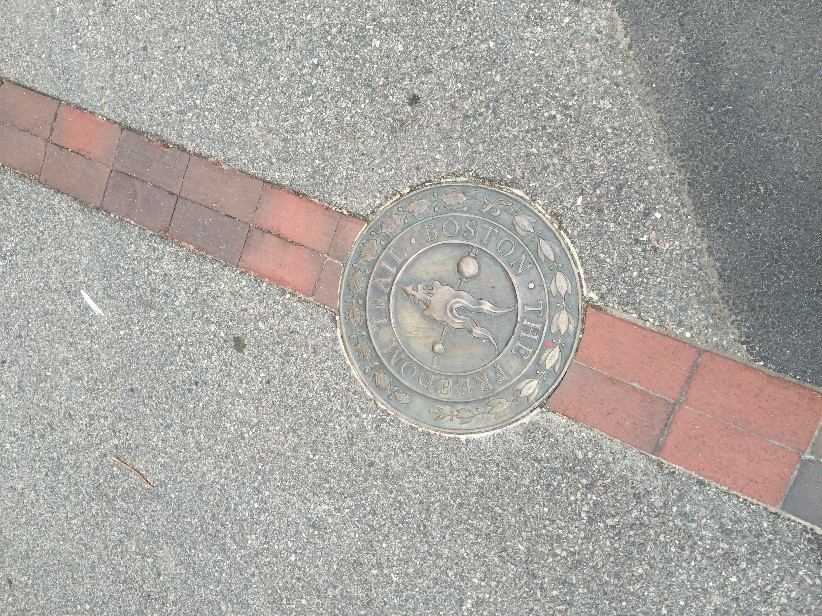
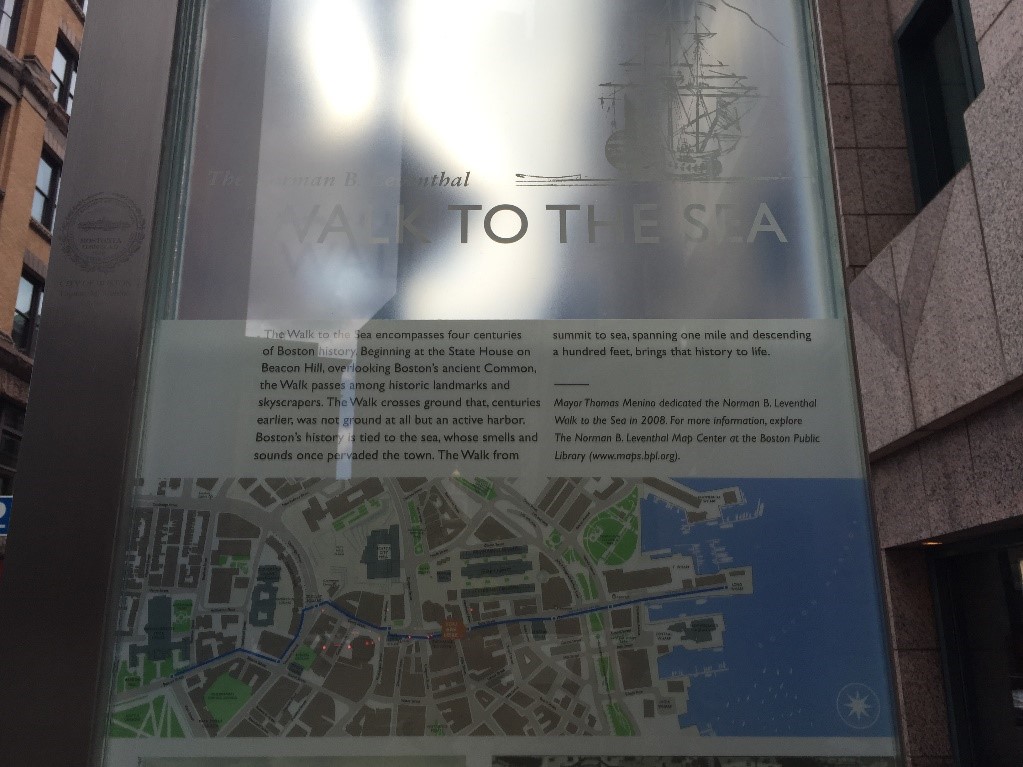
Another thing that makes Boston a little different from other US cities is its colonial history. This was the place where the British adventurers landed in the American continent, which was why this region was called “New England”. There is a very special road in the city, which is call “Trial of freedom”, it is a long route (around 5km) made of red bricks on the road (Fig 5). This trail of freedom leads to the coast, and following this road, you will see many historical architectures, which represents the colonial history of Boston (Fig 6). It was a long road, and I was lucky enough to have the time to reach the sea side following this road! (Fig 7).

Despite the exciting sightseeing, I still felt a little regret for not having enough time to explore more about city. While it is a dynamic young city (the same age of USA), it was a city mixed with modern and historical culture and architectures, and a really nice place to live. I wish I can visit this beautiful city again sometime in the future.
Thanks for reading
Qingyuan Ji