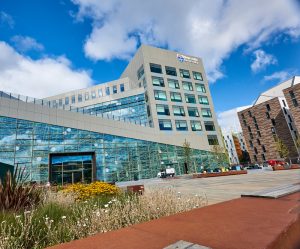
Last week we hosted the DREAM CDT (Centre for Doctoral Training in Data, Risk And Environmental Analytical Methods) Challenge Week – an event each year, which brings together the students from across the four member universities to address a set challenge based around the themes of the CDT – big data and environmental risk. This year the students were asked to ‘design and undertake an agile prototype development of a real-time spatial hazard decision support tool for Newcastle-Upon-Tyne’. Data from both the Urban Observatory and the NISMOD-DB++ (National Infrastructure Simulation and Modelling Database) was made available, as well as technical advice from staff in both teams (all part of the Geospatial Group) on accessing and using the data through their API’s.

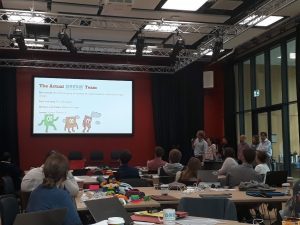
Three groups, containing a mixture of students at various stages of their PhDs, and from across the four universities, were set the challenge at lunch time on Monday, before presenting their work on the Friday morning. In between, they spent their time assessing the quality of data (and the API’s!), developing tools and models, and listening to a host of speakers – including Chris Jones from Northumbrian Water (Research and Development Manager) to staff from Newcastle University like Professors Chris Kilsby and Richard Dawson, experts in natural hazards. All groups produced some quality outputs while learning new skills along the way and becoming familar with new datasets. A summary of the work by the groups:
Group 1 – Investigated how real-time temperature data from the Urban Observatory, combined with historical data, could be used to alert emergency responders/decision makers/residents/family members of those locations where action was required when extreme temperature events appeared to be occurring. By using household characteristics data from the NISMOD-DB++ database, those communities which might be more vulnerable could be identified improving the effectiveness of the system.
Group 2 – Using real-time air pollution data from the Urban Observatory and Ordnance Survey road network data from NISMOD-DB++, the group designed and demonstrated an app which allows users to identify a route between destinations based on the exposure to air pollution and/or time. Ordnance Survey building heights data was also used, again via NISMOD-DB++, to improve the estimates of pollution levels on streets where no sensor data was available.
Group 3 – Like group 2, an app was developed to allow users to identify the least polluted routes between two locations, though this was focused on school children and had an educational element too. A user friendly interface was designed with the aim of encouraging children to learn about the harmful effects of pollution, and help identify routes from their homes to school that can help reduce their exposure risk. Again this used real-time data from the Urban Observatory as well as Ordnance Survey building and network data through NISMOD-DB++.

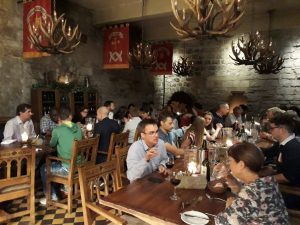
As ever, such events also involve a team bounding exercise, and on this occasion, this was a meal out in Newcastle at the Blackfriars restaurant on the Wednesday evening. With Newcastle being known as a bit of a party city, I will let you decide if the night stopped there on went on a little later into the night….

Thanks to all the students who came along and actively enagaged embracing the set challange, to all presenters for giving up thier time, and to all staff from across the four universities who attended, all of which made the event a success!
