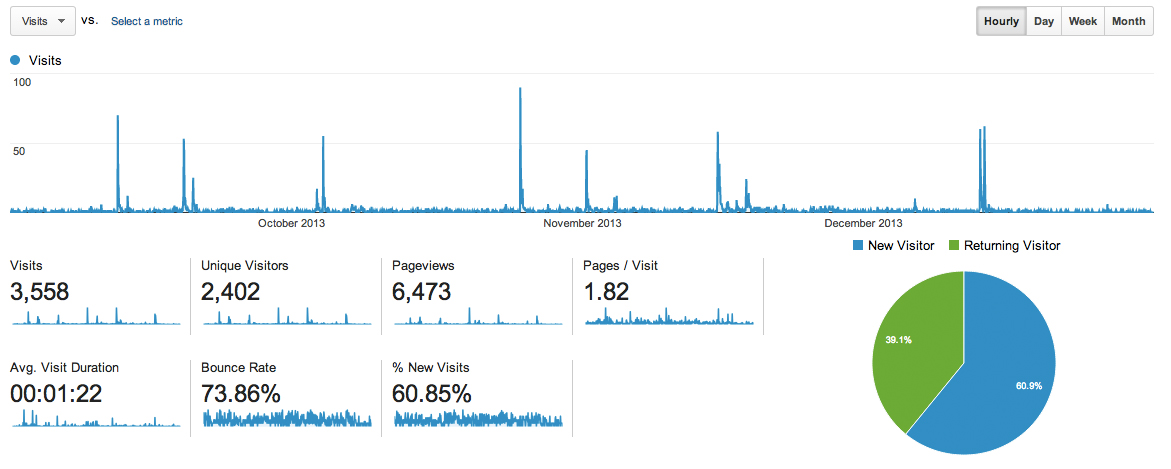
Spikes Sept – Dec Published 25 February, 2014 at 1171 × 469 in One year of the ICaMBlog in numbers Each spike on the graph represents people viewing the website when a new blog article comes out. There is an immediate response the moment we send out an email, tweet or share on Facebook. Data shown is from Sept 1st – Dec 31st, 2013