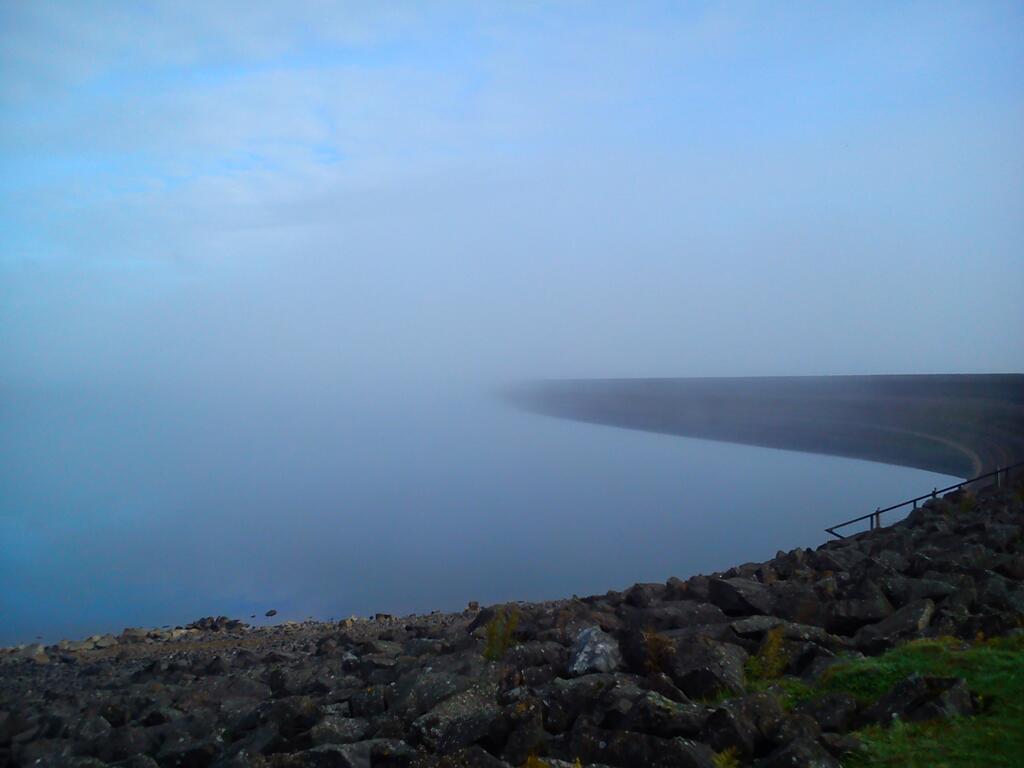
As the leaves darken and the weather worsens, the new academic year starts with a bang as 50 students go off grid in Kielder, Northumberland to develop practical mapping and analysis skills in a realistic setting.
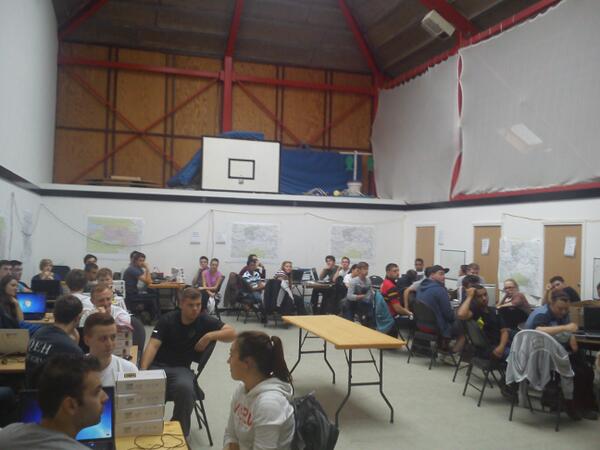
Students from our Geographical Information Science, Surveying and Mapping Science, Physical Geography and Geography programmes spend 9 days collecting and analysing geospatial data using the latest technology. We are based in the Calvert Trust Centre on the shores of Kielder Water surrounded by trees, midges and (well that’s about it…)
A fully networked geospatial gym!
Halfway through the fieldcourse, our students are “in the groove” , occasionally hampered by tricky conditions! Students carry out a mix of detailed topographic survey tasks, DEM creation, Landuse mapping using remote sensed imagery and planning a new residential development site. We are very grateful to the landowners and people of the Kielder valley who make us welcome each year. So far, the torrential downpours of 2012 have been absent and conditions have been more benign, but there is time yet…
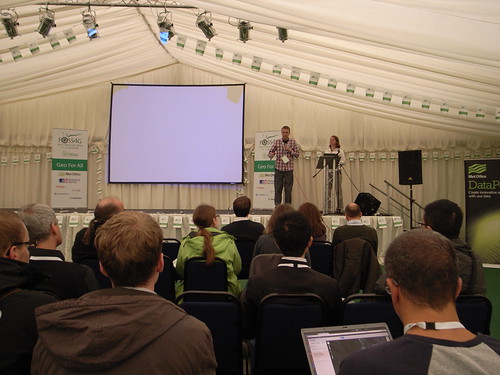
From the 18th to 21st September Phil James and I attended FOSS4G 2013 (Free and Open Source Software 4 Geospatial) in Nottingham. The conference kick started on the Wednesday evening with an Ice-breaker event featuring a pub-quiz following by a light-hearted talk given by Mike Parker, the author of Map Addict. The talk was very enjoyable but the quiz proved somewhat challenging and my sole contribution to my team’s effort being that I knew which animal Friar Tuck is in the Disney Robin Hood. He’s a badger.
The conference then truly came to life over the next two days with some great keynote talks. Particular highlights being Chris Tucker from MapStory.org, Tim Sutton from QGIS and Paul Ramsey from POSTGIS who’s sermon on being an open source citizen was one of the best talks I’ve ever been to. These were interspersed with a great selection of talks (some of which are available here ) showing the uses of software as well as outlining releases of new software such as the OpenLayers 3 which looks very exciting.
The conference was also complimented brilliantly with some great evening events featuring comedy, music and drinks. I would like to thank Steven Feldman and all of the FOSS4G heroes for putting on what was a thoroughly enjoyable event
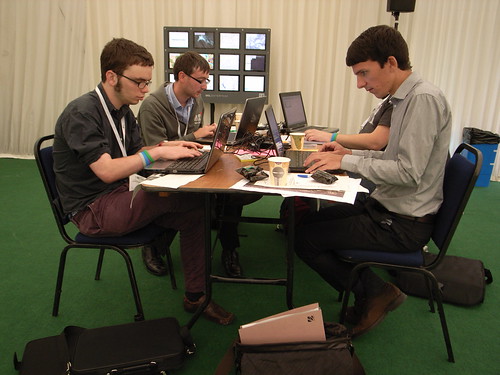
From the 17th-18th of September I attended the Geohack event at FOSS4G conference in Nottingham. The event was sponsored by the MetOffice in partnerships with many other of organizations within Environmental Science to Services Partnership. A number of challenges were presented for hackers to work on, these are listed here http://2013.foss4g.org/geohack/challenges/ . As part of the LTURF project I have found myself working with a number of APIs trying to extract any information for around Newcastle. This lead me to picking the outdoor event challenge as it was making use of several APIs http://2013.foss4g.org/geohack/challenges/events/ .
This aim of this challenge was to estimate the effect that weather has on outdoor events in the UK. The first task was to retrieve information about any outdoor events happening in a given location. This was achieved by using the skiddle.com, an events listing website, and their API. Which allows you to search for events planned using a point and a buffer. Once we had the events the next goal was to gain an estimate of the number of people attending each event. This task was assigned to me, and for this I used both the Facebook and the twitter APIs. With Facebook returning the numbers of attending and maybe responses to the event, and twitter returning a popularity score. The final step was to use Met Office DataPoint API to get the weather forecast of the event. These were then all integrated into a very simple web portal. This is live here , we had little over 24 hours to complete this task so the portal is very much substance over style.
At 1pm on the second day everybody had to stop developing and then present they work for it to be judged. It was very interesting to see what the other groups had achieved , with some of the achievements being very impressive given the amount of development time. Phonegap, which is a free and open source framework that allows you to create mobile apps using standardized web APIs across many platforms, was used by a number of groups. And is clearly a very powerful tool with some groups having a completed app developed in just 24 hours. Unfortunately my group didn’t finish in the top 3 which I’m certain is only because the complexity of our app was hidden, in short we lost because it was too good.
The event was brilliantly run with plenty of food, drink and electricity to go round and I would like to thank the members of the Met office and the foss4g volunteers for organizing the event. And Also Steven Citron-Pousty who setup the OpenShift server for our app.
As part of the British Science Festival 2013 being hosted at Newcastle University, researchers, staff, lecturers and students were invited to contribute to a comic being developed and designed by local comic enthusiasts. The comic was officially targeting children between the ages of 8-13, with a view to promoting STEM subjects and science in general. The proposed content of the comic had, you guessed it, a distinctly scientific theme to it, with organisers interested in hearing from those staff members who could fit their work (or at least make it look like their work fits) in to one of the following themes:
Robots
Explosions and danger
Dinosaurs
Space, time and travel
Very big and very small things
Things we eat, and things that eat us
Codes, ciphers and hidden messages
Heroes and villains
Matters of life and death
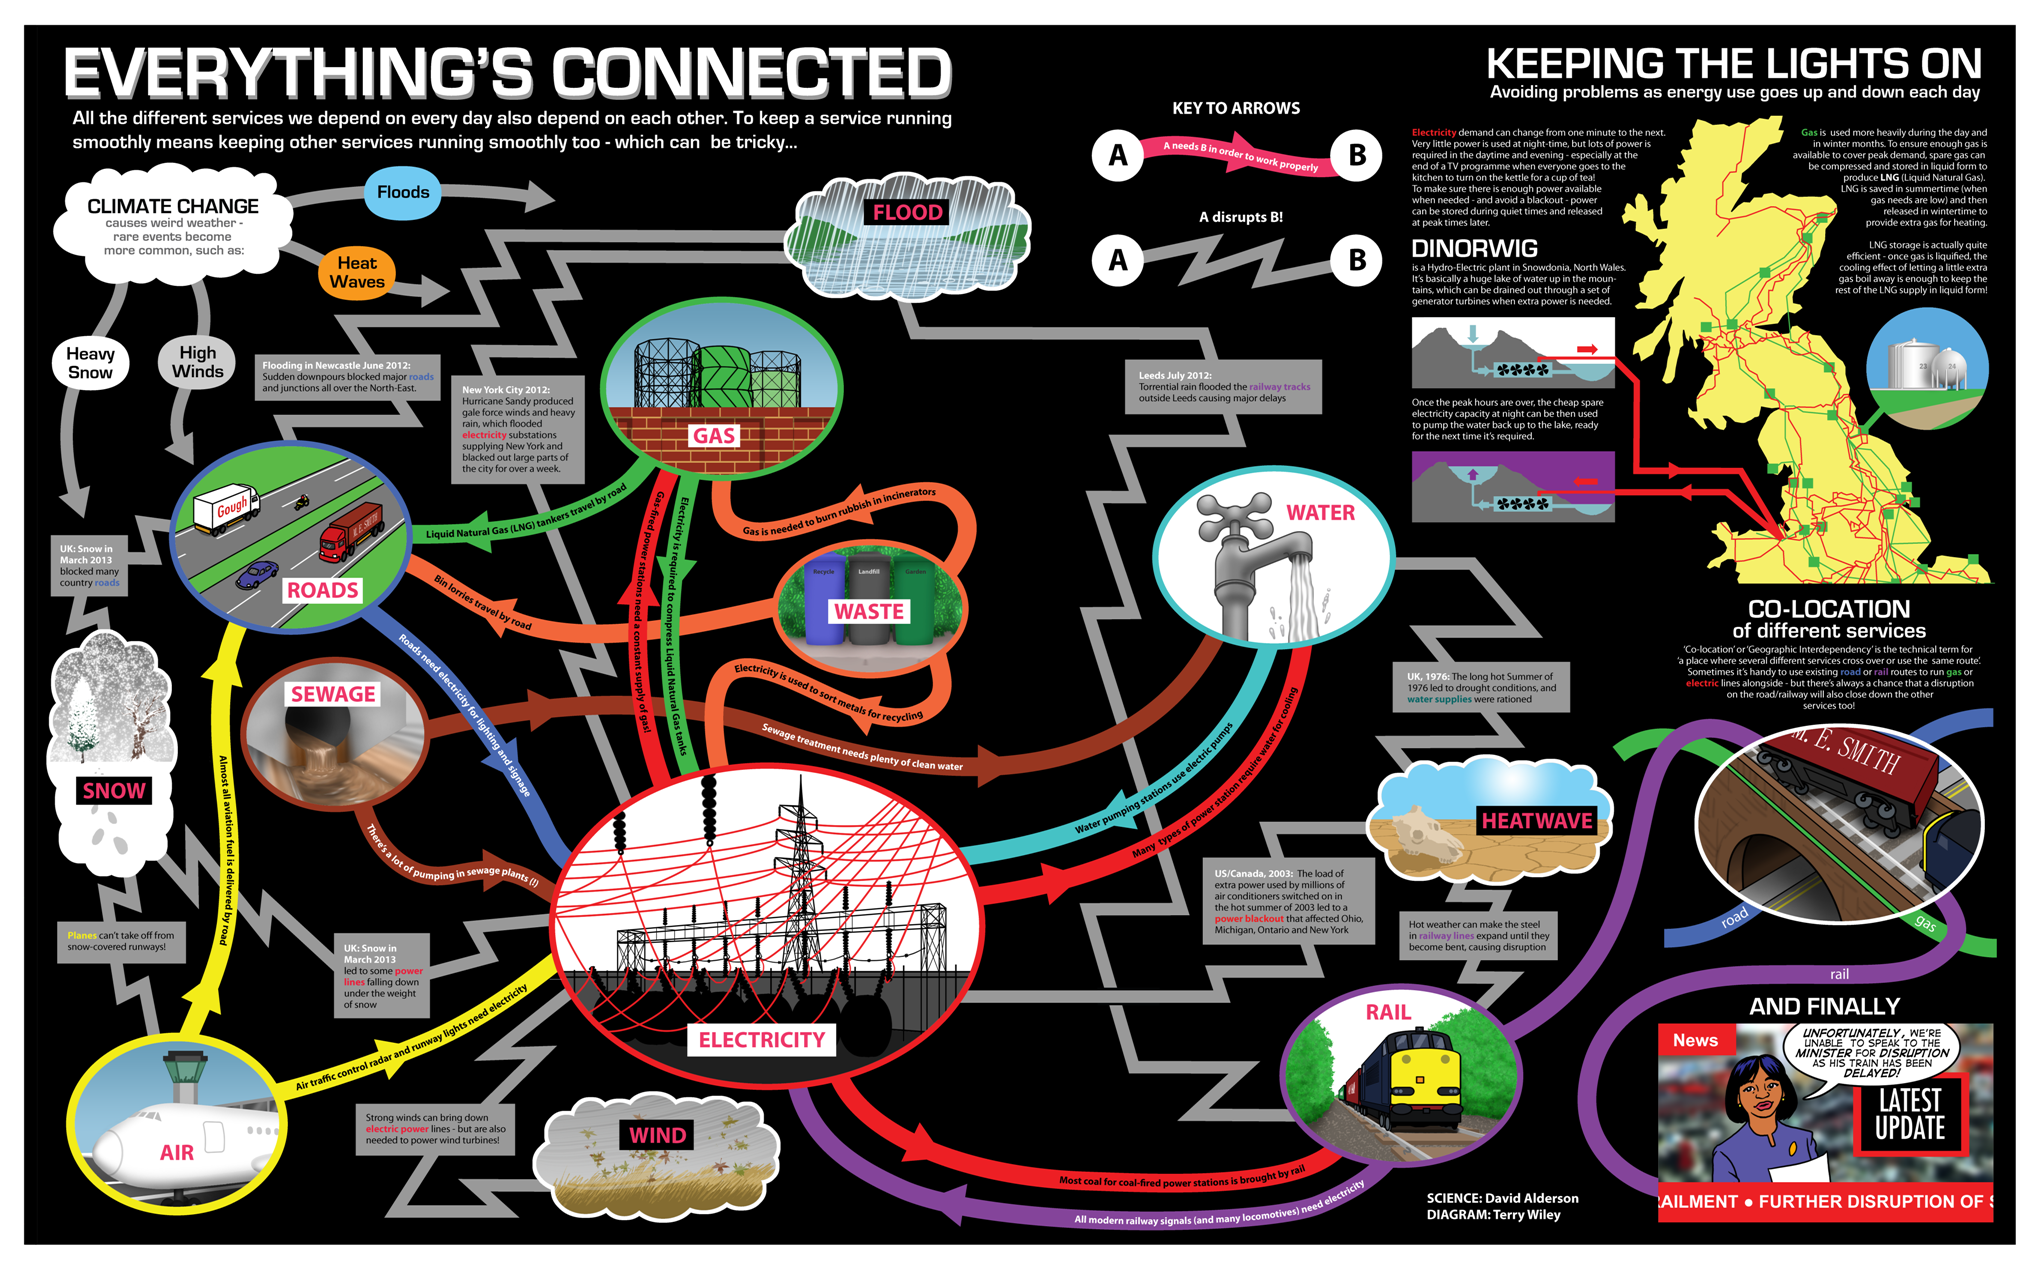
Some of the work related to networks, connectivity and infrastructure that is currently being conducted within the context of the Infrastructure Transitions Research Consortium (ITRC – www.itrc.org.uk) and also within the School of Civil Engineering and Geosciences, seemed like something that kids could be interested in, and the idea of presenting this type of work within a comic context offered an alternative and novel mechanism for communicating our research. Once an expression of interest in contributing to the comic had been lodged, it was simply a case of meeting an artist and writer assigned by the organising committee, and beginning to think about what a comic to represent networks, connectivity and infrastructure should look like! In fact, largely due to the expertise and imagination of the artist I had been assigned (Terry Wiley), the ideas began to come together, and rather than stick to the traditional panel-based approach we decided on more of a spider diagram affair to communicate how different bits of infrastructure are connected together. However I still wish we had managed to get our idea of slightly transparent paper with networks hidden until the page was held up to the light, to fly to communicate the idea of hidden or non-obvious connections! Oh well, maybe next time. For all those interested, the comic, entitled “Asteroid Belter”, in hard copy format was distributed at the British Science Festival 2013 (7th-12th September), but more information about it can be found here.
The sessions began with Dr Parkin delivering a brief summary of some of the causes of flooding and extreme flooding, citing many references that relate to flood events experienced in recent years within the UK, including those that occurred in Cumbria in 2005, Tyne and Wear in 2008 and 2012, and many others. However that was just the standard “in-class” part of the activity, and although the seminar generated interest from the students in such topics as the water cycle, climate change, global warming, and the impacts of flooding, the “really” interesting part came when the children were let loose outside on the University campus, to take part in a crowd-sourcing exercise.
Crowd-sourcing in it’s most simple terms involves members of the public contributing data, information, comments, stories, pictures etc, which are then subsequently used within some form of analysis. Within the School of Civil Engineering and Geosciences, there has been a concerted effort since the flooding in a local market town, Morpeth, in 2008, by water and geomatics researchers and lecturers alike to collect as much crowd-sourced based information about flooding and flood events that occur within the region. The contributions from the general public about the locations and timings of floods, alongside photography giving a reasonable indication of flood depths, levels and wrack lines, can be used to validate computer simulations of flood models, developed within the School. Some of the results of these crowd-sourcing endeavours can be found here.
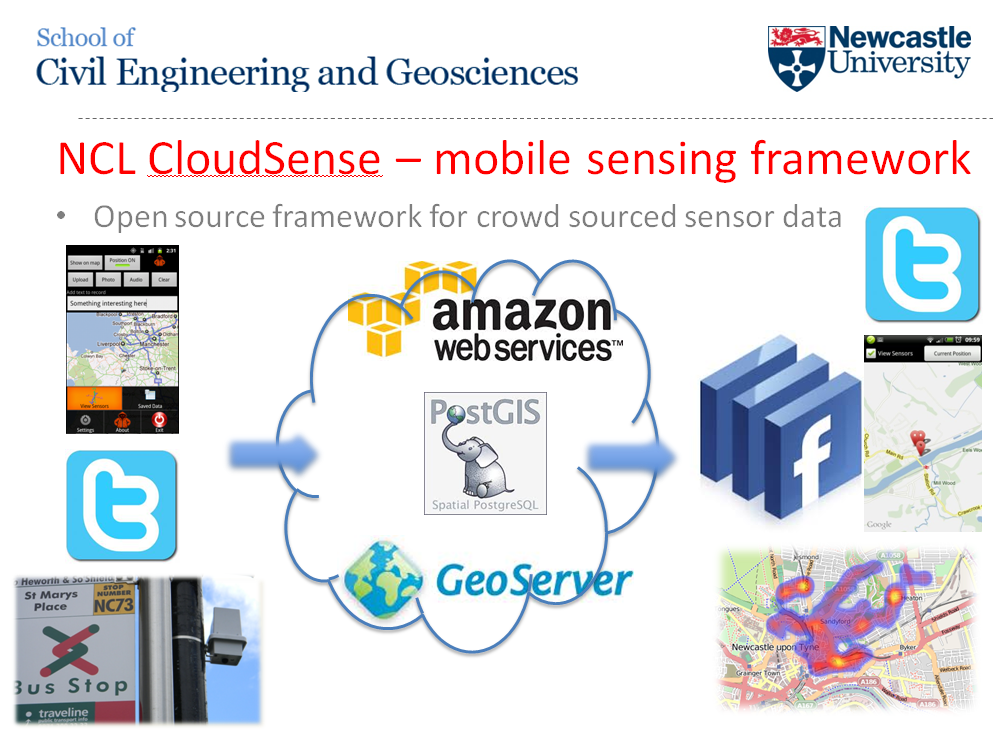
So the purpose of crowd-sourcing in the context of flooding was explained to the students in attendance at the Blueline event, and how it can be used to help better understand how a flood propagates through different environments. Since the floods in 2008 and 2012, Philip James has developed an Android-compatible “app” that helps to facilitate this process, by allowing a user to use the location technologies within an Android device (tablet, smart phone etc) to locate themselves, and then subsequently use the camera to take a picture. The great thing about the app is that this data can then be sent to a server and published immediately onto a website, giving a near-real time record and subsequent archive of a flood event. As stated, this type of data is invaluable to understanding how a flood arises and then subsides. For more information about the app and the technologies employed to deliver this solution, have a look here.
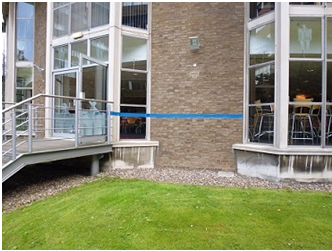
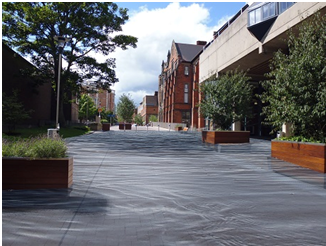
So the school children were escorted outside where a “pretend” flood had been erected around Newcastle University campus (effectively just a line of blue tape indicating a flood level based on a particular amount of rainfall), and asked to use the app and a tape measure to record information about the depth of this “flood”. This seemed to go down a storm (sorry) as it offered them a chance to do all the things that children seemingly would rather be doing i.e. being outside and playing with technology! Each pairing were asked to try to record at least one reading at each point where we stopped around campus. Further to this a series of QR codes had been erected along the blue line that the students were able to scan, subsequently directing them to a site of historical photography of the flooding that occurred on campus in 2012, as well as some “constructed” imagery of the imaginary flood that they were measuring. For more information on this site and the photos, please follow this link.