Landslide monitoring with UAV-based approach requires regular imagery acquisition at Hollin Hill British Geological Survey (BGS) observatory site, North Yorkshire. The attached UAV image reveals the progading lobe, intermediate scarps and other landslide features.
The main purpose of this work is to detect the surface change and the landslide velocity field by combining surface matching algorithm and image correlation techniques with UAV-derived mutli-temporal DTMs.
So, last Monday (15/12/2014) was a successful day of the final UAV data collection for the year 2014 at Hollin Hill, UAV flying, terrestrial laser scanning and surveying … we are happy!
We are ready for more UAV flying next year. Best wishes from the Newcastle UAV crew.
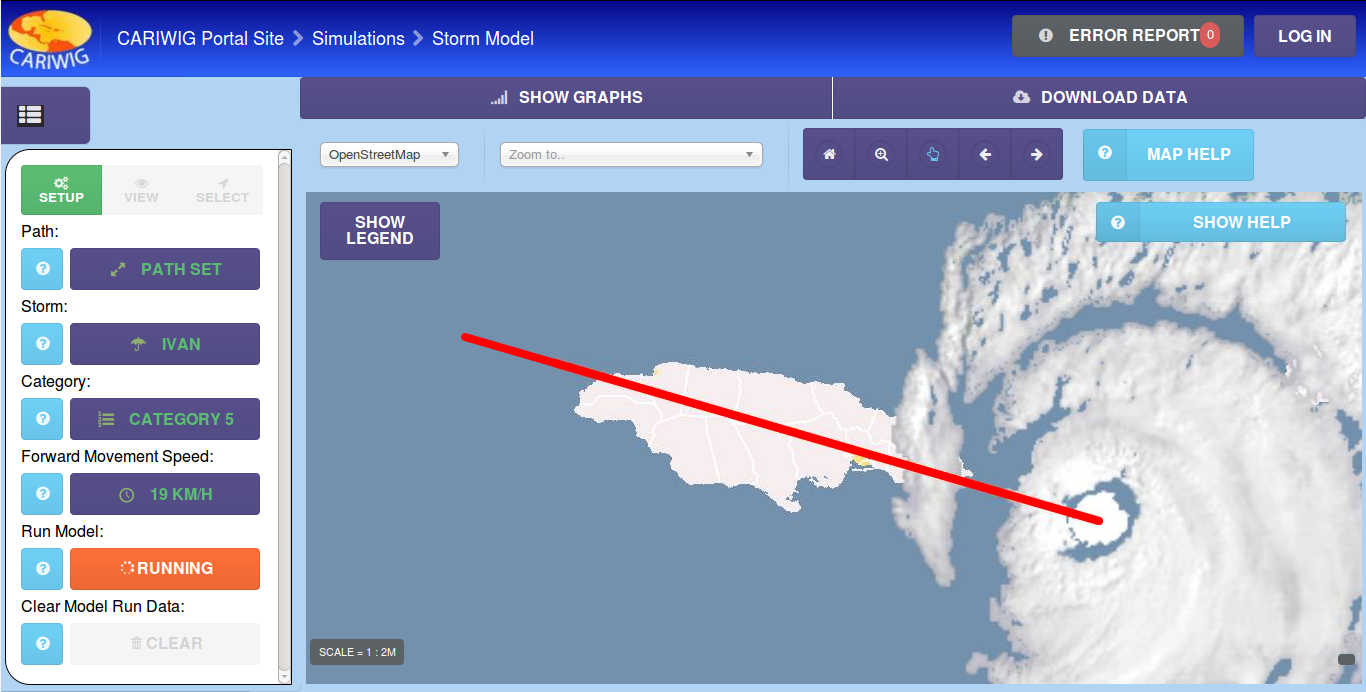
From the 1st – 3rd of December I visited a very sunny Grenada attending the 10th anniversary of Ivan symposium. This looked at the lessons learnt from the fallout of hurricane Ivan across the Caribbean region and how different sectors could help to prevent a future hurricane having a similar affect. I was there representing the CARIWIG project, along with Professor Michael Taylor and Jayaka Campbell from UWI, Jamaica. Michael Taylor brilliantly outlined the project and demonstrated elements of the portal site that I have been putting together over the past year. The presentation was very well received with myself and Jayaka Campbell being asked to demo the storm model element of the portal to a number of delegates.
The CARIWIG portal site is likely to go live following a workshop event in February so watch this space for more details.
CARIWIG Storm tool
I would like to thank the members of of CDEMA for putting on this event, the conference was well run and contained many interesting talks about hurricane Ivan, including a opening address from the Prime minister of Grenada, as well as plenty of Caribbean food as lunch times. Plus December in Grenada beats December in the north east of England
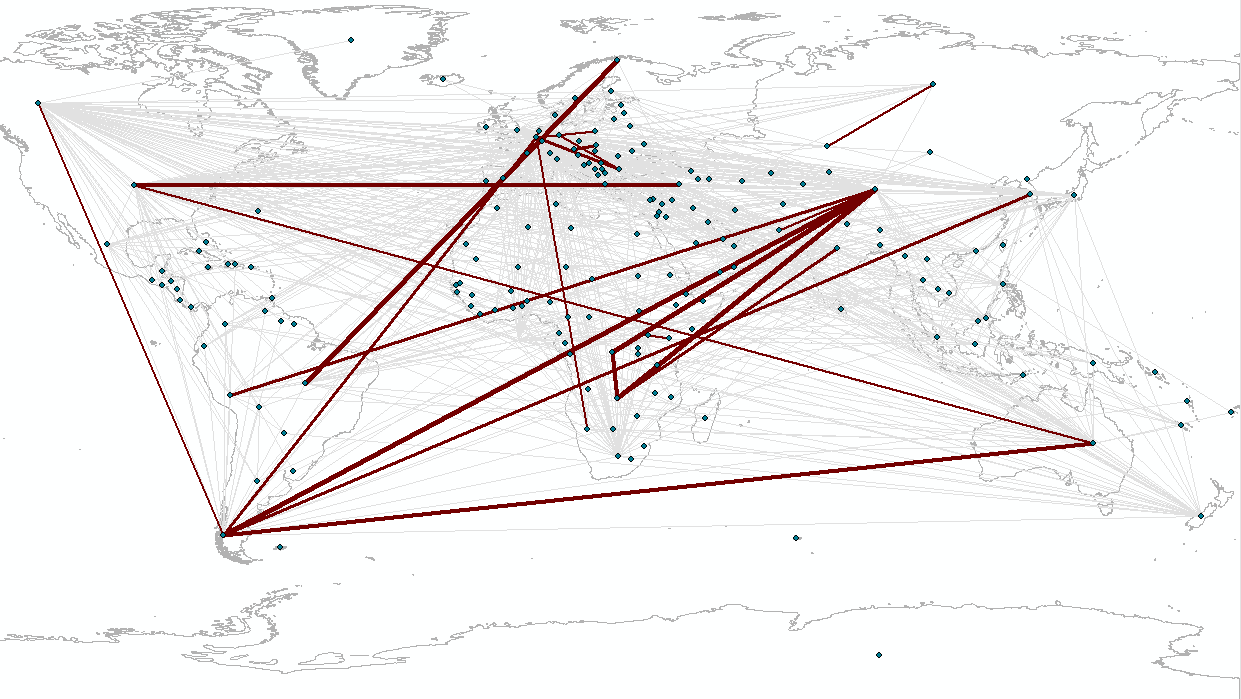
Working with colleagues Ali Ford, Oliver Heidrich, and David Manning on various papers and proposals, we have started to pull together a Sankey diagram of the reported tonnages of cobalt in 2012 through various processing stages within its life cycle. The orange and green colours denote the quantities of cobalt reported by the respective importing or exporting countries, but we have aggregated to the continent level. This information was extracted from the UN COMTRADE database and linked to eSankey! software via an intermediate Excel spreadsheet. The good thing about this approach is that by updating the spreadsheet with new values e.g. for different years etc, or for different elements/commodities/products, we can auto-generate (ish) the Sankey diagram.
Source: Cobalt, 2012, DESA/UNSD, United Nations COMTRADE Database
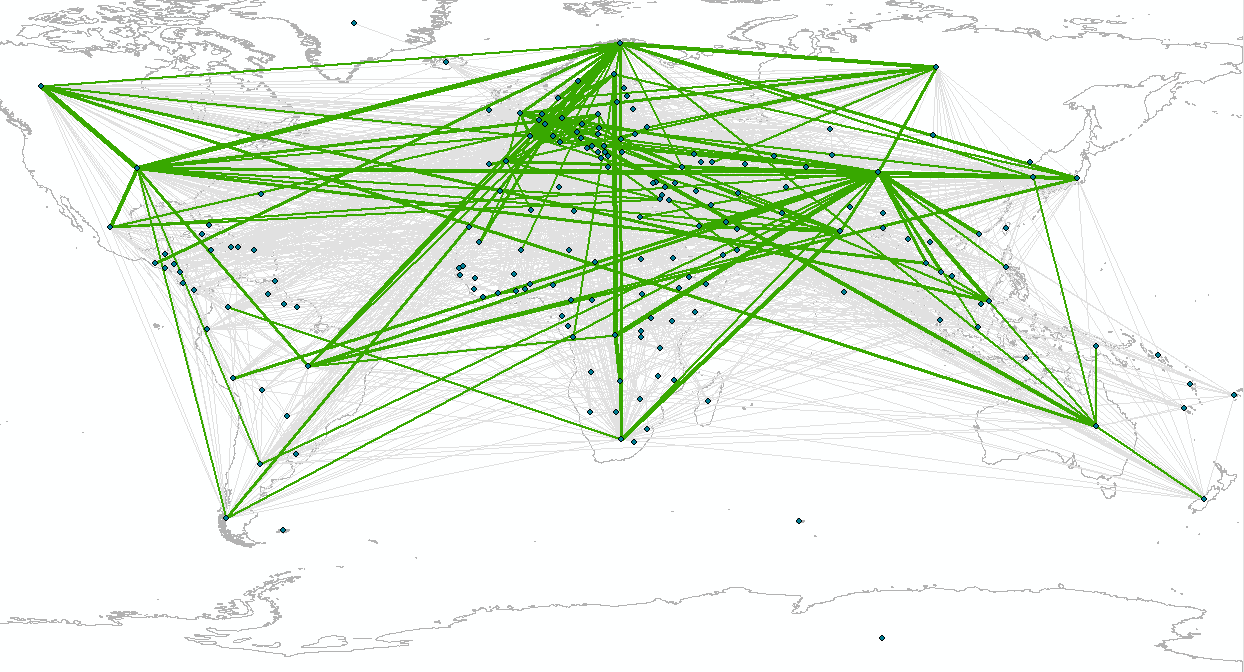
Going even further, Ali reproduced the data above at the country-level, across the same three stages i.e. Mining->Refining; Refining->Manufacturing; Manufacturing->Use, but using only the import flow data for now (matches orange flows above)
Source: Cobalt, 2012, DESA/UNSD, United Nations COMTRADE Database – Mining to Refining imports only
Source: Cobalt, 2012, DESA/UNSD, United Nations COMTRADE Database – Refining to Manufacturing imports only
Source: Cobalt, 2012, DESA/UNSD, United Nations COMTRADE Database – Manufacturing to Use imports only
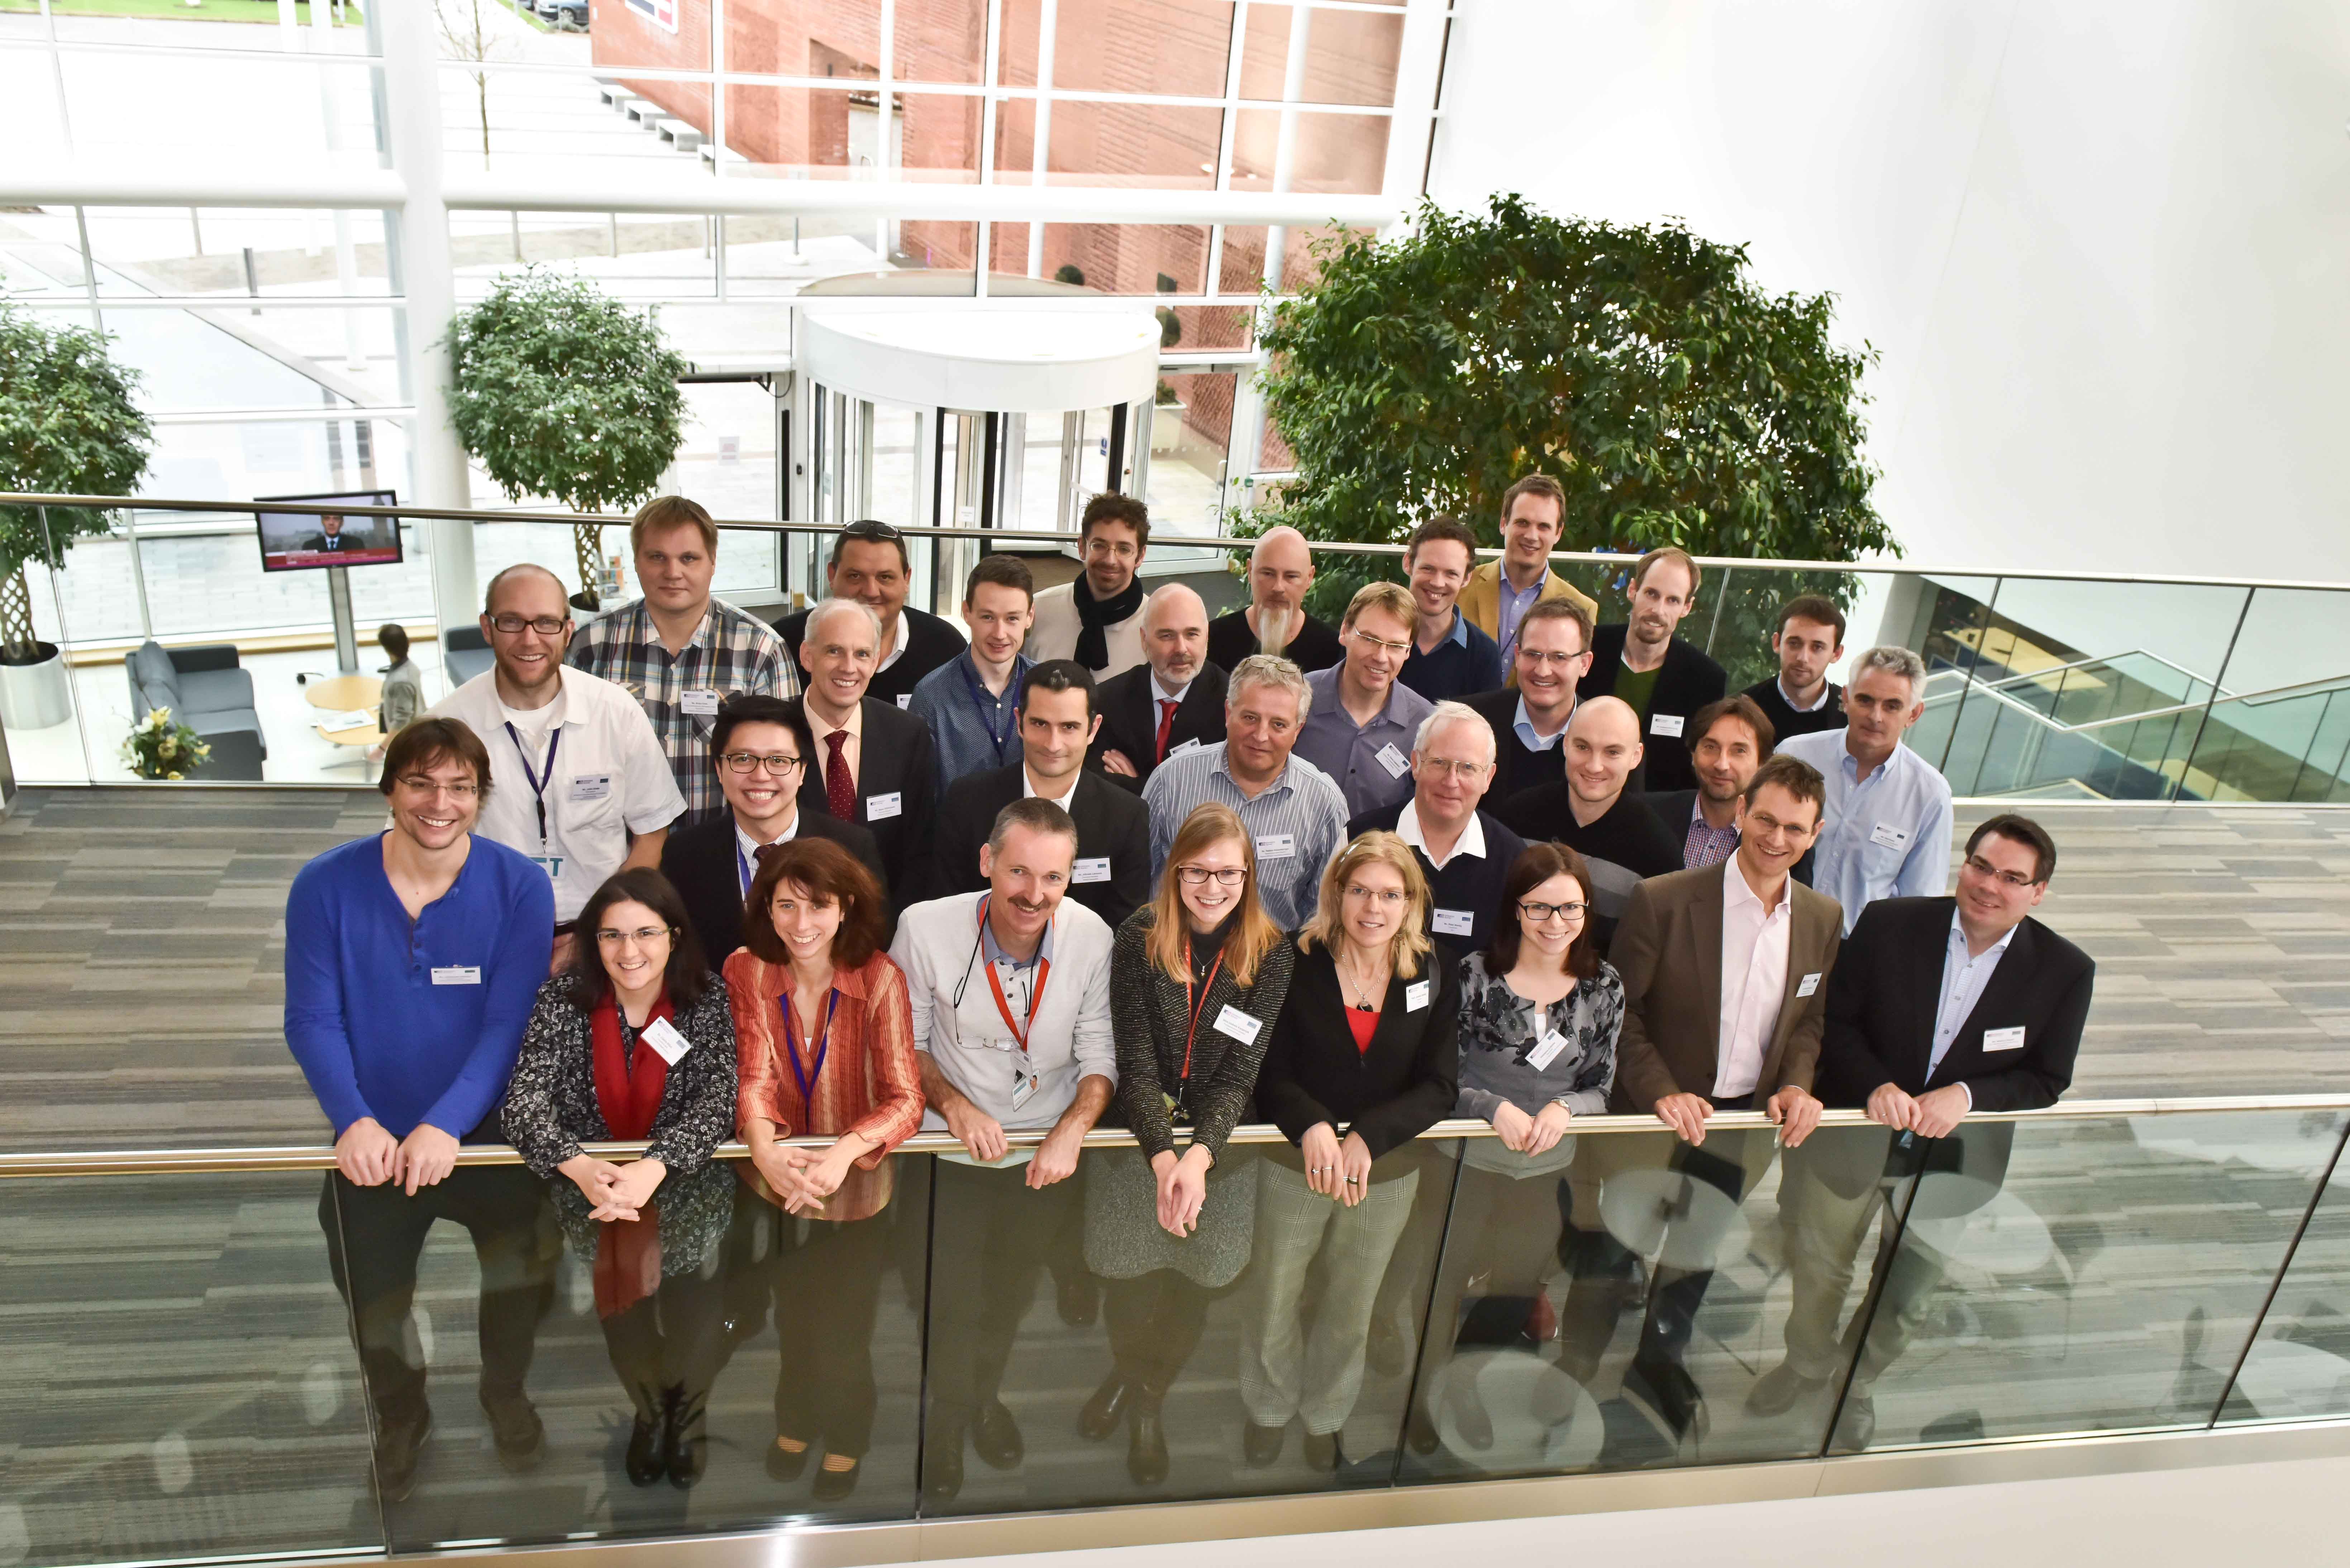
Last Thursday and Friday (27th – 28th November) saw the joint European Spatial Data Research (EuroSDR) and International Society of Photogrammetry and Remote Sensing (ISPRS) ‘Workshop for capturing national scale 3D models’. Hosted at Ordnance Survey, Southampton, the workshop brought national mapping agencies, industry vendors and research scientists together to discuss all things 3D including the storage of 3D data (Hans Veihmann, Oracle) and making building models look more realistic with automatic texturing (Gerald Forkter, UVM Systems Gmbh).
Several presentations were given through the duration of the workshop, including those from the three Ordnance Survey funded PhD students focusing on 3D modelling. Firstly, Jon Slade, Cardiff University, presented methods of adding semantic and geometric information to a 3D model using imagery from repositories such as Flickr. I then presented my research on automatic 3D reconstruction from multi-ray photogrammetry, with the slides available here. Kelvin Wong, University College London, presented some preliminary results of an experiment to determine which parts of buildings people look at whilst navigating to determine what users may require from 3D models.
Examples of where national scale 3D models have been implemented were presented. Sander Oude Elberink, University of Twente, presented a case study of how part of his PhD research is being implemented by the Dutch Kadaster. Building footprints are extruded to a height calculated from lidar point clouds to produce a 3D national dataset. Height are also applied to roads, bridges and water bodies. Similar work is being undertaken by Ordnance Survey, presented by Isabel Sargent, by applying height attributes to OS MasterMap building footprints for the base of the building and various parts of the roof. This is currently available as an alpha release. Other research being undertaken includes automatic classification of roof structures using machine learning and clustering, as well as the research being undertaken by the PhD students listed above.
A series of breakaway groups were formed during the workshop to discuss matters such as the management of 3D data, what 3D editing tools need to be applicable, and the best approach to creating 3D models: whether this be developed from existing 2D datasets or to start data capture and production as a new process. Whilst no formal answers were concluded, these matters are to be further discussed and developed as part of the special interest group (SIG) and presented at the next workshop meeting, to be held in March 2015. One topic is to determine what are the potential economic benefits of national and regional 3D models by answering the following questions;
What is defined as a regional or national dataset? What is defined as 3D?
What added value does a national or regional 3D dataset have over local and project-based datasets?
What are the economic benefits of 3D data, if any, gained from this level of extended coverage?
What business opportunities can be realised through the application of 3D data at a national level?
Beyond technical challenges, what are the additional problems that NMAs face at this level of coverage?
This research is being fronted by Kelvin Wong, who requires participants to undertaken a short interview. If you would like to take part in this research please email kelvin.wong.11@ucl.ac.uk.
Thanks go to Rollo Home and Jantien Stoter for the hosting and organisation of the workshop. The points raised in this workshop led to many discussions and opinions, which hopefully may become closer to being solved by the next meeting in March 2015. Information on the SIG can be found at http://www.eurosdr.net/research/project/eurosdr-special-interest-group-3d-3d-sig
Photo of the delegates from the EuroSDR 3D workshop at Ordnance Survey, Southampton