ESRI UK User Conference Tuesday 17 May

This year’s ESRI Annual Conference took place once more in the QEII Conference Centre in the heart of Westminster.  It was good to meet up with several Newcastle graduates, each making their mark on the GI industry.  The major ‘take-away message’ from this year’s conference was the increasing ease by which the traditionally ‘clunky’ ArcGIS desktop can be left behind in favour of developing using ArcGIS Pro and ArcGIS Online, products with regular and frequent update cycles and increasingly comprehensive functionality.

From the perspective of ESRI, David Rix (1976 graduate) and Dominic Stubbins (1995) were amongst the welcoming corporate hosts, contributing to an efficiently-run and informative event, well worth the trip from the north!  Nathan Ward (1993) was manning the Leica stall, one of several associated partners exhibiting in the building.  Laura Hanson (2003 graduate), now with Arup, and Rachel Oldroyd (2011 graduate), now with the University of Leeds, were ex-staff members spotted, along with Meredith Williams (staff 2000-2010).

Joining Dominic from the 1995 cohort was Ian Moodie, whilst from even further even back, Rob Knight and Helen Durham (both 1985) are both thriving.  Clive Surman-Wells (1988) and Andy Hopkins (1996) made their presence known also, along with some 21st century graduates – Bruce Ford (2009), Claire Watkins (2009), Victoria Short and Matt Bowerbank (2010), Matthew Bierton (2014) and Jonathan Hallam (2015).

Next week, the re-unions will continue in London at the GeoBusiness event.  There is a formal Newcastle alumni meeting on Tuesday 24 May at 15:00 hrs.  Come along to the Business Design Centre in Islington, if you are in town …

GIS students present research projects Friday 13 May

This week saw the annual ‘Final Year Conference’, the showcase for the Stage 3 Geomatics students to present their dissertation research in a formal venue to their fellow students and to the staff and postgraduates in the School.  A total of 31 Newcastle Geomatics students delivered talks in two parallel tracks with themed session titles including ‘Built Environment’, Spatial Analysis’ and ‘Geovisualisation’.  The 12 final-year Geographic Information Science students’ topics were as follows:

Nada Alabdulwahed used an impressive range of satellite remote sensing imagery from the past 20 years to track the urban development of the city of Al Khobar in eastern Saudi Arabia.  Standard image analysis and classification techniques along with ground truthing and integration with other data on population and land reclamation allowed for accurate quantification of urban growth.

Ed Drummond-Hay researched house price changes across England and Wales, using millions of records from Land Registry, ONS and commercial sources.  His hypothesis was that house price increases in London ‘rippled’ out from the capital to affect the rest of the country after a time lag.  The dynamic and animated representation of such patterns was an important part of the output from Ed’s research.

Emmanuel Egunyu aimed to create an online website resource to promote tourism in his native Uganda.  Using OpenStreetMap data and open source technologies with PostGIS and Geoserver, he reported on the creation of a map-based information portal for those planning to visit national parks and view wildlife in this country.

Alexia Fenn’s study concentrated on the validity and reliability of observations from GPS receivers worn by athletes.  A variation of sport/athletics course shapes, course distances, and exercise/movement intensities were examined.  Walking, jogging, and sprinting over various distances and in a variety of course configurations were examined, with GPS accuracies determined for each exercise regime.

Will Franklin developed a system to estimate the safety of junctions on the road network in Newcastle.  By calculating a Junction Risk Factor, based on a number of parameters related to road conditions and traffic volumes, he was able to develop a predictive model to determine the optimum location for investment in road network improvements.

Jo Gallagher’s interest in spatially-enabled Twitter data led to a study of the geolocation of football clubs’ fan base.  He found that the ‘bigger’ the club, the more dispersed the distribution of fans – backing up the popular theory that the mean location of a Manchester United fan is some distance from Old Trafford.

Patryck Janicki’s research aimed to develop a geodatabase schema able to hold both CityGML data at Level of Detail 1 and main Industry Foundation Classes (IFC) classes.  The ability of the schema to abide by standards, allow for SQL queries, hold geometry effectively, was to be supplemented by an effective visualisation flowline through export to QGIS.  The outcomes of this project have impact on the integration of BIM with GIS.

This was also the focus of the research of Anthony Morley, who examined current technologies for importing a BIM model into a geospatial environment and assessing interoperability.  This involved using a range of software and data formats, including ArcMap, ArcScene, ESRI City Engine, REVIT, AutoCAD and FME.  The geometric and semantic integrity of the model, and the needs of users were considered.

Amber Kaye-Kenyon chose the analytical capabilities of ArcMap, ArcScene and City Engine (including Buffer, Viewshed and Line of Sight (LOS)) to look at the modelling of an urban sensor network.  In the context of the instrumented city concepts being developed in Newcastle upon Tyne, particularly around the university’s new Science Central campus, ease of use, visualisation and effective monitoring of the sensor network were derived.

Ben Nicholls undertook a very detailed study of some of the rich cartographic generalisation tools in ArcGIS.  Applying these to different types of feature (railways, contours, buildings etc. as represented on large scale Ordnance Survey data), and in different locations (e.g. central urban zones, rural regions), Ben presented an impressive assessment of the data pre-processing, algorithm effectiveness and presentation quality of such procedures.

Josh Watson’s theme was a big data set dealing with cardiac arrests outside hospital.  The spatial and temporal distribution of these events was determined, as a precursor to understanding the nature of the phenomenon and to try to raise low survival rates in the North East.  Clusters of cases were apparent and these were linked to population distribution, to ambulance stations and response times, and to times of day, season and year.

Imogen Weight made a comparative study of several web mapping APIs, assessing data needs, scope of functionality, usability, and final appearance of maps created in Leaflet, Mapbox, and the dedicated Javascript APIs for Google Maps and for ArcGIS.

The remaining students (Surveying and Mapping Science students) pursued research topics in a wide range of other spatial themes, many of which have a GIS ‘flavour’.  Environmental monitoring of coasts, glaciers, urban heat, and floods used GIS tools, as did further investigations of BIM, and further social investigations of education from a GI perspective.

Inaugural QGIS northern group meeting

A group of us attended the inaugural QGIS northern group meeting, kindly organised and hosted by Seraphim Alvanides at Northumbria University. The meeting focused on the use of QGIS in teaching at university level followed by a broader session on the use of QGIS in other sectors and its development.

From the strong mixture of representatives, presentations from Leeds (Helen Durham) and Newcastle University (David Fairbairn) gave insights into the teaching of QGIS and more broadly open source spatial technologies at both undergraduate and postgraduate levels. Josephine Ellis, from Blue Kayak, gave an overview of how the skills learnt on these courses are being implemented in a professional environment to move away from proprietary software. Our own David Fairbairn presented details of the teaching some members of group do across a range of degree programmes, including the content on our own GIS and SMS (Surveying and Mapping Sciences) degree courses, but also those modules which we give on Civil Engineering courses as well as to other programmes within the schools of geography and biology . A brief mention was also given to some of the CPD courses which both Leeds and we run, with Laura Hanson (ARUP, formally our group), also referring to these within her talk on experiences with GIS and QGIS.

The later talks were more focused on the application of QGIS and developments of the software and plugins. This was mostly led by public sector inputs, with talks from Stockton-on-Tees Borough Council (David Renn), Newcastle City Council and Lutra Consulting (Brian Williams and Saber Razmjooei respectively) as well as a talk from Northumberland National Park (Tom Chadwin). These series of talks focused on the adoption of QGIS (from ArcGIS) and the development of plugins to fill gaps within the functionality of QGIS to make it the GIS software of choice for many within the organisations.

From the perspective of researcher within an academic environment and a current QGIS user (as well ArcMap user), it was informative and useful to discover how such software was being applied and developed within different environments.

Plans are being made for further meetings, with suggestions from those interested welcome.

Python II

In this week’s Understanding Code – Python seminar the use of classes were explored. Whilst this felt quite a step up from last week’s topics on variables, for, if and while loops, we were reassured that Phil Jeffes, the seminar presenter, had been studying his undergraduate for two years before classes were introduced.

The examples started with basic implementation of classes; how they are defined and can then have functions called upon them. Towards the end of the seminar, a more complex example was given. Participants were given some code which, when completed, would allow them to move between different rooms of a house depending on the user’s input. To complete the code an if statement was required to determine the user’s input and to catch if the number of inputs exceeded the number of variables in the list.

The Understanding Code series comes to an end next Monday (07th March) where everything taught up to date will be used to link python code to a web browser.

Python I

The Understanding Code workshop, given at Campus North, is a series of six sessions learning various aspects of code, held on Monday evenings. The first three sessions covered an introduction to HTML, CSS and styling followed by Javascript and Dynamic Content. The fourth session, given on 22nd February, was the start of three workshops on Python. Whilst there are many different languages available Python is proving to be one of the most popular (http://spectrum.ieee.org/computing/software/the-2015-top-ten-programming-languages).

Python I was well attended with approximately 30 people from all different backgrounds present, including several PhD researchers from within the School of Civil Engineering and Geosciences. The seminar was an introduction to Python involving some basic processing: variables, while, for, if statements and when these might be useful. Classes were briefly introduced at the end of the seminar in preparation for next week’s Python II course.

The course was a really good introduction to Python, keeping it simple and straightforward whilst starting to look at how basic principles can be use in complex cases.

Ordnance Survey PhD Workshop

February 9th and 10th was the third of what has become an established annual event for Ordnance Survey (OS); inviting all sponsored PhD and postdoc researchers to present their latest research at the Ordnance Survey head office in Southampton. Whilst many know OS mainly for their paper maps, there is a wide range of research that is being undertaken to keep OS at the forefront of mapping technologies. This diversity in research was presented over the two days in four themed sessions. The opening session was ‘3D’ and was opened with my research on automatic reconstruction from a dense image matching dataset. Other 3D research presented included automatically adding texture maps and semantic information to 3D building models (Jon Slade, Cardiff University), why people need 3D (Kelvin Wong, University College London) and real-time urban dataspace modelling (Oliver Dawkins, University College London).

As well as giving oral presentations, a panel session was held at the end of each session where the session’s presenters and OS employees working in the relevant field were asked questions on the overriding theme of the session. This generally led to some really interesting and insightful discussions about how the panel saw the discussed research fitting into the OS remit. It also became apparent that parts of the research presented in the session as well as the other session had several overlapping themes, opening the opportunities for future collaboration. A poster session was also held after lunch each day which allowed OS employees who may not be directly involved with the research to view what studies are currently being undertaken, whilst giving the authors an opportunity to network and discuss their results.

The final session of day one was themed ‘Data Analysis’. The first two presentations from Robin Frew, University of South Wales, and Rebecca King, University of Southampton, addressed spatial usability issues and temporal modelling, respectively. The final two speakers of this session were first year PhD students presenting an overview of their research; Nick Bennett, University of Southampton, and Judit Varga, University of Nottingham, will be investigating similar topics in the use of data mining to map events and update mapping at different scales.

The second day opened with the theme of ‘People and Places’, the social sciences side of Ordnance Survey research. This covered a wide range of research included mapping vernacular geographies (Katherine Stansfeld, Royal Holloway, University of London), how people identify with narratives and place (Iona Fitzpatrick, University of Nottingham) and how different users interact with geo-spatial technology (Mike Duggan, Royal Holloway, University of London).

To close the workshop the final session theme was ‘Machine Learning’. Presenters Ce Zhang (Lancaster University) and postdoc David Young (University of Southampton) discussed their research utilising deep learning for supervised and unsupervised image classification.

As well as giving us the chance to see the various research projects undertaken by OS as well as getting to see our external supervisors, it also gives the chance to see how fellow PhDs are progressing through their projects and share an tips or advice of how to overcome the next hurdle. As I am now approach the writing up stages of my research, this will unfortunately be my last OS PhD workshop. I would therefore like to take this opportunity to thank Ordnance Survey for the data supplied and their continuing support throughout the progression on this research.

Andrew McClune

Final year PhD Researcher

Visualisation workshop

A number of us last week attended a workshop on visualisation, organised by Nick Holliman, professor of visualisation in the school of computing scince. After successfully having abstracts accepted David Fairbairn gave a presentation on ‘using geovisualisation in the decision theatre’ and Neil Harris presented his and Craig Robson’s work entitled ‘spatio-temporal network simulation and failure visualisation’ (as presented at GISRUK earlier in the year).

The aim of the workshop was to firstly share the work going on in the visualisation of data in research around different groups and departments across the university. This was achieved through a series of presentations giving an opportunity for people to present their work on visualisations as used in their research. This also gave the opportunity for them to raise questions about their work with regard to how to improve the visual outputs as well as pose thought provoking questions in the area of visualistion. This session provoked some productive discusions on the area of visualisation in gereneral in repsonce to the material presented.

The afternoon session focused on two questions; (1) what tools and methods are commonly used for visualisation in research and (2) what is required for the future of visualisations in research. Breakout groups were used to facilitate disscusions around these questions as well as full group discussions allowing key points to be discussed by the wider group.

The day proved useful in many ways by combining a range of people with varying thoughts and interests with regard to the visualisation of data. By the end of the day future meetings and collaborations were being discsused along with ideas on how to continue such meetings/workshops in the future.


ITRC @Newcastle – autumn 2015

As a research group a small number of us have been involved in the ITRC project over the past five years, namely Stuart Barr and Dave Alderson. Craig Robson joined the ITRC ranks in January, pausing his PhD work to help complete the final phase of the research required by autumn 2015. ITRC (Infrastructure Transitions Research Consortium) has been investigating the future of the UK’s national scale infrastructure with regards to how it must develop to meet ever changing demands and how climate change amoungst other factors will affect the resilience of those networks we rely on.

Our role in the project has centered around the development of the tools which would allow the five year project to be completed and included, but was not limited to, the development of the central database for all data for the project, and the support tools which would enable the analysis to be undertaken and results reported. It is on this later point where most of the past 6 months have been spent; developing a reporting tool for the presentation of the results from the long-term infrastructure planning aspect of the project.

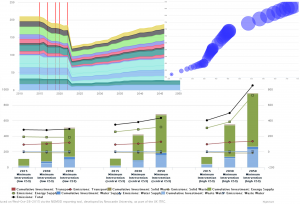
The developed reporting tool allows users to view results from the each infrastructure sector (e.g. transport or waster supply), or view cross sector results, a set of similar metrics computed for each sector allowing for direct comparisons between them on there performance. For each sector a range of model outputs can be viewed from the level of emissions produced, to the running costs per year to the cumulative capital investment required. Results are shown not only at the regional level, but where possible at the sub-national level through the government office regions for example where the models output data at this granularity. This allows the tool to show data not just in charts, but also through maps, allowing new insights to be learned which may not be identified through non-spatial results. More detail on the tool, along with images and the like will be provided in a specific post at a later date, but for now a small selection of images below exemplify the tool.

Drawing1

With the end of the project looming near an event was organised at the ICE in London on the 15th October where the key results and impacts from the project could be disseminated to a wider audience with those key members behind the research all being present to answer questions and discuss their work. At the event we were available to demo the reporting tool and discuss the complexities behind the database for those interested, while a set of slides were used to give a overview of our work. More generally two videos (below) were produced giving an overview of the project and the one on the resilience of the UK’s national infrastructure.

Summer school in Obergurgl


glaciers
glaciers
Geodetic ride
Geodetic ride

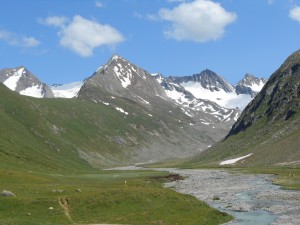
An amazing summer school took place last week in Obergurgl, Austria (http://www.uibk.ac.at/geographie/summerschool/). The focus was to investigate the various close range photogrammetry remote sensing techniques for alpine terrain research. Such an international environment made the atmosphere very interesting. I met other researchers from Austria, Germany, Italy, Poland and even Equador!!! Professors in remote sensing and photogrammetry from Germany and Italy insipred us with their talks.

The days were very busy with data collection in the alps and data processing, however the fieldwork gave us the opportunity to explore the beautiful mountains and refresh our minds. The best part of course was the social events with tasty austrian beers. The weather was incredibly warm, even the locals became crazy in such a warm environment; I couldn’t believe that Austrian drivers use the horn, this is a Greek habit!

The local newspaper reported the event on their website: http://www.tt.com/panorama/katastrophe/10251350-91/katastrophen-besser-lesen-lernen.csp

The organiser Dr. Martin Rutzinger successfully managed to create a great event and make everybody happy.
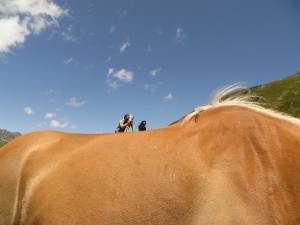
The 2nd attached picture shows how engineering is combined with nature. 🙂

Maria Valasia Peppa

Geospatial in Budapest

The central location of Vienna has allowed me to engage with some more people in the past few weeks. I and the other two members of the International Cartographic Association Statutes Committee, Ferjan Ormeling (Netherlands) and Bengt Rystedt (Sweden) met here a couple of weeks ago to discuss proposals for the ICA General Assembly in August. We were joined by my host here, ICA President Georg Gartner, and the Secretary-General Laszlo Zentai from nearby Budapest. Ferjan, Bengt and myself also form half of the Working Group on International Map Year (http://mapyear.org) and were able to make some further plans for this UN endorsed event. My ICA work in helping organise our Commission workshop in Curitiba in August continues from afar.

I spent a couple of days in Budapest this week – giving a seminar on VGI at the Eotvos Lorand University Department of Cartography & Geoinformation (a lively group of half a dozen staff and plenty students). It was good to meet again with Laszlo’s colleagues with wide ranging interests (Matyas Gede is currently exploring cave surveying and 3D visualisation, along with citizen mapping of tourist activity; Zsolt Torok is a historian of cartography, but also researches eye tracking; Andrea Podor, from a nearby university, examines environmental GIS and educational issues).

Back in Vienna I have been meeting with colleagues in my extensive host department, Geodesy and Geoinformation which has 7 research groups (https://geo.tuwien.ac.at/research-groups/). Gerhard Navratil in Geoinformation has interesting views on the topic of VGI and cadastral systems, which I am continuing to engage with Kaizer and Mustafa back in Newcastle. And Gottfried Mandelburger, familiar to Newcastle geomaticians having spent some time with us, has discussed further the archaeological work I have been interested in doing with LiDAR.

I’ve been doing some ‘map use studies’ by finding orienteering events to participate in whilst here – and it’s great that some wonderful terrain is available so close to Vienna and accessible by public transport. I even had a run in the suburbs of Budapest in torrential rain one hour after my seminar finished: a bit beyond the call of duty, but good training for a main event – the academic orienteering championships at the Danube Park next week (yes, there are enough university staff and students in Vienna to have a formal closed championship).

David Fairbairn