By Neil Perkins
At the one year anniversary of the ICaMB Blog, and after publishing 35 articles, it seemed like a good time to reflect on what this initiative has (or has not) achieved. When Paula Salgado, Phil Aldridge and myself (with the prompting and encouragement of Bob Lightowlers) started this, there were a number of very clear goals we had in mind. The first of these was to improve communication within ICaMB itself, so that we would all have a better sense of what our colleagues were up to, their achievements and to introduce new PIs. In particular we wanted to highlight some of the great things our newly formed postdoc and PhD student associations (IPA and PANIC) have been doing. We also wanted to tell the world about some of the exciting science being performed in ICaMB and highlight some issues and discoveries that we thought would be of wide interest. Finally we wanted to show the fun side of being a scientist in Newcastle and reveal some of what we get up to when we’re not in the lab.
Did we succeed? Well that’s probably not for us to judge and the true test of this will be if the blog is still going in five years time (and if people are still reading it). However, one unanticipated highlight for me has been the discovery of Google Analytics and what it can tell us about the success of the ICAMBlog. As a hard core geeky scientist, Google Analytics can be frighteningly addictive. A guilty pleasure for me has been to watch in real time what happens after we start publicising the latest blog: as soon as the emails get sent out, the tweets are sent or the Facebook update posted you can see people logging in to read the blog. We don’t know who you are but we can see where you are and how you found us. Fascinating and slightly scary.
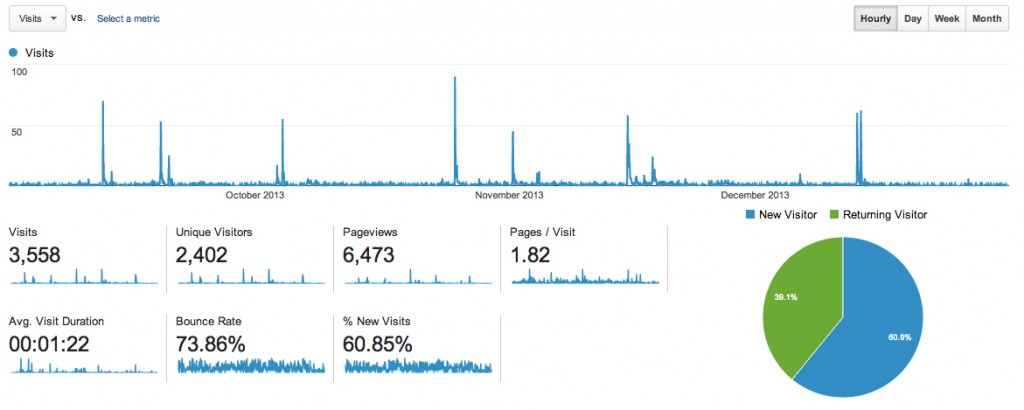
Each spike on the graph represents people viewing the website when a new blog article comes out. There is an immediate response the moment we send out an email, tweet or share on Facebook. Data shown is from Sept 1st - Dec 31st, 2013
So for this blog, to commemorate our one year anniversary, I thought I’d share some of the numbers. How many of you actually read the ICAMBlog? Where are you from? Which article was the most popular?
So how popular are we?
At the time of writing we have had 7,703 ‘Unique Visitors’ to the blog, who have made 11,715 visits comprising a total of 20,602 ‘Page views’. Unique visitors really means different devices, so someone who accesses the blog through their phone as well as a computer will count twice. On the whole though, we are pretty happy with this. It is thousands of people who now hopefully know more about ICaMB and what we do than a year ago.
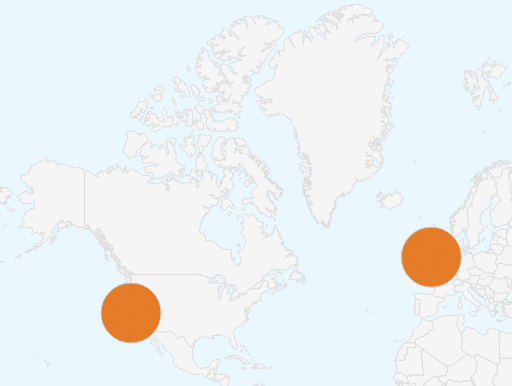
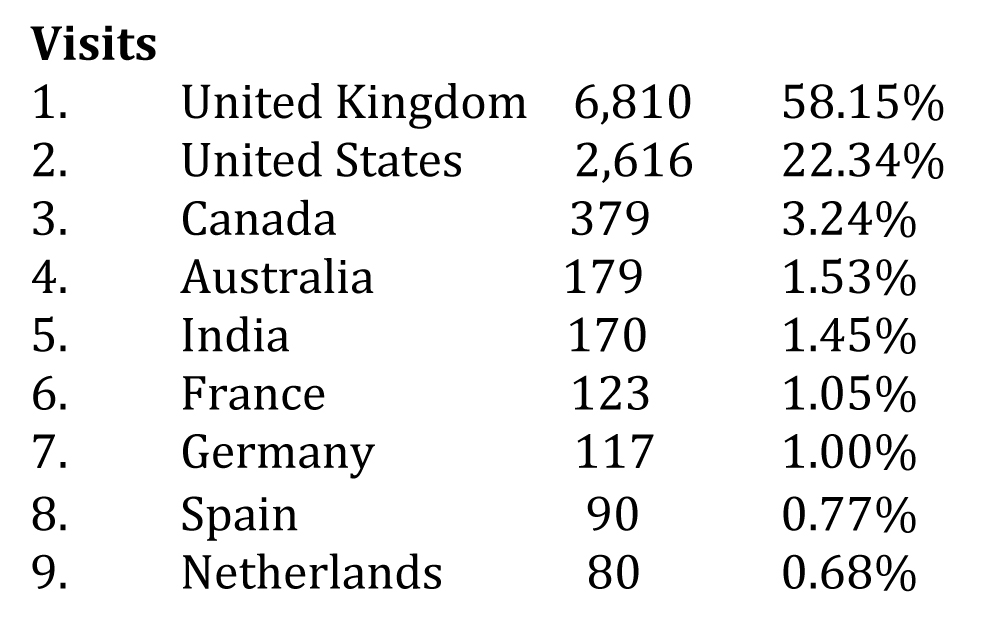 So where is everyone coming from who reads the blog? Unsurprisingly, the majority of our readers (58%) come from the UK. The USA and Canada are the next highest, (although see the ‘reddit event’ below), followed by Australia and India. Although the numbers are lower for other countries, the readership is truly global.
Within the UK, as might be expected, we have a large number of readers from the 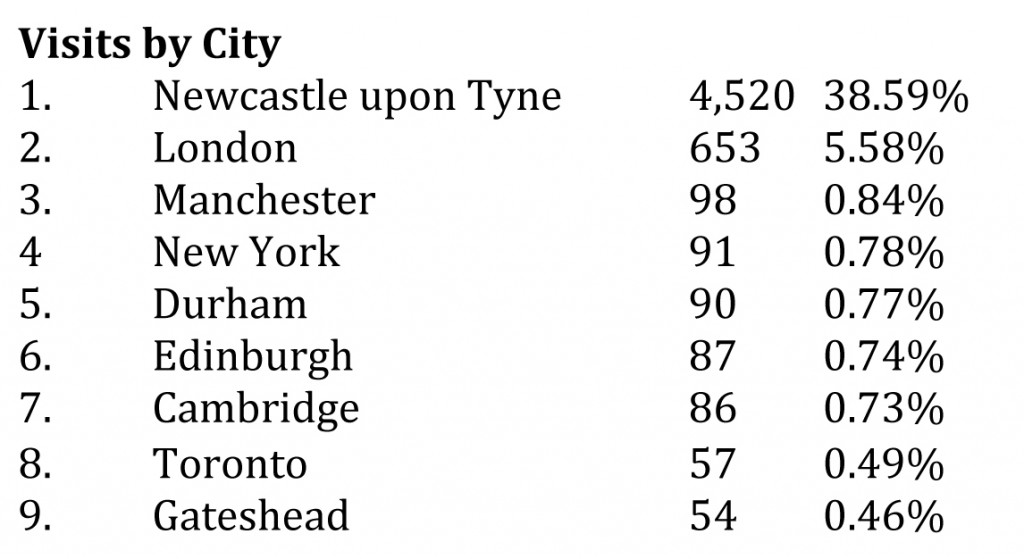 Northeast. Readers from Newcastle upon Tyne represent 38.5% of our total readership which means that >60% of our readers are not local, so we are achieving our aim of getting the word out there. London is the next highest city followed by several other cities with strong university links.
What are people reading?
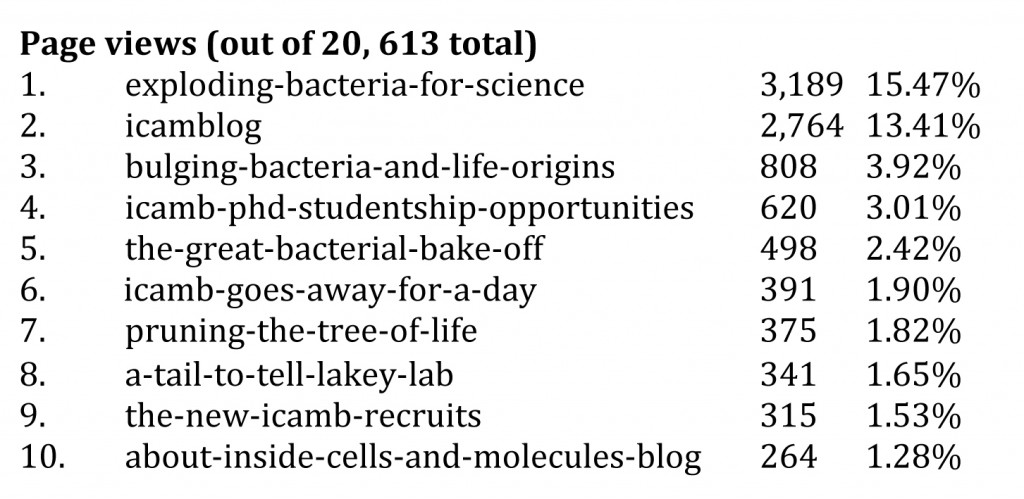
Our most popular article by far has been ‘Exploding Bacteria for Science’, which featured the work of Kenn Gerdes from the Centre for Bacterial Cell Biology here in ICAMB. This article garnered 3,189 page views, 15.5% of our total (note to blog team, must feature more exploding things next year). However, this number may be slightly artificial as it benefited from exposure on reddit (see what that means below). Our first ever long feature was ‘Bulging Bacteria and the Origins of Life’ which highlighted an outstanding Cell paper from the Errington lab on L-form bacteria. This is particularly impressive as the blog was starting and it wasn’t on people’s radar yet. Completing our top 5 were the blog on ICaMB PhD student opportunities, the ‘Great Bacterial Bake Off‘ and ‘ICaMB goes away for the day’.
 The success of Exploding Bacteria is also reflected in the number of views on our ICaMB Youtube site, with 3,186 visits to the penicillin effect video associated with this article. Jeff Errington’s Bulging Bacteria video follows, with 322 views and the video of Jeremy Lakey and a new bacterial cell killer had a respectable 187 views, completing our top 3 video chart.
Are they really reading these articles?
One interesting feature of Google Analytics is that we can see how long people stay on each page, although we cannot control for people opening the page and then wandering off to do something else.
So when people from England and Wales log on, they spend an average of 1 minute 51 seconds with the page open. They may be making tea of course but in general this suggests they are reading the blog. Readers from Scotland and Northern Ireland, slightly less impressive, with 58 seconds and 1 minute 7 seconds respectively. Maybe they are speed-readers in Scotland.
When we look deeper, some of those page view numbers start to look a bit less impressive. All those visitors from the USA don’t look so good when you realise they stayed on the page for an average of 13 seconds. Low attention span maybe? It’s OK to say that, they will not have read this far down the page. Canada is a bit better at 34 seconds, Australia is at 24 seconds but India is a very respectable 1 minute 25 seconds. People from Newcastle spend 2 minutes 11 seconds on each page. London less so at 46 seconds while other cities average around 30 seconds.
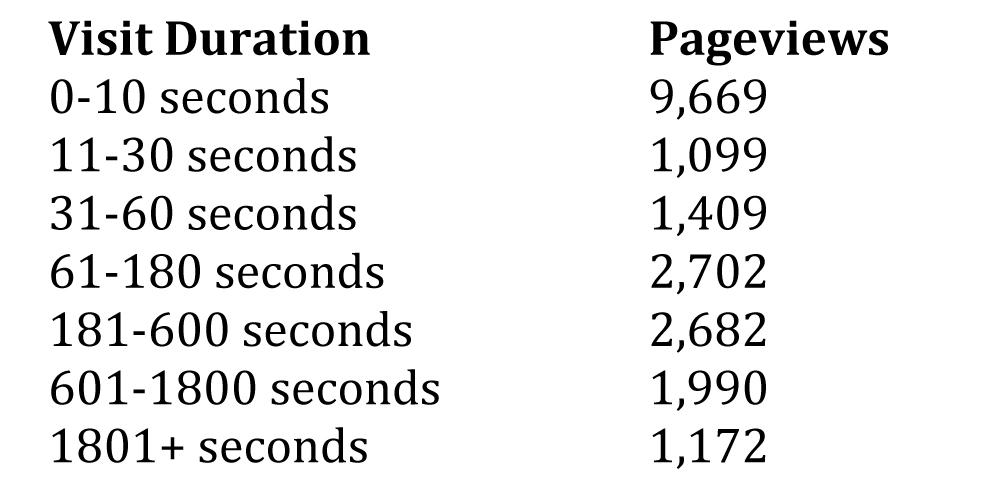 Our headline numbers also start to look a bit less impressive when we take visit duration into account. Of our 20,723 page views, 9,669 are for less than 10 seconds. But that still leaves >8,000 page views being read properly. So a bit of a mixed bag but at least our colleagues seem to be interested in what we are writing.
The impact of social media
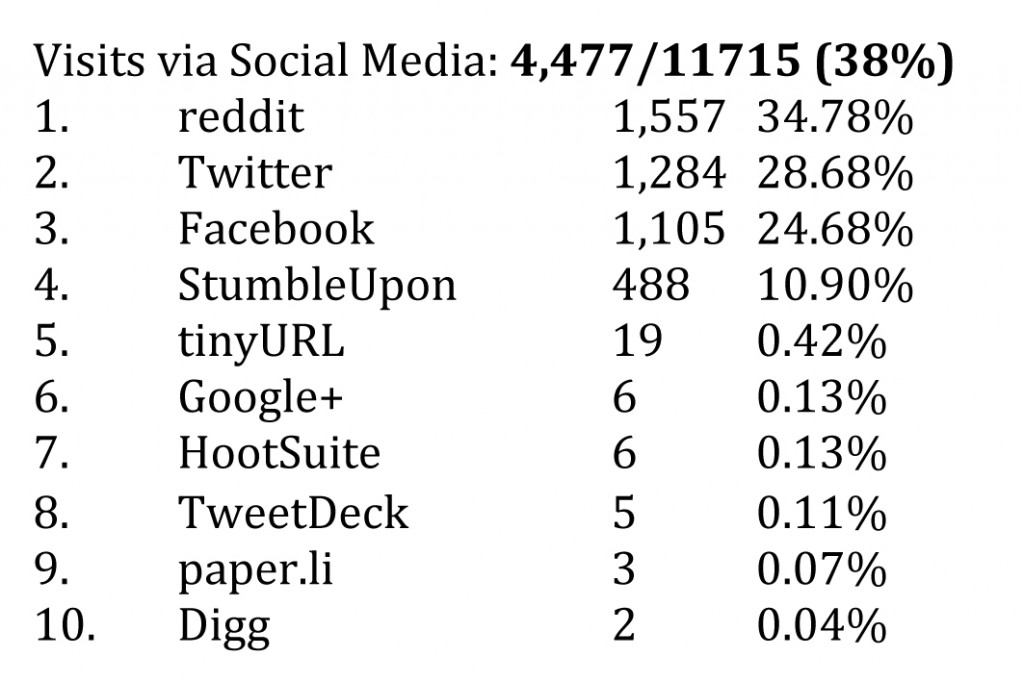 To get word of the blog to the outside world we have been using Twitter, Facebook and other forms of social media. Google Analytics can also tell us how successful this has been. Of our 11,715 visits to the site, 1,284 have been through Twitter and 1,105 through Facebook. Twitter visitors stay for 1 minute 14 seconds on the site, while Facebook visitors stay for 49 seconds.
The reddit event
Reddit is a ‘a social news and entertainment website where registered users submit content in the form of links or text posts’. Paula sometimes submits links to the science section when the ICAMBlog is carrying something that we think might be of interest. This was certainly case with ‘Exploding Bacteria for Science’, which picked up a lot of traffic from reddit, accounting in part for its high popularity. In total, we have had 1,557 visitors come through reddit and another 488 through Stumbleupon (‘a form of web search engine that finds and recommends web content to its users’). These account for quite a large chunk of our USA traffic to the site. The down side is that the average visit duration of a Reddit user is 3 seconds, while someone from Stumbleupon lasts for 9 seconds. I’m going to go out on a limb here and suggest that they are not actually reading the content. So the moral is that while some approaches can boost our overall numbers, it is whether they stay around and actually read the articles that is important.

That big spike is people coming to the blog from reddit, staying 3 seconds and then leaving. The smaller spikes are our normal readership levels
Any Conclusions?
So have we been a success? We think so but there is clearly a lot of room for improvement and scope to increase our readership. In the year ahead we certainly plan to continue our work on the blog and are very happy to welcome Suzanne Madgwick and Kevin Waldron to the blog team. We will continue to highlight the science being produced in Newcastle but are thinking of broadening the scope of our articles. For example, should we publish more opinion pieces and take a stand on the various issues confronting scientists today, both in and outside ICaMB? We’d be very interested in hearing from you to let us know what you think. Comment is easy: tell us what you think and submit, no need to register or create an account. We would really like to hear from you, the reader that spends some time with us and reads all the way to end – what kind of articles would you be interested in reading? Let us know!
A final word. Those of us on the blog team would like to thank Phil Aldridge for all his help over the last year. Phil has decided to step down from the blog after this first year but his input and enthusiasm has been crucial to getting things going and keeping the momentum up. Thanks Phil!

I have to confess that on reading some of the stats in this article the first thing I did was to quickly check my own data. I find my blog statistics pretty addictive to watch but having the opportunity to see how mine measures up to another blog gave me a whole new insight. So thank-you for sharing yours, my 1 year anniversary is next month and I might now do the same.
I also wanted to comment on your analysis of you viewing times. Google analytics’ time numbers are a bit random so I really woundn’t read too much into them. Google doesn’t accurately report people leaving you page so you have no real way of recording how long someone had your article open on their screen. So anyone that browses just single page can look at it for anywhere from 1 second to 30 minutes and Google won’t really know (but it will happily make up some random numbers).
Finally I wanted to say that your last comment on what content to have and how topical to be, strongly echo my own internal debate on blogging. Much like the statistics it’s nice to see other people dealing with the same issues.
Matthew
Thanks for your comment Matthew. Glad you liked the blog.
Yes, you’re right, one should not take the numbers on viewing times too literally. Although I suspect that the general trend is correct. It rings true that our colleagues in Newcastle would spend more time reading each article, while people coming in from reddit would have a quick look before going on elsewhere.