Meeting of ARCC Network Data and Information Management Group, University of Birmingham, January 7th 2015

January 7th saw the first face-to-face meeting of members of the ARCC Network Data and Information Management Group at the University of Birmingham, which GE-researcher David Alderson attended. Organised by Fiona Hewer, ARCC Network Data and Information Strategy Officer (Fiona.Hewer@ukcip.org.uk), the meeting offered the first opportunity for members to discuss data and information tracking within their respective projects. The “Liveable Cities” and “Designing Resilient Cities” (University of Birmingham) was represented by researchers and project managers, Joanne Leach and Amy Beierholm, with David Alderson discussing the ITRC project. Further to this, Ben Ryan, Senior Manager for Research Outcomes at EPSRC gave an overview of the EPSRC’s policy and framework for data, with members able to contribute from their own experiences or experiences of colleagues at their respective institutions of the recent submissions to the new “ResearchFish” tool.

Further information will become available once the minutes are completed, but in the mean time below are some interesting links that may prove useful:

Research Data Management Website @ Newcastle: http://research.ncl.ac.uk/rdm

EPSRC Policy Framework on Research Data: http://www.epsrc.ac.uk/about/standards/researchdata/

EPSRC Clarification and Guidance on Policy Framework for Research Data: http://www.epsrc.ac.uk/files/aboutus/standards/clarificationsofexpectationsresearchdatamanagement/

ARCC Network Website: http://www.arcc-network.org.uk

OpenARCC @ ARCC Network Website: http://www.arcc-network.org.uk/openarcc/

OpenARCC Data Website: https://openarcc.wordpress.com/


Sankey diagram of cobalt life-cycle

Working with colleagues Ali Ford, Oliver Heidrich, and David Manning on various papers and proposals, we have started to pull together a Sankey diagram of the reported tonnages of cobalt in 2012 through various processing stages within its life cycle. The orange and green colours denote the quantities of cobalt reported by the respective importing or exporting countries, but we have aggregated to the continent level. This information was extracted from the UN COMTRADE database and linked to eSankey! software via an intermediate Excel spreadsheet. The good thing about this approach is that by updating the spreadsheet with new values e.g. for different years etc, or for different elements/commodities/products, we can auto-generate (ish) the Sankey diagram.

Cobalt_2012_Sankey_Mining_Refining_Manufacturing_Use

Source: Cobalt, 2012, DESA/UNSD, United Nations COMTRADE Database

Going even further, Ali reproduced the data above at the country-level, across the same three stages i.e. Mining->Refining; Refining->Manufacturing; Manufacturing->Use, but using only the import flow data for now (matches orange flows above)

Comtrade_Cobalt_Full_Input_Imports


Source: Cobalt, 2012, DESA/UNSD, United Nations COMTRADE Database – Mining to Refining imports only

Comtrade_Cobalt_Full_Intermediate_Imports


Source: Cobalt, 2012, DESA/UNSD, United Nations COMTRADE Database – Refining to Manufacturing imports only

Comtrade_Cobalt_Full_Use_Imports


Source: Cobalt, 2012, DESA/UNSD, United Nations COMTRADE Database – Manufacturing to Use imports only


International Symposium for Next Generation Infrastructure 2014 Conference, Laxenburg Palace, Vienna, Austria, September 30th-October 1st 2014.

The end of September saw Dr Stuart Barr, Mr Alistair Ford, Mr David Alderson and Mr Craig Robson from the Geospatial Engineering group attend the second International Symposium for Next Generation Infrastructure 2014 conference, this time held just outside Vienna, Austria. All in attendance were either contributors to, or presenters of, papers that had been accepted by the academic committee for the conference. Whilst the proceedings for this year’s conference may not be available just yet, the following presentations were delivered by the team based on the accepted papers:

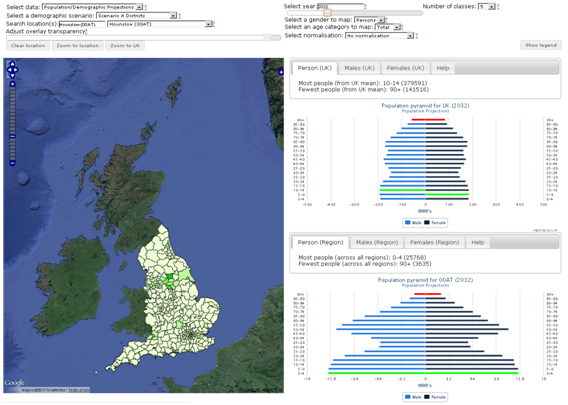
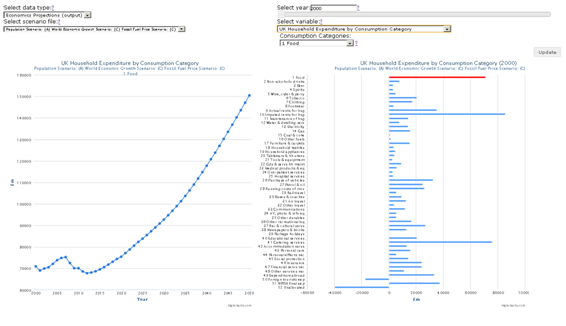
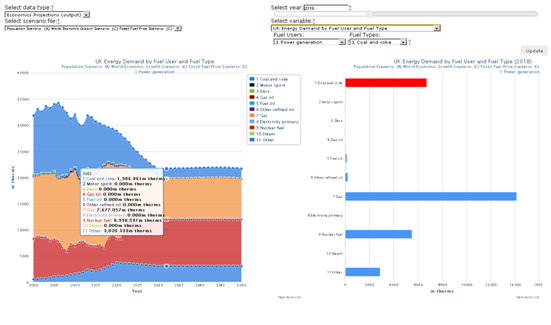
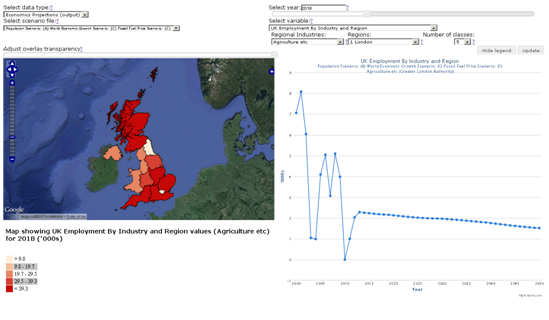
–          Visualisation tools for multi-perspective, cross-sector, long-term infrastructure performance evaluation (Lead and Presenting Author: David Alderson; Co-Authors: Dr Stuart Barr, Dr Martino Tran (Oxford), Professor Jim Hall (Oxford), Mr Adrian Hickford (Southampton), Mr Edward Byers

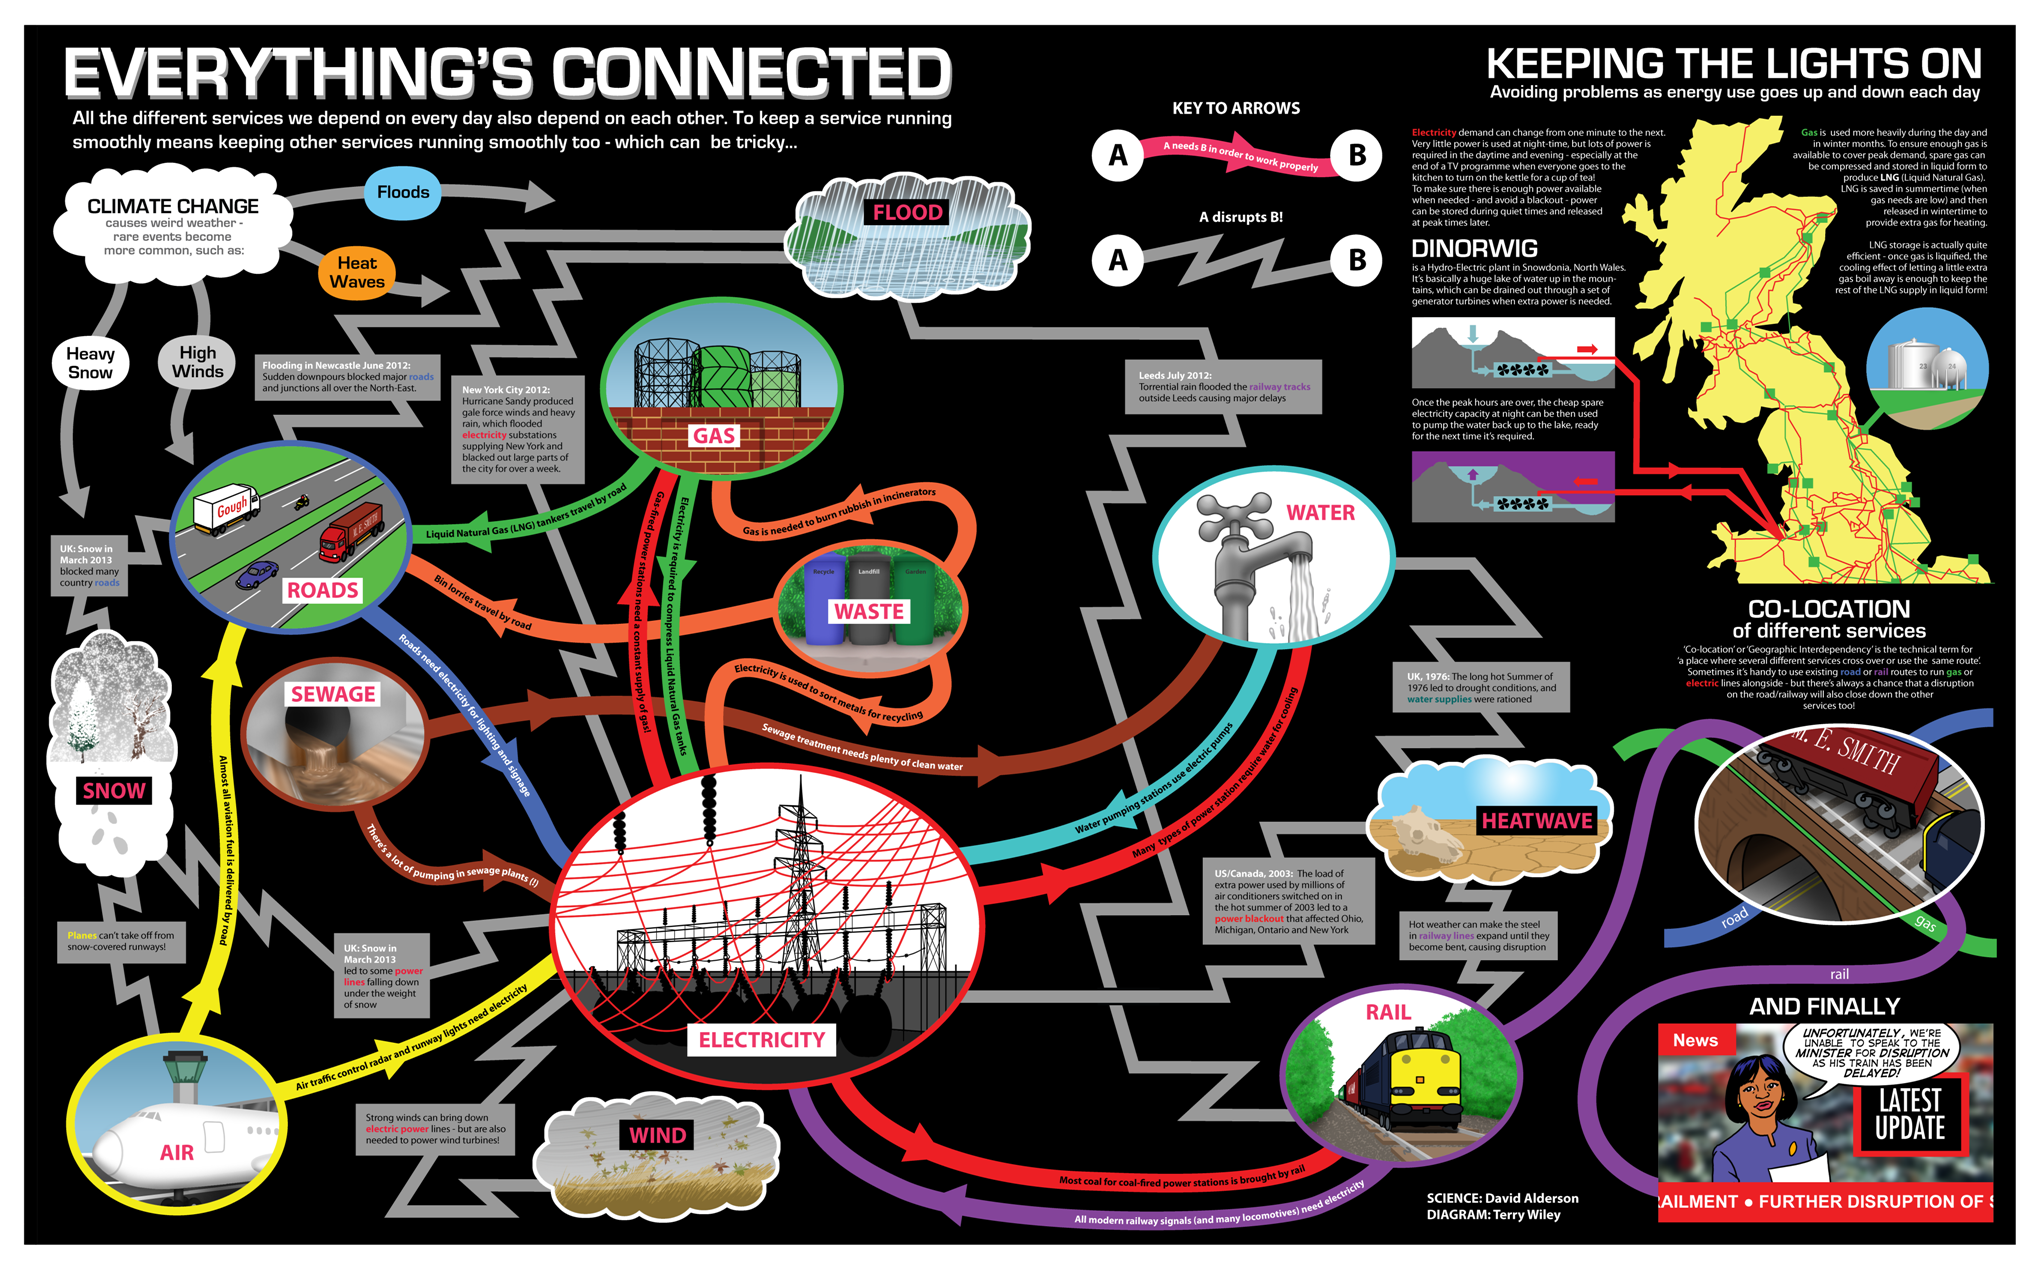
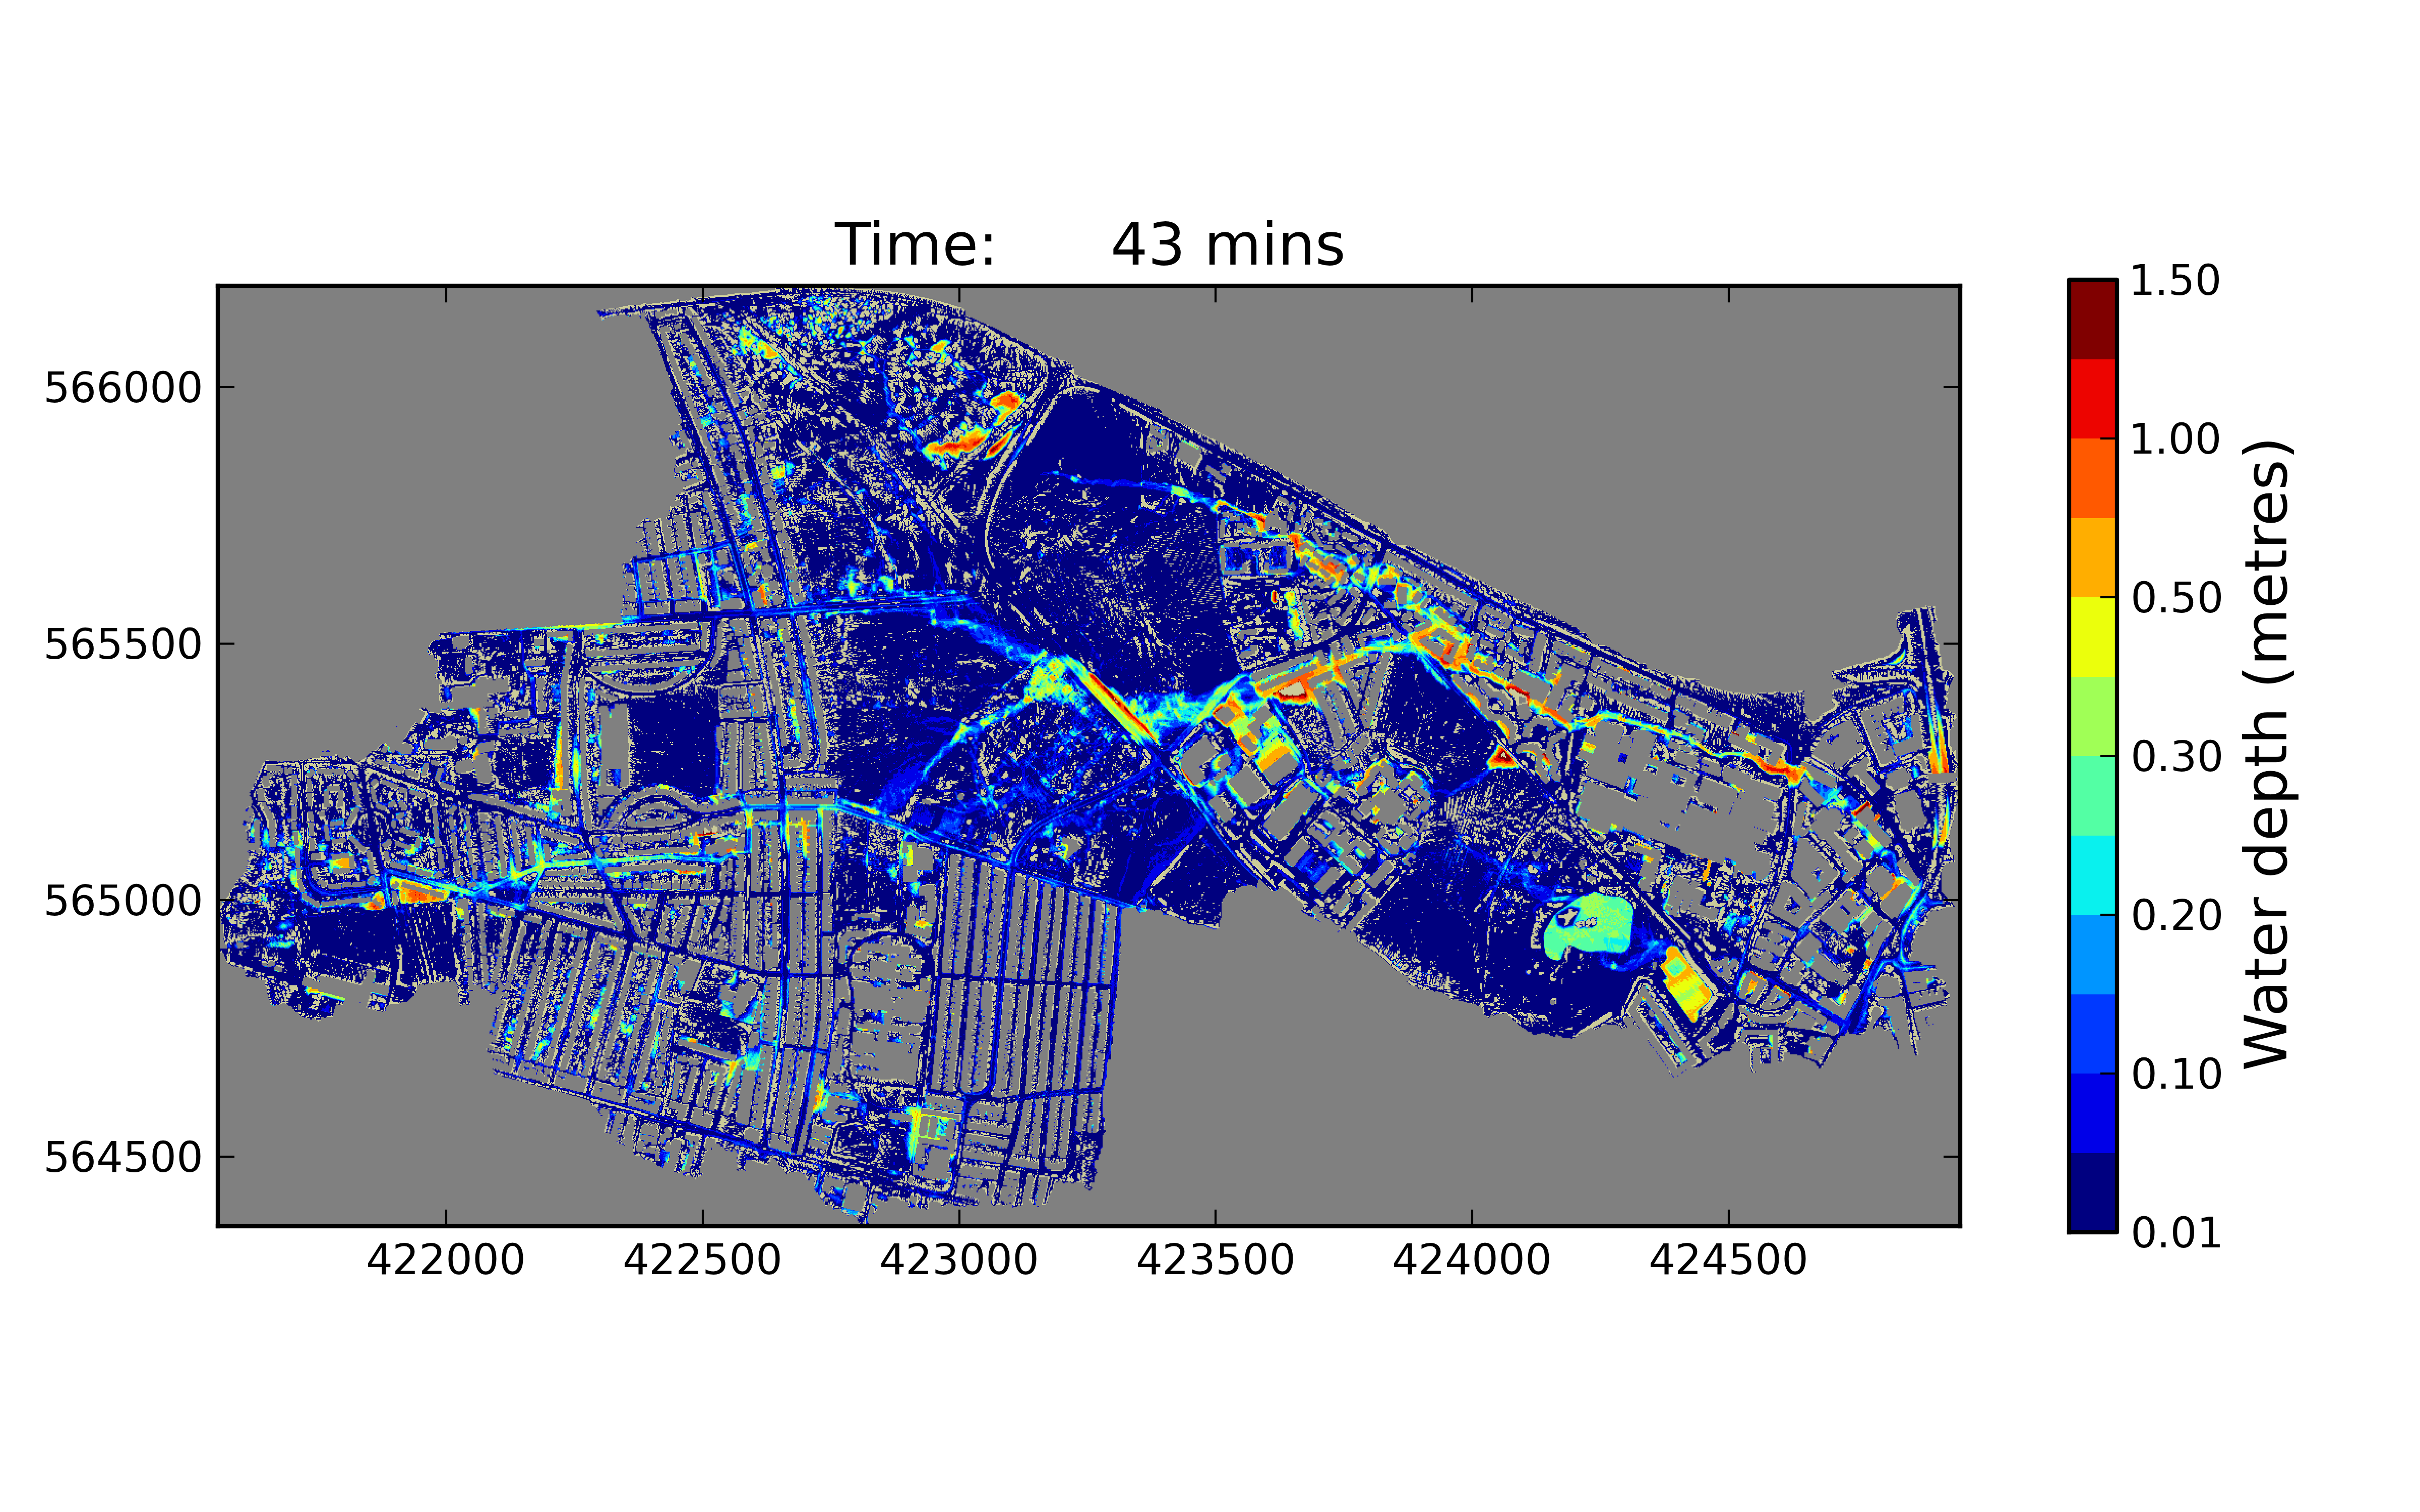
–          Simulating impacts of extreme weather events on urban transport infrastructure in the UK (Lead and Presenting Author: Mr Alistair Ford; Co-Authors: Professor Richard Dawson, Miss Maria Pregnolato, Dr Stuart Barr, Dr Katie Young (Oxford), Professor Jim Hall (Oxford)

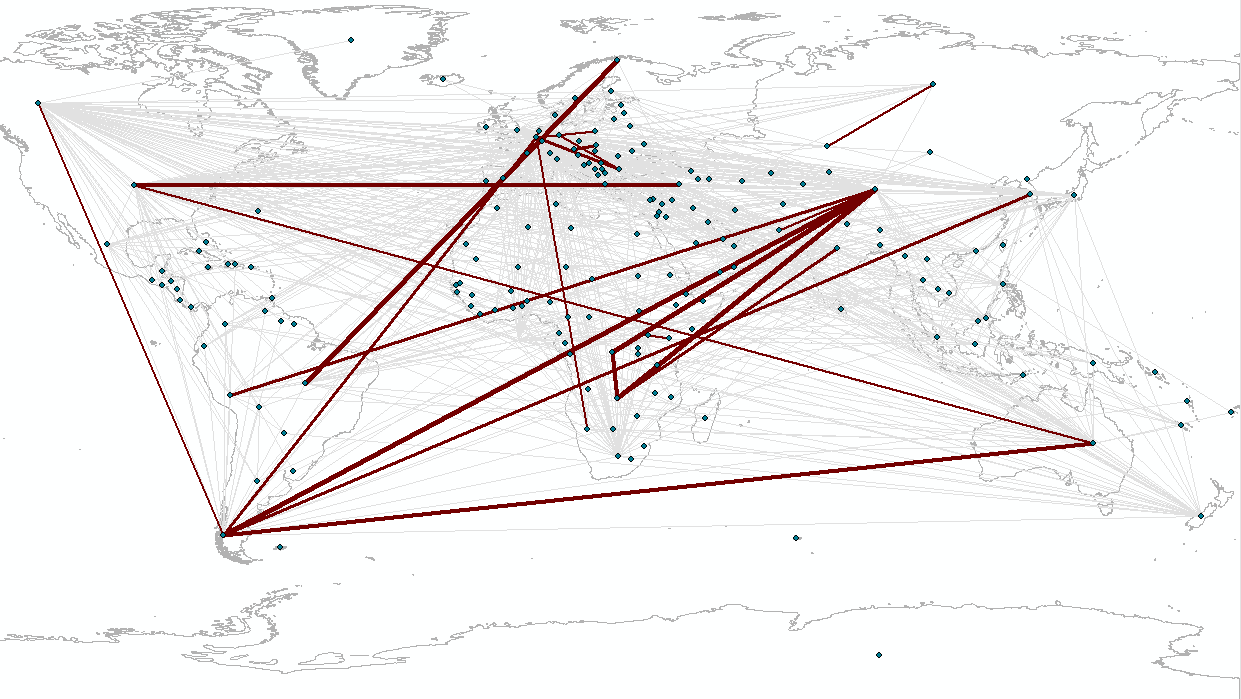
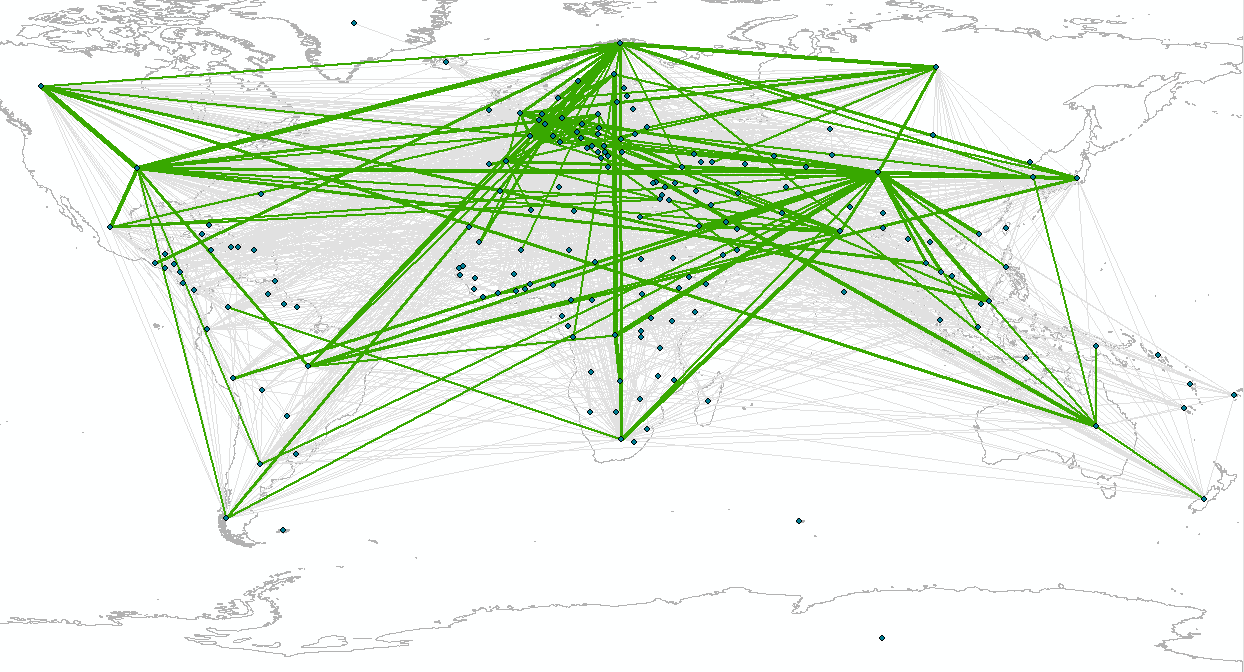
–          Resilience of hierarchical critical infrastructure networks – (Lead and Presenting Author: Mr Craig Robson, Co-Authors: Dr Stuart Barr, Mr Philip James, Mr Alistair Ford)

For those with a general interest in the overall programme at the conference, please following this link: http://www.ucl.ac.uk/steapp/isngi.

UPDATE (August 2015): Proceedings have now been released.

Whilst attending the conference, the presentation delivered by Dr Roberta Piccinelli from the Institute for the Protection and Security of the Citizen Security Technology Assessment Unit (European Joint Research Centre), was of particular interest. Roberta presented a first-pass approach to model the potential impacts of space weather events on an abstract model of the Finnish electricity network. This was of particular interest to those of us working as part of the UK Infrastructure Transitions Research Consortium (UK ITRC), as it represented an area of study that has not been specifically handled thus far within the consortium i.e. the impact of space weather. To this end, a channel of dialogue between NCL-based researchers and Roberta has been established, with a view to sharing ideas, data and understanding what pure potential there is for collaboration. A link to the paper abstract submitted by Roberta can be found at: https://www.ucl.ac.uk/steapp/isngi/programme/analysisofthevulnerability.

Further to this, Peter Bakker, President and CEO of the World Business Council for Sustainable Development (WBCSD) (http://president.wbcsd.org/about-peter-bakker.html), gave a particularly engaging and “rabble-rousing speech at the close of the first day of the conference. Peter spoke candidly about the deficiencies of the current systems in place to promote and measure sustainability, and particularly highlighted the need to engage with business leaders around the world in relation to promoting sustainability within an infrastructure context.

At the start of the second day of the conference, Professor Bruce Beck from the University of Georgia presented some ideas on using concepts from ecology to understand resilience in cities. In a wide-ranging talk, he examined the resilience of natural systems and considered how similar ideas could be applied to engineered systems (e.g. the idea of flood resilience versus flood resistance – allowing floods to happen but being resilient to them), or allowing systems to learn from small events so they are ready for big ones.

In an interesting parallel to work undertaken by the Geospatial Engineering group as part of the EPSRC ARCADIA project, Simon Blainey from the University of Southampton presented his work with Oxford University on disruptions to the railway network in the UK. Using a simple assignment model based on observed exits and entries to UK railway stations, he showed how the number of journeys on each part of the UK rail system could be estimated. This could then be used to assess the criticality of railway lines in the network and as a basis for understanding ways to increase the resilience of the network. In the ARCADIA project a similar approach was used to examine the possible impacts of extreme heat and rainfall events on transport networks in the UK.

From the first of a number of sessions with the theme of infrastructure and extreme events the work presented by Arthur Peterson on adapting for future flooding events in the Netherlands, was one of a small number which looked at planning aspects for prevention rather than analysing the potential consequences of extreme events. A well-known problem for the European country, the talk addressed how they are looking ahead to prevent flood inundation and the difference in approaches between the recent introduction of the Adaptive Delta Management Plan and that which led to the first set of major works in 1953. It was interesting to see the approaches that have been adopted in establishing a plan where there are significant uncertainties in the available data, e.g. for sea level rise, especially for those who are unfamiliar with this aspect of extreme events.

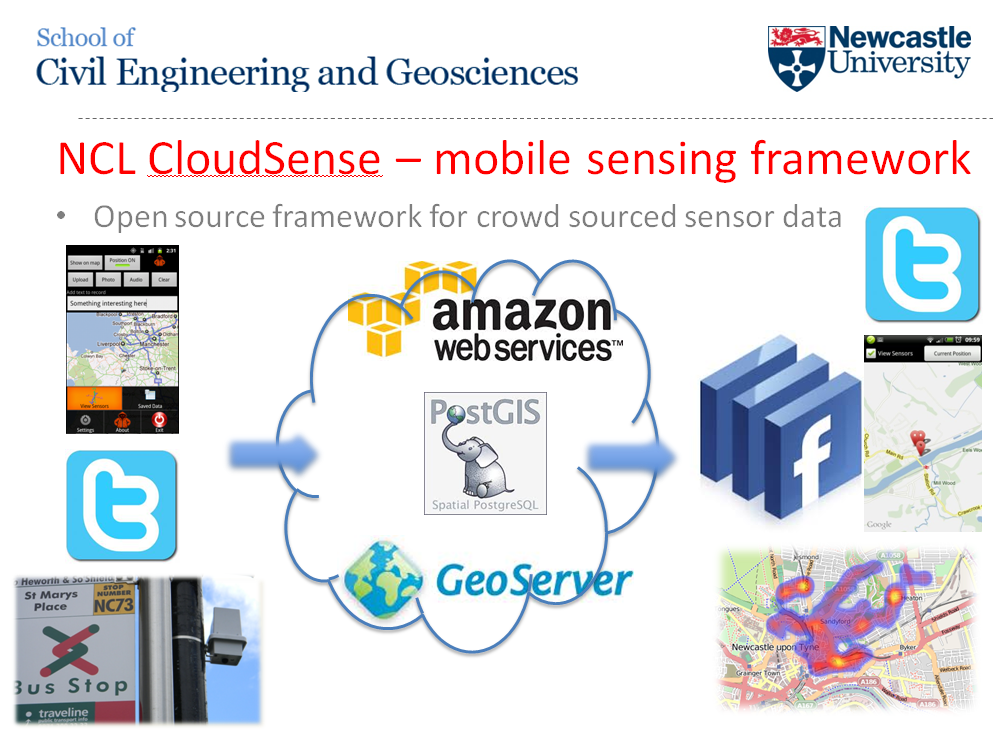
In the second of the infrastructure and extreme event sessions one of our former researchers, Tomas Holderness, along with one of his new colleagues from the SMART institute, Etienne Turpin, gave a talk on the work they have been carrying out in relation to actively reducing the consequences of flooding due to monsoons in Jakarta, Indonesia (http://petajakarta.org/banjir/en/). In a unique presentation for a number of reasons, they together presented the framework they have established based on the social media platform Twitter, a way in which in real time not only authorities can be informed where and when flooding is occurring in real time, but also allows the public to see the same information and avoid the flooded areas, potentially saving lives, with the biggest killer being electrocution from the water. It was refreshing to see some research where the application was in real-time with lives being saved as a direct consequence instead of a scenario based set of action plans.

International Symposium for Next Generation Infrastructure 2013 Conference Proceedings Released

Following attendance by researchers and students alike from the School and group at the first International Symposium for Next Generation Infrastructure 2013, the conference proceedings have now (finally) been released. Please find relevant link to the proceedings, videos, individual papers and more below:

http://ro.uow.edu.au/isngi2013/

Watch this space for more information about the groups attendance at ISNGI 2014…

Making evidence useful via visualisation, 20th June 2013, NESTA, 1 Plough Place, London

Research Assistant in GeoInformatics, David Alderson, attended the “Making evidence useful via visualisation” event organised by the Reuters Institute for Study of Journalism, Oxford held at NESTA on 20th June, in London. The event organised brought together members of the academic research community in the fields of computer vision, visualisation and computing science, alongside a wealth of representation from media outlets, designers, artists and government agencies and departments. The event focussed on the need for effective visualisation of data and the challenges faced in delivery of tools and techniques to help a wide audience wade through the growing quantity of collected data. Keynote speaker Dr Luciano Floridi (Director of Research, Oxford Internet Institute, University of Oxford), and Alan Smith OBE (Principal Methodologist, Office of National Statistics) amongst others, highlighted the need for transparency and provenance of the visualisation process to allow users to understand the processes and transformations data may have undertaken to arrive at a particular visual representation. The provision of access to the underlying data, as well as the derived output or tool itself, can help to provide that lineage for a user, and potentially allow them to “recreate” the process undertaken to create the visualisation, or at least have access to the same data to create visualisations of their own. A presentation by Aleks Collingwood, Programme Manager and Statistics Specialist at the Joseph Rowntree Foundation (JRF) gave an overview of the new JRF Data portal, and echoed the sentiments of allowing users the capability to create their own versions and interpretations through links to underlying data. Finally a discussion session, chaired by Geoff Mulgan, Chief Executive of NESTA, encouraged the audience to participate in highlighting some of the key challenges to effective data visualisation and where they would like to see change in how these are delivered. A summary of the key points is listed below:

  • Improved graphical literacy of the general audiences for data visualisation, and also producers;
  • Increased levels of interactivity and personalisation of the data visualisation process, in much the same way as Google Maps has allowed everyone to become a cartographer;
  • More approaches and tools enabling user-generated content, in this instance, user-generated visualisations;
  • MORE FUN!

However, the proliferation of data visualisation techniques, tools and technologies does raise the question of at what point have we replaced “too much data” with “too many visualisations”? Will there come a point where a decision-maker will require sophisticated tools and techniques to search through a myriad of visualisations of data, rather than the data itself?

ARCC Assembly, 10th-11th June 2014, Austin Court, Birmingham

The 2014 Adaptation and Resilience in the Context of Change Network (ARCC Network) Assembly was held at Austin Court, Birmingham over June 10th and 11th. The events theme this year was “Urban areas as systems: adapting for the future”, and had excellent representation from the academic research community, policy-makers, and practitioners involved in the delivery, maintenance and management of services and assets related to the build environment. Some of the keynote addresses were delivered by Atti Emecz and Chris White from EPSRC, outlining the current EPSRC portfolio of built environment-related projects, and the current and future funding landscape. In particular, the alternative mechanisms for trying to maximise research impact, such as secondments, or impact accelerator accounts were highlighted as being potentially useful for engaging with those outside the academic community. David Penhallurick of Infrastructure UK (HM Treasury) gave two presentations on his attempts to break down the silo approach to infrastructure service delivery in the UK, and begin to encourage more collective and collaborative thinking in infrastructure service and project delivery. Good luck with that one David! Interestingly, one area that repeatedly arose from the two-day event was the need to study and grapple with the potential impacts of the built environment on the health and well-being of people who use it and interact with it. Nick Grayson, of Birmingham City Council raised the point that in the future many health-related issues will not be from communicable diseases, but by those potentially related to stress and lack of physical activity. The study of health-related impacts of the built-environment is a potentially interesting future area or theme for EPSRC and ARCC to pursue.
The event itself is was a great success and a great opportunity to network and discuss current and future research areas with policy makers and practitioners. The links to the slide packs generated from the event should be available on the ARCC website in the near future.

Strewth, these guys are SMART!

The inaugural International Symposium for Next Generation Infrastructure was held between 1st and 4th October 2013, at the SMART Infrastructure Research Facility at the University of Wollongong, Australia, and one lucky Geospatial Engineering researcher from Newcastle was able to attend. David Alderson gave a 20 minute presentation entitled A National-Scale Infrastructure Database and Modelling Environment for the UK following a successful submission of a conference paper to the conference committee, under the same title. The work contained within the paper and the presentation represented an amalgamation of work conducted by David and other researchers from the Geospatial Engineering group at Newcastle and other research institutes and universities involved in the Infrastructure Transitions Research Consortium (UK ITRC) programme. The focus of the paper and presentation was to give readers and delegates alike a glimpse of some of the work undertaken in the process of constructing a database of infrastructure-related data relevant to the UK. This included not only an overview of some of the datasets that may be found within the database, but also a preview of some of the visualisation tools that are being developed on top of the data. An overview of these visualisation tools can be found within other posts in this blog site here.

A copy of the slides can also be found here and here. Unfortunately the presentation has had to be split into two parts, so please download from both links to get the full presentation.

Other representatives from the School of Civil Engineering and Geosciences at Newcastle University, UK could also be found delivering presentations at the event including:

Miss Sarah Dunn, PhD Student – Modelling infrastructure systems for resilience and sustainability (part one, part two)

Mr Shaun Brown, PhD Student – Resilience of resource movements to disruptive events

Mr Matthew Holmes, STREAM PhD Student – How do we ensure the assessment of infrastructure resilience is proportionate to the risk?

Further to this fantastic opportunity, a further round of meetings looking to develop collaborations between researchers at SMART, including former Newcastle-based PhD student and post-doctoral researcher Dr Tomas Holderness, and the Geospatial Engineering group at Newcastle, is being held at the SMART infrastructure facility between October 8th and 11th 2013. These meetings will look to focus on potential collaborative opportunities regarding network interdependencies between infrastructure networks, and also web-based data dashboards for visualisation and dissemination purposes.

Watch this space for more information…

What an Asteroid Belter!

As part of the British Science Festival 2013 being hosted at Newcastle University, researchers, staff, lecturers and students were invited to contribute to a comic being developed and designed by local comic enthusiasts. The comic was officially targeting children between the ages of 8-13, with a view to promoting STEM subjects and science in general. The proposed content of the comic had, you guessed it, a distinctly scientific theme to it, with organisers interested in hearing from those staff members who could fit their work (or at least make it look like their work fits) in to one of the following themes:

  • Robots
  • Explosions and danger
  • Dinosaurs
  • Space, time and travel
  • Very big and very small things
  • Things we eat, and things that eat us
  • Codes, ciphers and hidden messages
  • Heroes and villains
  • Matters of life and death

Some of the work related to networks, connectivity and infrastructure that is currently being conducted within the context of the Infrastructure Transitions Research Consortium (ITRC – www.itrc.org.uk) and also within the School of Civil Engineering and Geosciences, seemed like something that kids could be interested in, and the idea of presenting this type of work within a comic context offered an alternative and novel mechanism for communicating our research. Once an expression of interest in contributing to the comic had been lodged, it was simply a case of meeting an artist and writer assigned by the organising committee, and beginning to think about what a comic to represent networks, connectivity and infrastructure should look like! In fact, largely due to the expertise and imagination of the artist I had been assigned (Terry Wiley), the ideas began to come together, and rather than stick to the traditional panel-based approach we decided on more of a spider diagram affair to communicate how different bits of infrastructure are connected together. However I still wish we had managed to get our idea of slightly transparent paper with networks hidden until the page was held up to the light, to fly to communicate the idea of hidden or non-obvious connections! Oh well, maybe next time. For all those interested, the comic, entitled “Asteroid Belter”,  in hard copy format was distributed at the British Science Festival 2013 (7th-12th September), but more information about it can be found here.

Everything's Connected


Students “flood” to measure the BlueLine

The hosting of the British Science Festival 2013 by Newcastle University gave staff and researchers of the School of Civil Engineering and Geosciences a chance to “show off”  some of their research to the general public, whilst also gave the opportunity to generate interest in science, technology, engineering and maths (STEM) subjects via hands-on activities delivered to school children from the North East. One such activity, named “BlueLine”, organised and delivered by Dr Geoff Parkin (Senior Lecturer in Hydrology), Professor Hayley Fowler (Professor of Climate Change Impacts), Dr Vedrana Kutija (Lecturer in Computational Hydraulics), Dr Claire Walsh (Researcher in Water Resources), Mr Vassilis Glenis (Researcher in Water Resources), Mr Philip James (Senior Lecturer in GIS), and Mr David Alderson (Researcher in GeoInformatics), focussed on explaining the complex nature of flooding and extreme flooding to separate groups of secondary school children from local schools in the North East. The schools represented are listed below:

–          Shotton Hall Academy, Peterlee

–          Berwick Academy, Berwick

–          Ponteland High School, Ponteland

–          Thomas Hepburn School, Felling

The sessions began with Dr Parkin delivering a brief summary of some of the causes of flooding and extreme flooding, citing many references that relate to flood events experienced in recent years within the UK, including those that occurred in Cumbria in 2005, Tyne and Wear in 2008 and 2012, and many others. However that was just the standard “in-class” part of the activity, and although the seminar generated interest from the students in such topics as the water cycle, climate change, global warming, and the impacts of flooding, the “really” interesting part came when the children were let loose outside on the University campus, to take part in a crowd-sourcing exercise.

Crowd-sourcing in it’s most simple terms involves members of the public contributing data, information, comments, stories, pictures etc, which are then subsequently used within some form of analysis. Within the School of Civil Engineering and Geosciences, there has been a concerted effort since the flooding in a local market town, Morpeth, in 2008, by water and geomatics researchers and lecturers alike to collect as much crowd-sourced based information about flooding and flood events that occur within the region. The contributions from the general public about the locations and timings of floods, alongside photography giving a reasonable indication of flood depths, levels and wrack lines, can be used to validate computer simulations of flood models, developed within the School. Some of the results of these crowd-sourcing endeavours can be found here.

So the purpose of crowd-sourcing in the context of flooding was explained to the students in attendance at the Blueline event, and how it can be used to help better understand how a flood propagates through different environments. Since the floods in 2008 and 2012, Philip James has developed an Android-compatible “app” that helps to facilitate this process, by allowing a user to use the location technologies within an Android device (tablet, smart phone etc) to locate themselves, and then subsequently use the camera to take a picture. The great thing about the app is that this data can then be sent to a server and published immediately onto a website, giving a near-real time record and subsequent archive of a flood event. As stated, this type of data is invaluable to understanding how a flood arises and then subsides. For more information about the app and the technologies employed to deliver this solution, have a look here.

So the school children were escorted outside where a “pretend” flood had been erected around Newcastle University campus (effectively just a line of blue tape indicating a flood level based on a particular amount of rainfall), and asked to use the app and a tape measure to record information about the depth of this “flood”. This seemed to go down a storm (sorry) as it offered them a chance to do all the things that children seemingly would rather be doing i.e. being outside and playing with technology! Each pairing were asked to try to record at least one reading at each point where we stopped around campus. Further to this a series of QR codes had been erected along the blue line that the students were able to scan, subsequently directing them to a site of historical photography of the flooding that occurred on campus in 2012, as well as some “constructed” imagery of the imaginary flood that they were measuring. For more information on this site and the photos, please follow this link.

BlueLine
BlueLine

BlueLine
BlueLine
The “BlueLine” around campus Imaginary flood on campus
   
Real time Flood Map Flood App Framework
 
Campus Flood Map


British Science Festival 2013

Infrastructure dashboard prototype: Economics and Demographics Data Dashboards

In an attempt to begin to think about how some of the data being generated by colleagues within the Infrastructure Transitions Research Consortium (ITRC) could be visualised, I started by considering how to visualise the seed projections that are used as inputs to the infrastructure capacity and demand models (CDAM) that have/are currently being developed by different institutes within the consortium. To find out more information about this aspect of the consortium please follow this link. The demographics projections have been developed by Leeds University, and give indications as to the number of people living in each government office region and local area district within the UK, out to the year 2100. Alongside this standard variable, projections for the quantity of urban area and number of households are also calculated and provided, although at this stage they are not being fed in to the CDAMs. The economics projections, developed by Cambridge Econometrics, contain many variables with reference to employment levels, imports/exports, gross value added (GVA) by industry, energy use by different fuel users, and many others. Each of these variables is supplied along a similar timescale to the demographics projections, whilst some are also disaggregated from UK-wide values to the government office region level. The following variables from the economics projections are supplied with this spatial disaggregation:

–          GVA by region and industry

–          Household expenditure by consumption category and region

–          Investment by investing sector and region

–          Employment by industry and region

The two data sets themselves are supplied in either comma-separated value (.csv) format, or via the use of the netCDF (.nc / .cdl) formats. In order to store these data, and then subsequently query them, the data is loaded via a Django-powered web form in to a PostGIS-enabled PostgreSQL relational database. The web form uploading process attempts to validate the values supplied within each of the projection sets against sensible ranges of values for each variable such that any erroneous data values can be detected. This approach ensures that the data is stored alongside other data related to the consortium, such as the infrastructure network models, and subsequently makes it quite (!) straightforward to create a web-based visualisation dashboard / platform for the data. The chosen web framework, Django, is Python-based and natively allows connections to PostgreSQL/PostGIS-enabled databases.

Both sets of projections, demographics and economics, are similar in nature in that they have a mix of UK-wide outputs over time, as well as a mix of spatially disaggregated outputs. I therefore chose to include the ability to view both a map, as well as charts and plots to give a user access to as much of the information as possible, without overloading them, within a single web page. In order to achieve this, a series of Django-enabled, and just standard SQL queries were developed to deliver data from either of the projections sets as JSON to the webpage. The webpages themselves (one each for demographics and economics respectively) communicate to Django via a synchronous AJAX request, which is all handled and powered via the use of the JavaScript framework, jQuery. Each webpage offers the user a series of dimensions or options that they can choose from, resulting in a new request being sent to the server to retrieve data matching against the chosen criteria. The following table represents the options available to a user for the two different interfaces:

Demographics Dashboard Economics Dashboard
Data:–          Demographic projections – number of people in each government office region, or local area district

–          Proportion of urban area projection – the percentage of each government office region, or local area district considered as urban

–          Change in the proportion of urban area projection – the change in the percentage of each government office region, or local area district considered as urban.

–          Household projections – the number of households in each local area district


Data:–          Economics projections – a set of different economic-focussed variables in relation to employment, consumption, energy use and much more
Scenario – a user can select from a drop down list of scenarios that have been uploaded to the database. Each set of demographic data represents a different scenario of demographic change, and each value within the database references which scenario to which it is related. The different scenarios are generated by using different values for the attractors and detractors that make a region or district more or less attractive to reside in. Scenario– a user can select from a drop down list of scenarios that have been uploaded to the database. Each set of economics data represents a different scenario of economic change, and each value is referenced against a particular scenario. In the case of the economics projections, each scenario represents a different combination of inputs for:-          Population-          World Economic Growth

–          Fossil Fuel Price

Time – a drop down list of available years of data Time – a drop down list of available years of data
Location – depending on the user’s selection of scenario, a drop down list of government office regions or local area districts is presented. The selection of a particular location is also possible via direct interaction with the map interface itself. Location – as previously described, only a subset of all economics variables are disaggregated to the government office region level, and these regions are presented via a drop down list. Similarly to the demographics data dashboard, a location of interest can be selected by interaction with the map interface itself, as well as via the drop down list.
Number of equal-interval map classes – this option allows a user to determine the number of equal-interval classes to use when mapping the data satisfying the matched criteria defined by the user.
Adjust overlay transparency – this slider allows a user to increase or decrease the transparency of the overlay map displaying the projections to allow them to more easily see the underlying base map layers provided. This for example can be used to help the user orientate themselves on a particular area of the UK, before seeing the overlay of chosen demographics or economics values.
Gender – when selecting the standard demographics output i.e. the number of people in each region or district, this option determines whether the displayed map is showing projections for males, females, or both i.e. the total population. Variable– the user is able to select from a drop down list of 18 possible variables to retrieve maps and charts about. The particular choice of variable determines which combination of the following options can subsequently be selected:-          sector

–          regional industry

–          fuel user

–          fuel type

–          consumption category

–          UK-wide investment sector

–          Regional investment sector

–          UK macro economic indicator

–          region


Age category – similarly to the gender option, when selecting the standard demographics output, this option determines which age category is being mapped. Each category represents a 5 year cross-section of the population, ranging from 0 to 90+.
Normalisation – this option allows a user to tell the displayed map to create equal-interval classification bounds based on other values that also satisfy the user’s selected criteria. For example a user could wish to normalise based on values for males/females for a particular region or against the whole of the UK.


As a user is changing the combination of the afore-mentioned options selected, whether for the economics or demographics data projections, a new request is sent to the server to query the database. Once the JSON data matching the selected criteria is returned to the webpage, JavaScript alongside the use of the HighCharts JavaScript-based graph library are employed to create the charts and graphs of the time series data. I selected HighCharts as it offers some fantastic, out-of-the-box functionality such as the slick animations activated when new data is supplied, or the hover-over tooltips to return actual data values. HighCharts however is a paid-for product, but has been used here as the work falls under the academic/research use. Furthermore, it is pretty straightforward to coerce the JSON output from the database in to something that HighCharts can handle. The maps themselves are created via the use of the OpenLayers JavaScript mapping client, largely employing the client-based vector layers and features for the rendering, rather than employing a WMS to serve the data. However it is possible that in the future a WMS version of the data streams will also be needed, probably employing Geoserver to do the leg work for this.

The following images illustrate the demographics and economics dashboards in their current form:

Demographics Data Dashboard


Economics Data Dashboard (household consumption)


Economics Data Dashboard (energy demand by fuel user and type)


Economics Data Dashboard (employment by industry and region)


Please note that all the values displayed in the charts, plots and maps within the previous four images of the different dashboards are indicative only.