Sometimes it is more effective to represent figures in graphical form. One form of representation that is tricky to get right is proportional sizes of shape (square or circle) to illustrate the difference in size. For example, if you want to show one figure is twice the size of another, it is easy to create a circle that has a diameter twice as long as another, but this will be more than twice the volume, thus misrepresenting the difference.
The form at this link from think outside the box helps determine the correct relative size for shapes. You can then produce proportional shapes with an art package or PowerPoint to create your graphic.
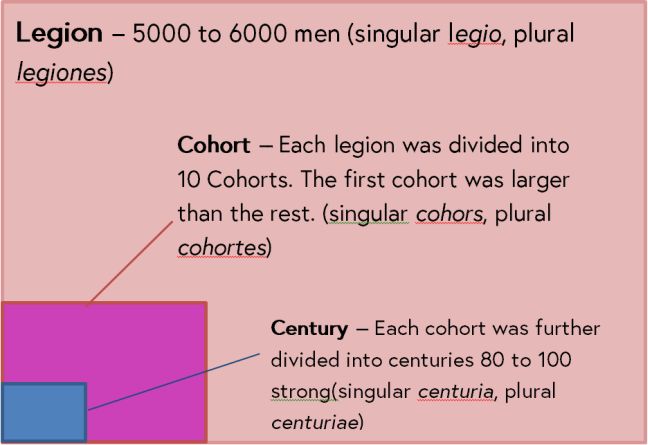
This is one example showing the sizes of legions, cohorts and Centuries within the Roman army

