The Geospatial Engineering research group and the recently established Spatial Analytics and Modelling lab (SAM) at Newcastle, along with the Geospatial Institute at Nottingham University, have been awarded a prestigious EPSRC Centre for Doctoral Training in Geospatial Systems. The CDT will train a national cohort of over 50 interdisciplinary geospatial engineers, scientists and practitioners that will help deliver the collective benefit of geospatial data and technology to the UK. The CDT is a unique opportunity for academia to work with the geospatial industry and wider applied user base to ensure that the UK prospers in a global geospatial market experiencing rapid growth, and to address major global societal issues, such as climate change impacts, urban sustainability, spatially resourcing public health, and removing spatial barriers to social inclusion and healthy aging. The CDT will provide specialised training in geospatial technology, data management, analytics, simulation and visualisation, and also develop student’s skills in the advanced computing technologies and AI approaches that are transforming the use of geospatial data; knowledge and skills that will underpin their 3-year interdisciplinary PhD-project. The world leading interdisciplinary geospatial research and expertise established by Nottingham’s Geospatial Institute and Newcastle’s Geospatial Engineering group and the £2.25million investment in the Spatial Analytics and Modelling lab (SAM) at Newcastle with the aim to foster interdisciplinary geospatial research between engineers, social scientists, computer scientists, mathematicians and statisticians and the medical sciences were key to the success of the award of the CDT.
In what is the week of #gisday we can now announce that that registration for GISRUK 2019 is now open – see our website for prices and a link to register! (Prices start from £150). And we have announcements lined up for later in the week too!
Alongside registration we have also opened up the application process for our early career scholarships which we are offering to eligible candidates. To be qualify you must be a lead author on a submission, be a student (masters or PhD) or an early career researcher (with less than 3 years experience). For more details, and to apply, see our website.
If you missed our call for papers, announced on the 9th October, there is still plenty time to get your submissions in with the deadline being the 18th January. We have already had a few submissions, so if you want more information, there is details about this years call on our website. (We also have a flyer if you want to help spread the word A5 or A4).
More details about our keynotes will be announced very shortly – the first hopefully this week!
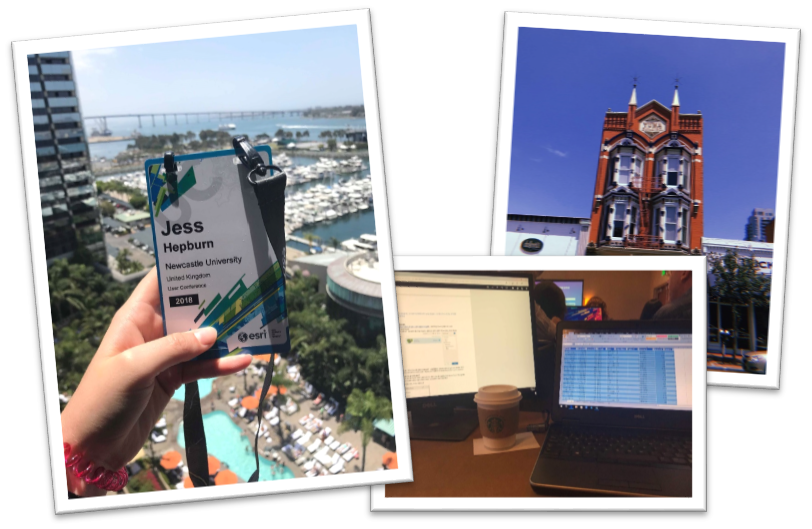
In April, I submitted a Story Map to Esri UK titled ‘Geovisualising Environmental Impact Assessments’; this explored the work I completed in my undergraduate dissertation and how this led on to my current PhD work. When I received the call that I was successful I felt a whole series of different emotions – excited, nervous, motivated, and overwhelmed. But, nevertheless unbelievably eager to be one of the 16,000 attendees at the 2018 Esri User Conference in San Diego. I am going to tell you my top five moments I had whilst attending the UC.
Once I arrived in San Diego and had settled down by gaining my bearings and stocking up on some snacks, the Education Summit began. I collected my badge and started to make my way over to the hotel. The first stand out moment for me were the workshops held at the Education Summit. These either 30 or 60 minute sessions gave me an understanding into areas of the programs that I hadn’t considered. Which included Insights for ArcGIS, transferring data from ArcGIS Pro to Online and creating dashboards using data from Survey123. The information from these sessions was invaluable as it allowed me to fully understand how the Esri platform would be able to help support my current PhD research work as well as engage with stakeholders and the general public. The Education Summit was also a great opportunity to speak to the fellow recipients of the Jack Dangermond Young Scholar Award as well as academics and students from around the world.
Sign up, Education Summit and looking around San Diego
After a busy couple of days at the Education Summit it was then time for the main event… THE ESRI UC, with over 1000 sessions, 450 hours of GIS training & 300 exhibitors! But, before all of that started was my second stand out moment; The Plenary, led by the President of Esri, Jack Dangermond. This was an experience I will never forget, the hall was massive, full of screens covered in maps and GIS-users from across the globe. This session lasted all day and it really captivated me, making me realise how much of an impact my work can have and how applicable GIS is across the world in nearly every discipline. Some of the guest speakers were really inspiring; including Felix Finkbeiner who set up at the age of 9 initiated Plant-For-The-Planet in 2007. His aim is for children to plant 1 billion trees to offset their own carbon emissions. He had harnessed the power of GIS to make an incredible difference, contributing to saving our planet.
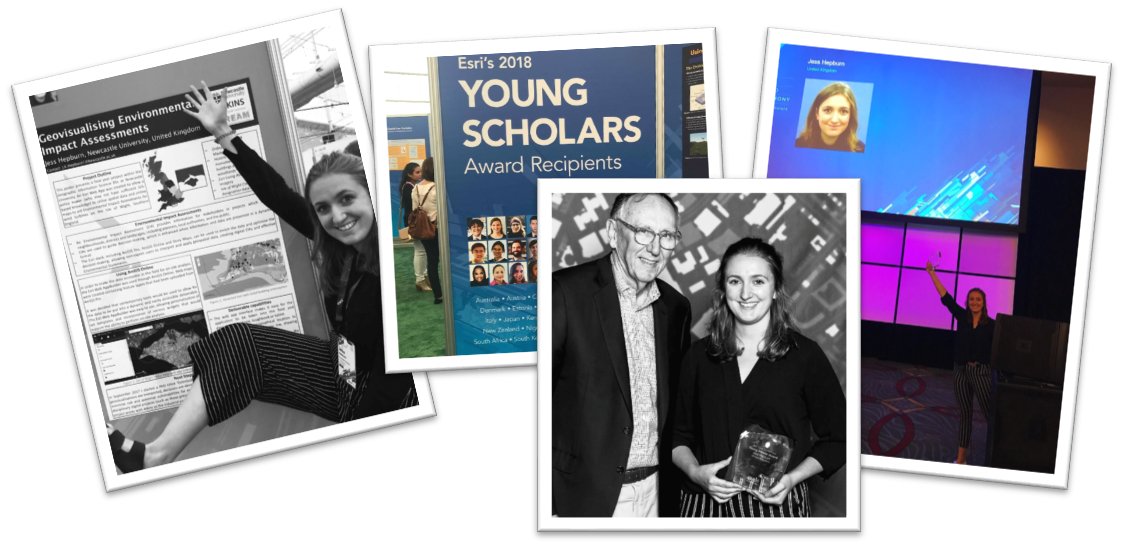
The Plenary was followed by the Map Gallery, which was the third stand out moment in my time at the UC. This provided an opportunity for me to show the poster I submitted along side the other Young Scholars, interact with other attendees to discuss my work and look at 100’s of stunning maps submitted to the Map Gallery. This was a fantastic networking opportunity, I spoke to people from all over the world about my work (and gaining some great connections on LinkedIn). As well as chatting about the GIS education I received at Newcastle University and my PhD program through the DREAM CDT.
Map gallery as a Young Scholar and receiving my award from Jack Dangermond
Throughout the week I attended a vast number of sessions. Using the app, I was able to jam-pack my days from 8:30am – 5:30pm with a variety of sessions, discovering the expo and learning new skills through the digital workshops. This gave me an insight into the abilities on the Esri platforms as well as the capabilities and applications across a number of different sectors from exhibitors from across the globe. My fourth stand out moment was attending the Cartography sessions which reaffirmed my current knowledge and opened my mind up to exploring more of ArcGIS Pro. It introduced me to the MOOCs which are free from Esri to help improve and engage key cartography skills – I’ve signed up for two to complete over this academic year.
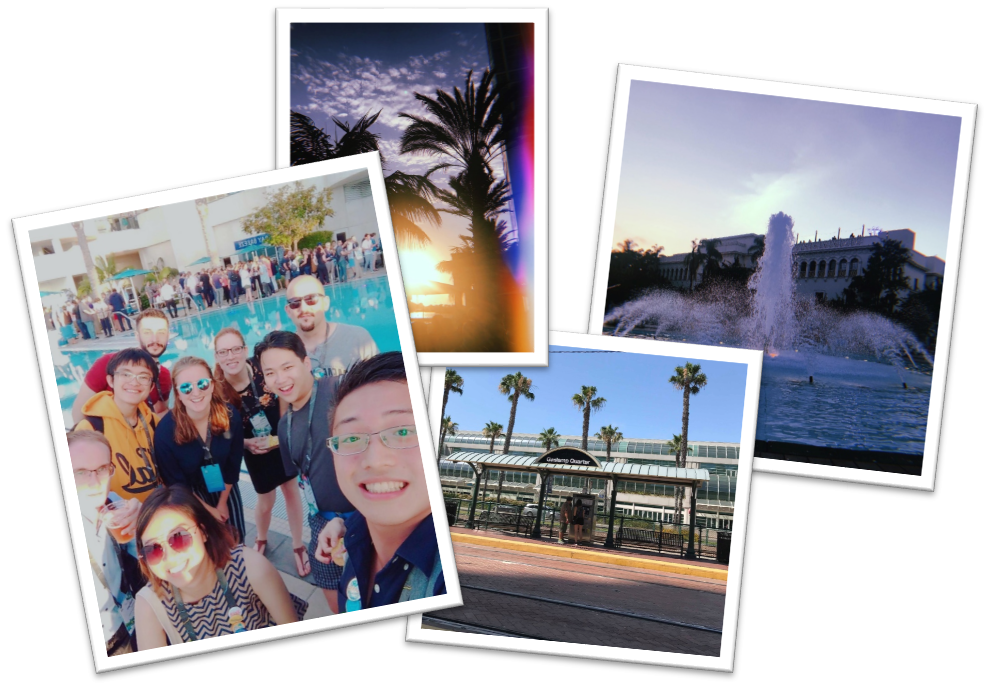
Social events, including the Young Professionals Network and Balboa Park Party
As well as all the fantastic academic and informative opportunities, there were some great social events that were my fifth stand out moment. The Young Professionals Network (YPN) allowed for interaction with young GIS professionals from around the world. It was interesting to meet a wide variety of people in a fun and fresh environment. There was great upbeat music, food and company! On the Thursday night, a party was held at Balboa Park; which was massive. The park contains a variety of museums, all open for free – with music, drinks and food from different areas of the world. It was great to explore with the fellow young scholars, with a good dance at the main stage – ending the week perfectly. Overall, I had a once in a lifetime experience in San Diego at the Esri UC, it opened my eyes to so many new possibilities and demonstrated how highly GIS is regarded across the world. I would like to thank Esri UK for this fantastic opportunity and would recommend anyone to apply!
Link to the Esri Education Newsletter, giving details of next years competition:
Last week we hosted the DREAM CDT (Centre for Doctoral Training in Data, Risk And Environmental Analytical Methods) Challenge Week – an event each year, which brings together the students from across the four member universities to address a set challenge based around the themes of the CDT – big data and environmental risk. This year the students were asked to ‘design and undertake an agile prototype development of a real-time spatial hazard decision support tool for Newcastle-Upon-Tyne’. Data from both the Urban Observatory and the NISMOD-DB++ (National Infrastructure Simulation and Modelling Database) was made available, as well as technical advice from staff in both teams (all part of the Geospatial Group) on accessing and using the data through their API’s.
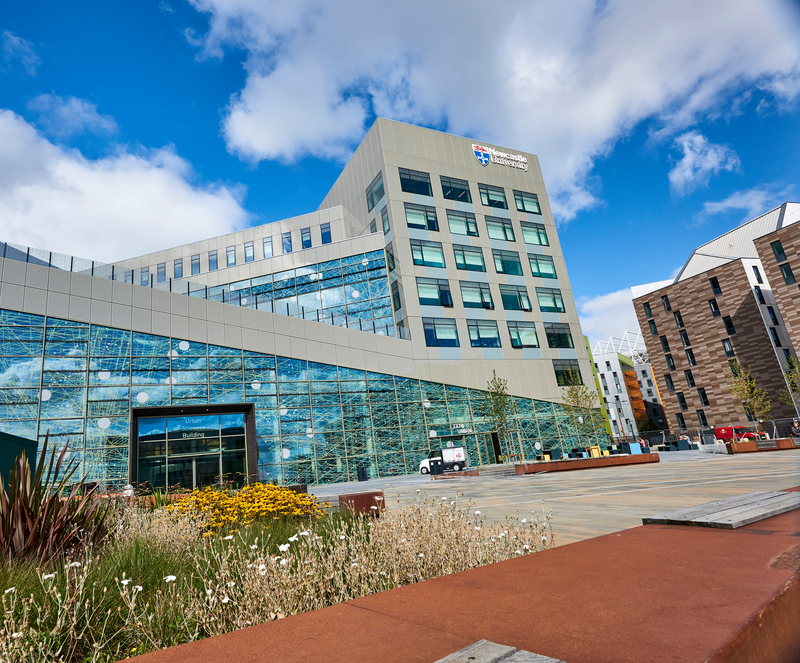
Urban Sciences Building, Newcastle University. The host venue for the week.
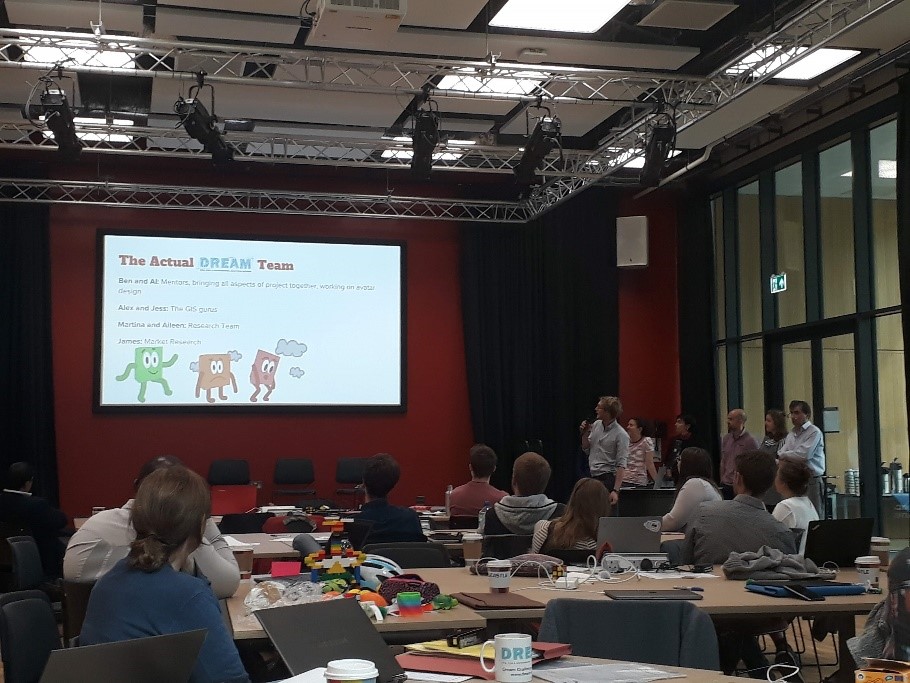
Three groups, containing a mixture of students at various stages of their PhDs, and from across the four universities, were set the challenge at lunch time on Monday, before presenting their work on the Friday morning. In between, they spent their time assessing the quality of data (and the API’s!), developing tools and models, and listening to a host of speakers – including Chris Jones from Northumbrian Water (Research and Development Manager) to staff from Newcastle University like Professors Chris Kilsby and Richard Dawson, experts in natural hazards. All groups produced some quality outputs while learning new skills along the way and becoming familar with new datasets. A summary of the work by the groups:
Group 1 – Investigated how real-time temperature data from the Urban Observatory, combined with historical data, could be used to alert emergency responders/decision makers/residents/family members of those locations where action was required when extreme temperature events appeared to be occurring. By using household characteristics data from the NISMOD-DB++ database, those communities which might be more vulnerable could be identified improving the effectiveness of the system.
Group 2 – Using real-time air pollution data from the Urban Observatory and Ordnance Survey road network data from NISMOD-DB++, the group designed and demonstrated an app which allows users to identify a route between destinations based on the exposure to air pollution and/or time. Ordnance Survey building heights data was also used, again via NISMOD-DB++, to improve the estimates of pollution levels on streets where no sensor data was available.
Group 3 – Like group 2, an app was developed to allow users to identify the least polluted routes between two locations, though this was focused on school children and had an educational element too. A user friendly interface was designed with the aim of encouraging children to learn about the harmful effects of pollution, and help identify routes from their homes to school that can help reduce their exposure risk. Again this used real-time data from the Urban Observatory as well as Ordnance Survey building and network data through NISMOD-DB++.
Group three presenting their work from the week
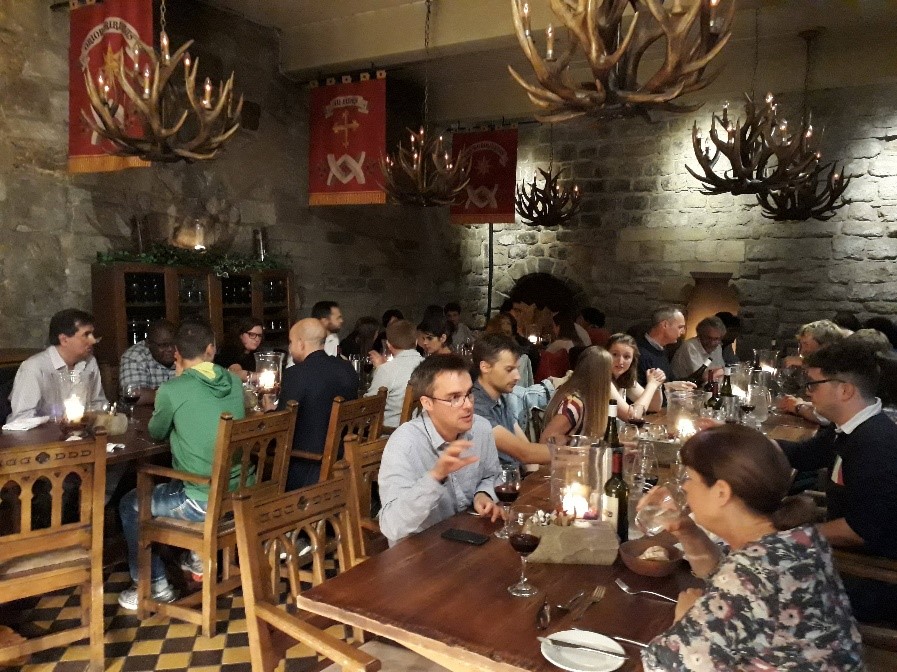
As ever, such events also involve a team bounding exercise, and on this occasion, this was a meal out in Newcastle at the Blackfriars restaurant on the Wednesday evening. With Newcastle being known as a bit of a party city, I will let you decide if the night stopped there on went on a little later into the night….
The organised meal in the Banqueting Hall at Blackfriars restaurant
Thanks to all the students who came along and actively enagaged embracing the set challange, to all presenters for giving up thier time, and to all staff from across the four universities who attended, all of which made the event a success!
For those who were not present at GISRUK 2018 this year in Leicester we are delighted to announce that we are hosting GISRUK (GIS Research UK) in April 2019! And for those that were at Leicester, what follows is a reminder about some of the key details.
The conference will be between 23 – 26th April, and will be hosted in the new Urban Sciences Building, one of the most (if not the most) sensored buildings in the UK. The conference theme has already been decided, and will be ‘From Data to Decisions’. More details about this, the programme, abstract submission process and registration will be announced in September.
We have also been busy organising the social events, from the conference reception to the conference dinner, and again we will announce more details about these soon.
Our website will be going live in September, but in the mean time please follow @GISRUK on twitter for the latest announcements, follow #GISRUK2019 or follow us at @GeospatialNCL. To get in contact with any queries email us at GISRUK2019@newcastle.ac.uk or contact us on twitter.
We look forward to hopefully seeing many of you hear next year!
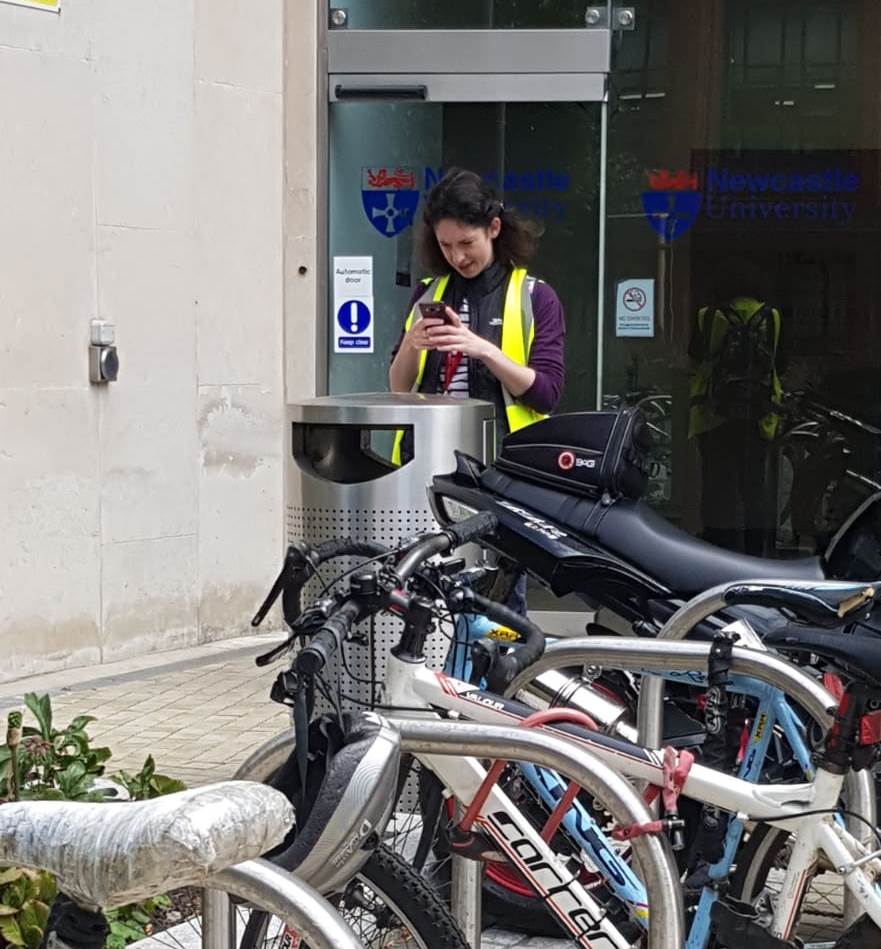
The Mapping the World project last week saw 15 year 10 and 12 students from 4 local schools experience University life as a Geomatics student. Students were introduced to the world of geospatial engineering and learnt about how GIS is used in their everyday life (think snapchat maps), and how to measure height change of land using levelling. The hi-vis jackets (or wally jackets as we like to call them) proved very popular with the flies on Exhibition Park but not so much with the students wearing them!
Casually mapping the bins on campus…
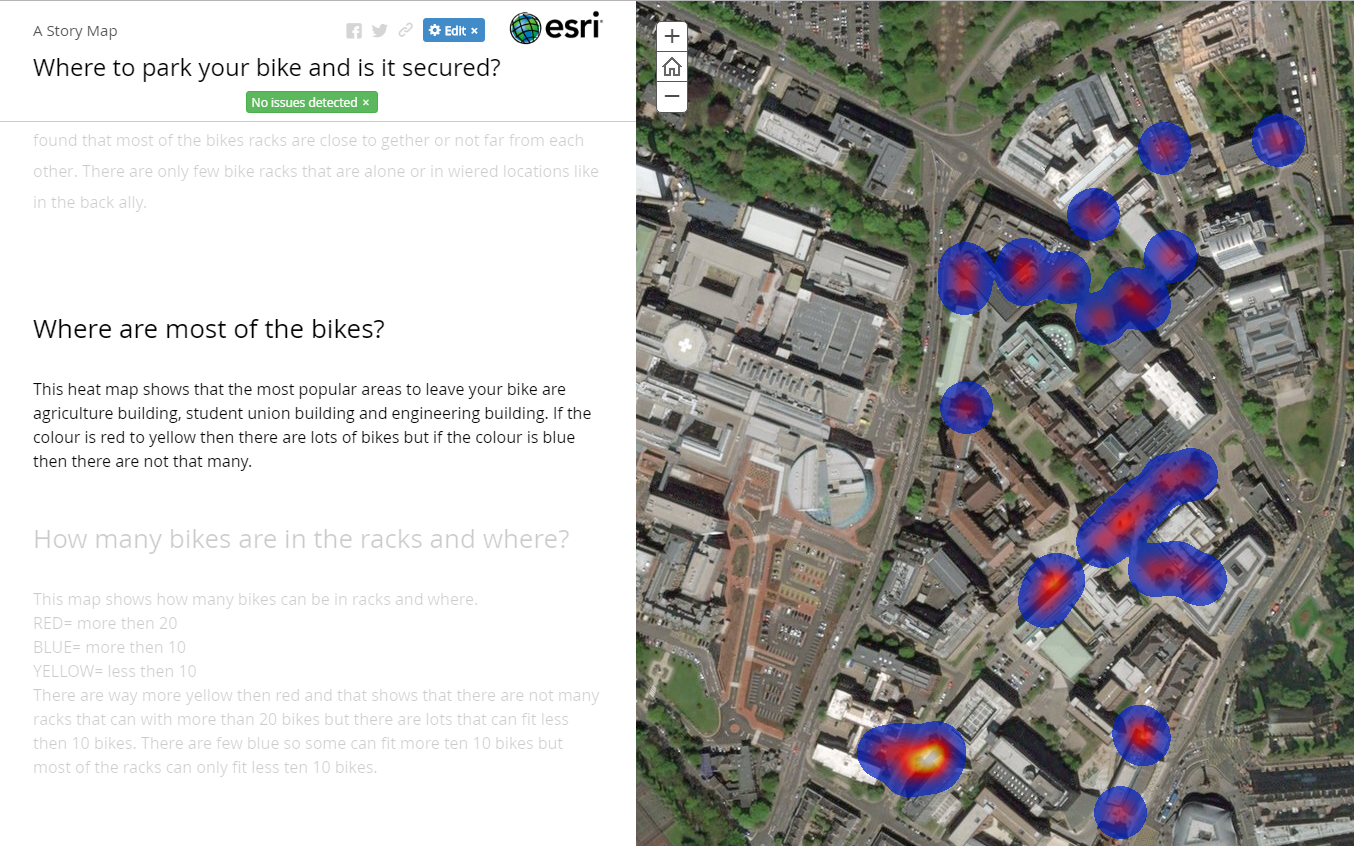
Using ArcGIS Online and the Survey 123 app students investigated how GIS can help with asset management around Newcastle University campus. Students were given free rein on which aspect of campus management they would like to investigate, projects covered everything from where to store your bike, where are the comfiest seat on campus and disability access routes. After exploring the campus whilst mapping, students concluded by presenting their findings using Story Maps to show off all their hard work. It was great being part of the Futureme programme inspiring the next generation to go into higher education.
A heatmap of bike storage locations and there popularity, one of the many maps produced by the students with their own data.
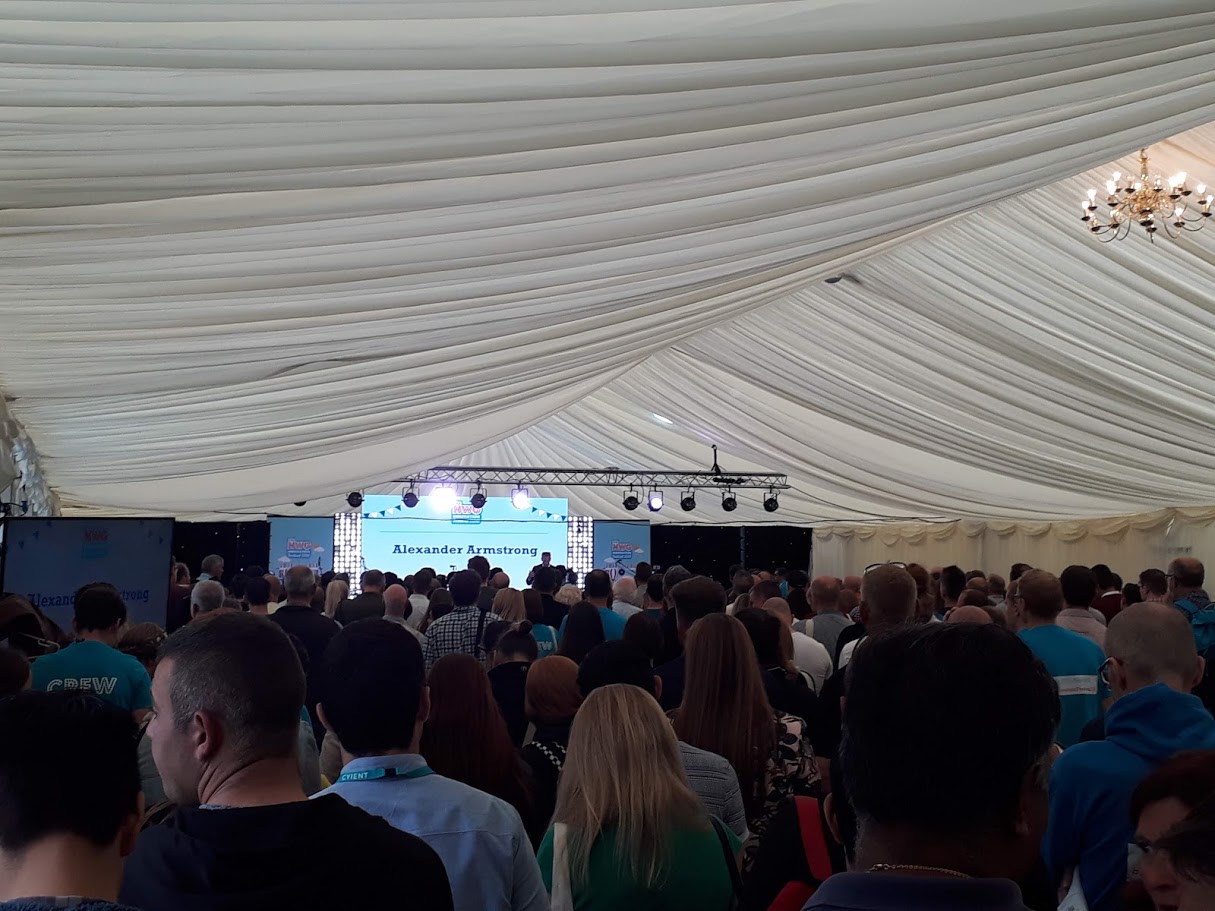
Last week myself and a group of us attended the Northumbrian Water Group (NWG) Innovation Festival (#InnovationFestival18), intended to bring people from different areas together to think about and tackle challenges within the water industry (with a focus on NWG). More intriguingly Newcastle University had sponsored one of the 12 sprints, a sprint running all day for the full five days with the idea of developing concepts to solve a problem, with this in particular sprint focused on digital twins (#DigitalTwins). Other sprints included how utilities could better work together to map underground assets and one focused on how can we create a happier and more productive workforce. This was not a small event, with over 2000 people attending and over 500 business involved. In true festival style, the week began with a compulsary participation in a sing-along to ‘The greatest showman’…..
Crowds in main tent (the ‘Thunderdome’) to see guest Alexander Armstrong (of pointless fame).
Great ideas were bounded around, with people involved ranging from those in management positions in NWG, to researchers like myself all who had varied skills and interests, to NWG customers themselves! Ultimately in the Digital Twin sprint where we were most involved, great ideas were devised as to how these could help NWG, from devising a single database system as ‘a single source of truth’ to developing a digital twin for incidents such as bursts as well as one for the whole company for modelling the communication and data flows through personnel. I’m sure across the other 11 sprints more great ideas were involved, with NWG now left with the not so small job of deciding which of these to follow up on!
Work on a #DigitalTwin of a pipe burst which occured a couple of months earlier on the NWG network.
On Tuesday Polpreecha Chidburee successfully passed his viva for his thesis entitled “Landslide monitoring using mobile device and cloud-based photogrammetry” (subject to minor revisions). Professor Phil Moore (internal) and Professor Jim Chandler (external, Loughborough University) were the two examiners. Polpreecha is now returning to Thailand to take up a lectureship position at Naresuan University. Well done and good luck in the future!
Thesis abstract:
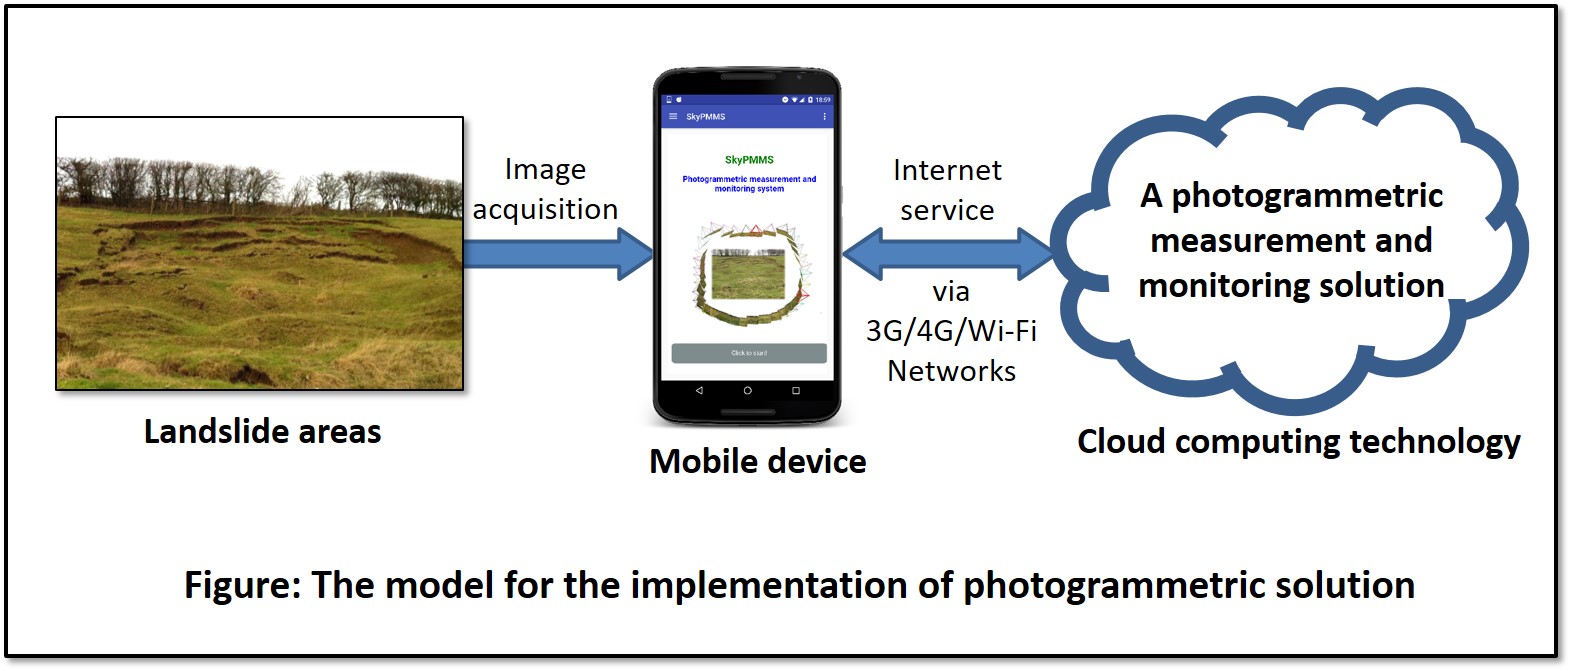
Landslides are one of the most commonly occurring natural disasters that can cause a serious threat to human life and society, in addition to significant economic loss. Investigation and monitoring of landslides are important tasks in geotechnical engineering in order to mitigate the hazards created by such phenomena. However, current geomatics approaches used for precise landslide monitoring are largely inappropriate for initial assessment by an engineer over small areas due to the labour-intensive and costly methods often adopted. Therefore, the development of a cost-effective landslide monitoring system for real-time on-site investigation is essential to aid initial geotechnical interpretation and assessment.
In this research, close-range photogrammetric techniques using imagery from a mobile device camera (e.g. a modern smartphone) were investigated as a low-cost, non-contact monitoring approach to on-site landslide investigation. The developed system was implemented on a mobile platform with cloud computing technology to enable the potential for real-time processing. The system comprised the front-end service of a mobile application controlled by the operator and a back-end service employed for photogrammetric measurement and landslide monitoring analysis. In terms of the back-end service, Structure-from-Motion (SfM) photogrammetry was implemented to provide fully-automated processing to offer user-friendliness to non-experts. This was integrated with developed functions that were used to enhance the processing performance and deliver appropriate photogrammetric results for assessing landslide deformations. In order to implement this system with a real-time response, the cloud-based system required data transfer using Internet services via a modern 4G/5G network. Furthermore, the relationship between the number of images and image size was investigated to optimise data processing.
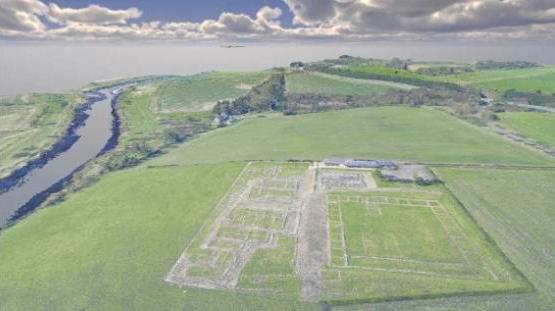
The potential of the developed system for monitoring landslides was investigated at two different real-world UK sites, comprising a natural earth-flow landslide and coastal cliff erosion. These investigations demonstrated that the cloud-based photogrammetric measurement system was capable of providing three-dimensional results to sub-decimetre-level accuracy. The results of the initial assessments for on-site investigation could be effectively presented on the mobile device through visualisation and/or statistical quantification of the landslide changes at a local-scale.
Cultural heritage has large historical, social, and anthropological values and is an important enabler of sustainable development. Join researchers at Newcastle University in exploring how technologies, such as remote sensing and 3D printing, are used to safeguard the world’s cultural heritage for future generations.
The event is free to attend, however you need to register here.
The event is on the 26th July at 1 Science Square, and will start at 7pm.
Once again a discussion at the coffee break posed an interesting question. Is this the closest the relegated teams have been to each other in the history of the Premier league. Some quick googling suggested it probably wasn’t and 2011-12 would be the closest with the 3 relegated clubs being Bolton Wanderers,Blackburn Rovers and Wolves. And much like last time I wasn’t content with guesswork and wanted to try and calculate this properly.
As a Norwich City fan relegation is something I’ve grown very used to
From the previous blog post I had the locations for all of the football league grounds ( one caveat is that i haven’t considered that the clubs may have played at a different ground [although I did use Selhurst Park for Wimbledon and not Milton Keynes ) . so it was a very simple piece of analysis where i used PostGIS to calculate the distance between each of the relegated clubs and summed the value together per year.
From the results below you can see that the guess was correct and 2011-12 did have the shortest distance with 16-17 coming second.

 The Geospatial Engineering research group and the recently established Spatial Analytics and Modelling lab (SAM) at Newcastle, along with the Geospatial Institute at Nottingham University, have been awarded a prestigious EPSRC Centre for Doctoral Training in Geospatial Systems. The CDT will train a national cohort of over 50 interdisciplinary geospatial engineers, scientists and practitioners that will help deliver the collective benefit of geospatial data and technology to the UK. The CDT is a unique opportunity for academia to work with the geospatial industry and wider applied user base to ensure that the UK prospers in a global geospatial market experiencing rapid growth, and to address major global societal issues, such as climate change impacts, urban sustainability, spatially resourcing public health, and removing spatial barriers to social inclusion and healthy aging. The CDT will provide specialised training in geospatial technology, data management, analytics, simulation and visualisation, and also develop student’s skills in the advanced computing technologies and AI approaches that are transforming the use of geospatial data; knowledge and skills that will underpin their 3-year interdisciplinary PhD-project. The world leading interdisciplinary geospatial research and expertise established by Nottingham’s Geospatial Institute and Newcastle’s Geospatial Engineering group and the £2.25million investment in the Spatial Analytics and Modelling lab (SAM) at Newcastle with the aim to foster interdisciplinary geospatial research between engineers, social scientists, computer scientists, mathematicians and statisticians and the medical sciences were key to the success of the award of the CDT.