We’d like to share an important update about how student engagement data is presented in NULA. The metric previously labelled ‘Attendance’ has now been renamed to ‘On campus engagement’.
This change is now live in the system.
Why we’ve made this change
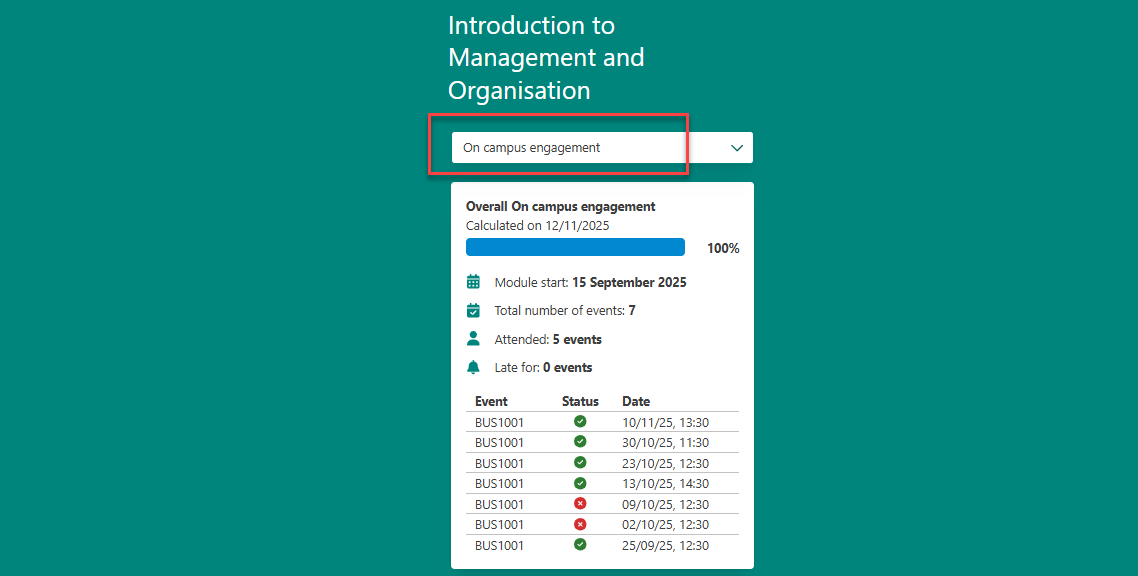
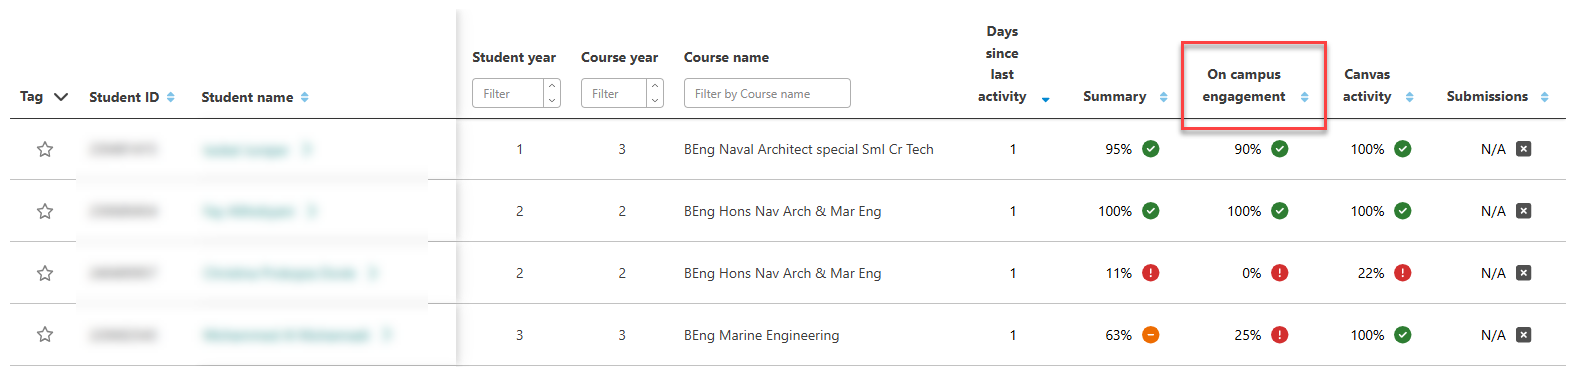
The ‘Attendance’ metric in NULA shows a student’s engagement across all in-person, timetabled sessions available to them in their active modules — including both monitored and non-monitored activities.
Because this metric reflects more than just formal attendance, we felt that ‘On campus engagement’ better captures the full picture of a student’s participation in scheduled learning opportunities.
What this means for staff and students
Students will notice only a label change — from ‘Attendance’ to ‘On campus engagement’. There are no changes to the underlying data or calculations.
We’ve updated this terminology consistently across:
We’ve also expanded our messaging to students to make it clear that the on campus engagement metric is not a formal attendance record and will not impact academic records.
What this looks like
In the student interface:
In the staff interface:
Supporting student understanding
We will be communicating this update through our student channels, but if students come to you with questions, please feel free to use or adapt the message below:
Your ‘on campus engagement’ in NULA shows the opportunities available to you to take part in all timetabled events in your active modules. This gives you a clearer picture of your overall engagement and can help you notice any gaps so you can make informed choices about how you learn.
Please note that ‘on campus engagement’ data in NULA is not your formal attendance record and will not impact your academic record.
The system is designed to give you real-time insights that support your learning and any conversations with your personal tutor or support teams. It is not used in a punitive way.
If something does not look as expected, it may be due to data processing delays or how activities have been recorded.
For more information, please visit the NULA pages on the Academic Skills Kit website.
The Learning Enhancement and Technology (LET) Team in the Learning and Teaching Development Service (LTDS) were joined by colleagues from NUMBAS, Library Reading Lists, Digital Adoption, FMS Technology Enhanced Learning (TEL) Team and representatives from the Artificial Intelligence (AI) in LTDS.
The LET Team were delighted at the turnout on the day and the fantastic conversations that were able to take place. Find out more about the event and what colleagues thought about the event within this blog post.
As we begin the new academic year, NULA has introduced a range of new features and enhancements in the staff-facing system designed to make learning analytics more accessible, informative, and useful. These updates build on feedback from colleagues and aim to provide clearer insights into student engagement, easier navigation of the system, and more practical tools to support tutoring conversations.
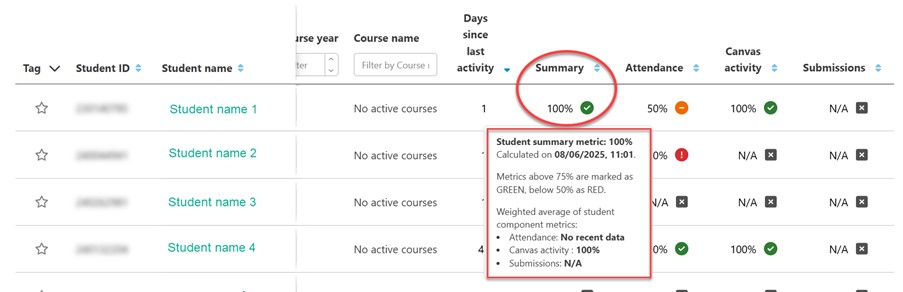
Metric help pop-over
To make NULA’s metrics clearer and easier to interpret, a new metric help pop-over has been introduced. This feature provides quick, accessible explanations of each engagement metric—such as attendance, Canvas activity, submissions, and days since last activity—along with the data sources used to calculate them. By simply clicking on the hotspot icons in the student list or student overview pages, staff can see detailed guidance without leaving the page.
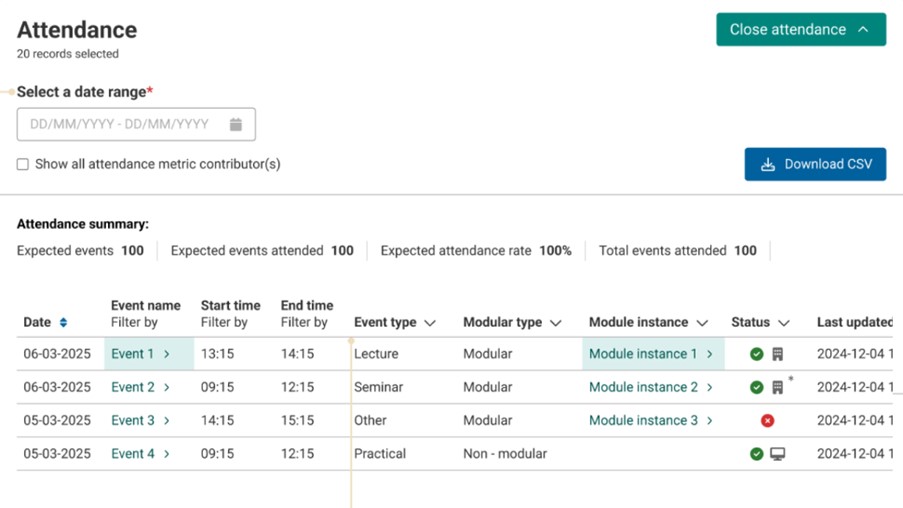
Student attendance grid view
The student attendance grid in the student overview has been upgraded to give staff more flexibility and clearer insights. Instead of a fixed 30-day snapshot, colleagues can now filter attendance by a date range, with a simplified table view, making it easier to spot patterns that matter in student conversations.
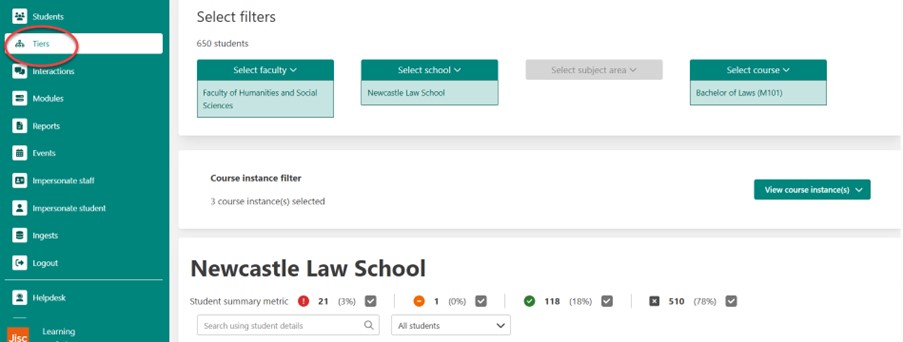
Tiers
The new Tiers feature makes it easier to filter and navigate student data by School, Faculty, or course. Depending on their role within the system, this means staff can quickly focus on the level of detail most relevant to them, whether looking across a whole Faculty or drilling down to a single course. Tiers also pave the way for more granular engagement metrics, giving a clearer picture of how students are engaging.
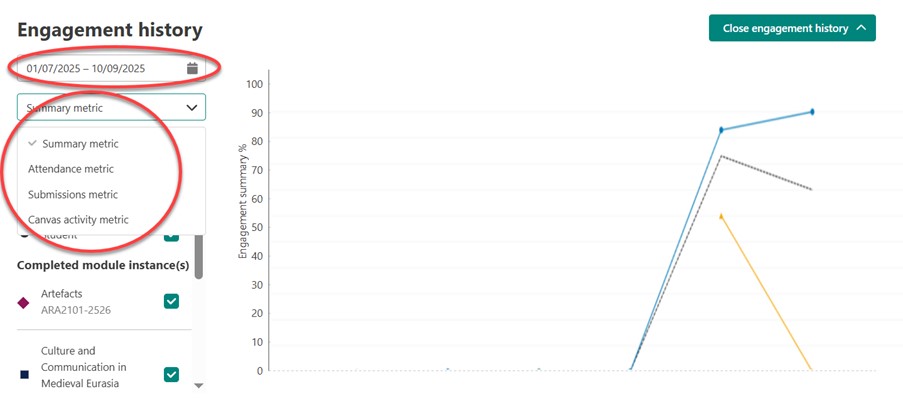
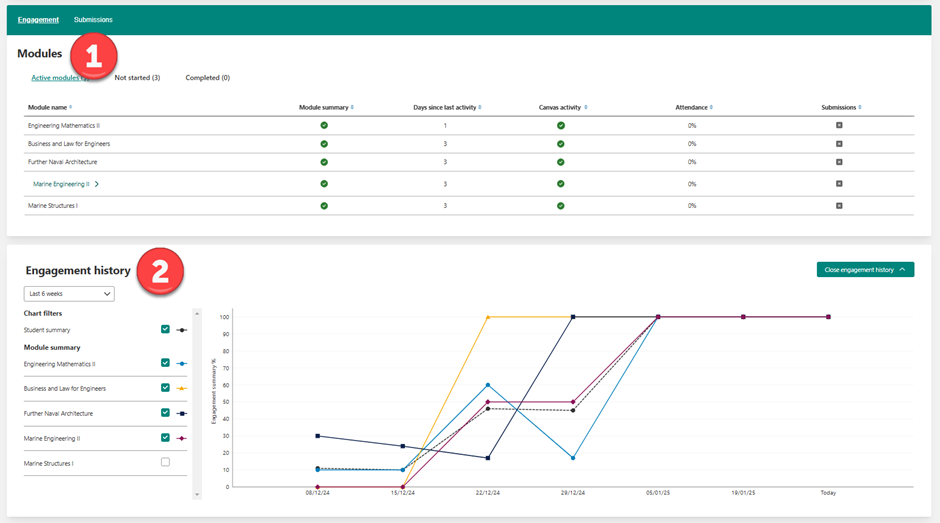
Student Engagement history
The student engagement history on a student overview page has been enhanced to give staff greater flexibility when reviewing patterns over time. You can now apply date range filters to focus on specific periods and choose to view individual data sets—including attendance, submissions, or Canvas engagement—separately. This makes it easier to spot trends, identify changes in behaviour, and have more informed conversations with students about their engagement.
These updates improve NULA’s usability and provide staff with clearer, more flexible insights into student engagement. Additional features and enhancements will be introduced throughout the year, continuing to expand the system’s capabilities and support for staff and students.
By Em Beattie, Stage 2, Geography, Politics and Sociology student
This summer I worked as an intern for the learning analytics team. The learning analytics team has been developing a new system for Newcastle University students to allow them to review and have access to their own learning analytics data. Learning analytics refers to the measurement, collection, analysis, and reporting of data, for the purpose of understanding and improving students’ learning. Student’s data is collected from a variety of sources to enable students to view their attendance, engagement and module summaries. The aim of this new roll out is to empower and positively impact students’ academic achievement and progress for smarter insights and stronger outcomes.
My key role was to contribute to the methodology and development of student communication channels, organise pop ups, analyse and manipulate data, contribute to design and evaluation of material and present findings. I really wanted this experience to develop my career skills, and I am passionate about academic growth and attainment.
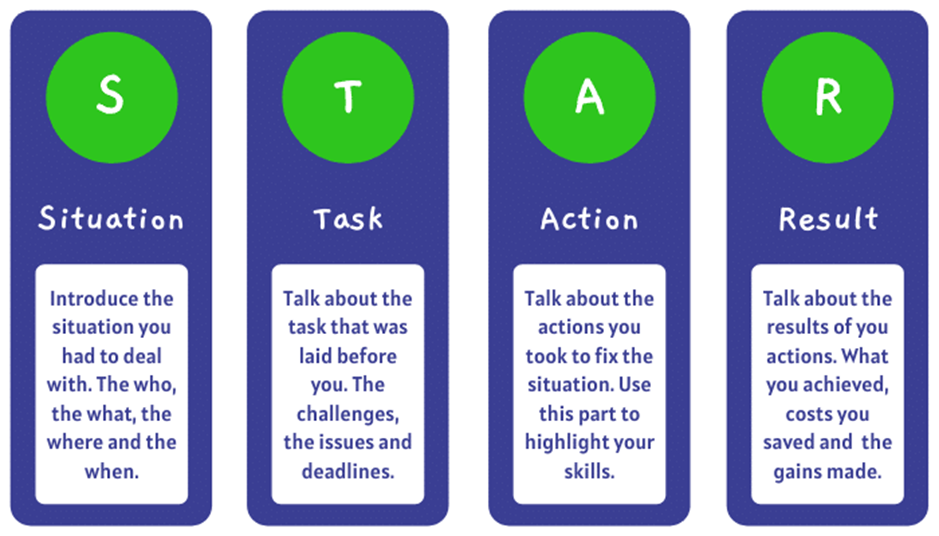
I found the internship on MyCareer, which is a Newcastle University platform which provides internships and work experience students can apply for. After finding the learning analytics internship and reading through the description I thought it would be a valuable and interesting opportunity. The applying process was very simple I attached my CV and answered three questions on how I would manage the hours required to work, what skills I brought to the internship and why I am the right person for the experience. When writing these answers, I used the STAR technique to provide efficient details of skills I brought to the table. After submitting my application, I was fortunately emailed a few weeks later asking if I was available for an interview. I was very nervous for the interview as I had never had an in-person interview before. However, to prepare I read over the description of the role, writing down on a notepad what skills I could bring to each of the tasks I would be completing and ideas I had. I also looked at the advice Newcastle university gave about internships on their website. https://www.ncl.ac.uk/careers/making-applications/interviews-assessments/interviews/. After I completed my first ever in person interview which although was nerve wracking provided me with real world experience which will be super helpful later in life, I waited to hear for the result.
Before starting the internship, I was slightly nervous, but I worked with an incredible team which were very supportive all the way. The learning analytics internship has given me an incredible experience, teaching me valuable skills and lessons that have allowed me to develop both professionally and personally.
Working with the learning analytics team has been so much fun. Through hosting pop-ups and interviewing students, I learned how to gather meaningful feedback, listen actively, and represent student voices in a constructive way. This experience also helped me understand the importance of real student insights and how they can inform and improve educational strategies. Although the pop up was quieter than expected as some students had left to go home for summer, we still gathered a range of responses online and in person.
After the pop up and students filling in online forms, I analysed data which taught me valuable skills of critical thinking and paying close attention to detail to observe patterns and trends of student’s responses. This experience confirmed my interest in qualitative and quantitative research, and I am now more confident in analysing data.
I thoroughly enjoyed providing a student perspective and spin to the marketing research. Another one of my tasks for the internship was to develop communication channels for students. There were multiple channels that were highlighted from the pop-up including emails, canvas, social media and in person discussion. For social media channels I utilised Canva, which was a fun experience to design a social media post about the new learning analytics system. Additionally, I also helped design the structure of the student facing webpages, using PowerPoint to design an example and writing descriptions around explaining why videos and images should be used. As someone who lacks creative skills, I found it really fun to try and design social media posts and webpages for learning analytics and felt it definitely developed my creativity.
The best part of the internship was knowing that what I was working on would help current students in their academic growth allowing students to set targets and review their engagement of their work.
An example of a type of day from the internship includes a meeting which would either be held in the Kingsgate building or remotely on teams depending on the team’s availability. During this meeting we discussed what we had all been working on, gave each other feedback and ideas and planned our tasks for next week. A lot of the work I did complete was online such as analysing data, creating ideas for communication channels and researching and comparing other universities learning analytics system.
The experience massively helped my confidence, interviewing students and presenting my research pushed me out of my comfort zone but helped me become much more comfortable in putting myself out there.
One challenge I faced was managing all the weekly tasks. Some weeks were busier than others, but on those busy weeks I used my notebook to schedule when I was completing each task, how long the tasks would take, when meetings where and if I had any questions during those tasks to keep track of everything.
One tip I would give to students doing an internship is to write down the skills that they have learnt during the experience with a description. I have done this, and it was helpful as I completed my student internship pathway reflection and will be useful for future interviews and applications as I can explain clearly what skills I developed from this experience.
Looking into the future…
Moving into third year is scary but knowing I am bringing valuable skills that I have learnt from this experience makes me feel more confident and ready. I am looking forward to use study goal to improve my academic progress and create targets to better myself.
As we near the end of the first academic year using the Newcastle University Learning Analytics (NULA) system, we’re taking a moment to reflect—and we want to hear from you.
NULA was introduced to support teaching and learning by giving colleagues greater insights into student engagement and progress. Over the past year, colleagues across the university have used the platform to inform tutoring conversations and connect with students in more meaningful ways.
Now, your feedback will help us understand what’s working, what could be improved, and how NULA can be better used to support students moving forward.
Share Your Experience
We’ve created a short survey (it takes less than 10 minutes to complete) to gather your thoughts. Whether you’ve used NULA extensively or only briefly, your perspective is incredibly valuable.
Your responses will directly influence how NULA evolves. We’re committed to ensuring the system continues to meet your needs and enhances the learning experience for all – thank you for taking the time to contribute.
What’s Next for NULA
We’re excited to share that several important developments are on the way:
Student app launch – September 2025
The student-facing version of the NULA app will be available for the start of the 2025/26 academic year, designed to give students greater insight into their learning and engagement. Dedicated resources for student will be made available on the Academic Skills Kit website.
New data sources for colleagues
From next academic year, the colleague-facing version of NULA will include ReCap lecture capture data and Library Reading List data—offering an even more comprehensive picture of student engagement.
These enhancements are driven by your feedback, and we’re committed to ensuring NULA continues to support your work in meaningful and practical ways.
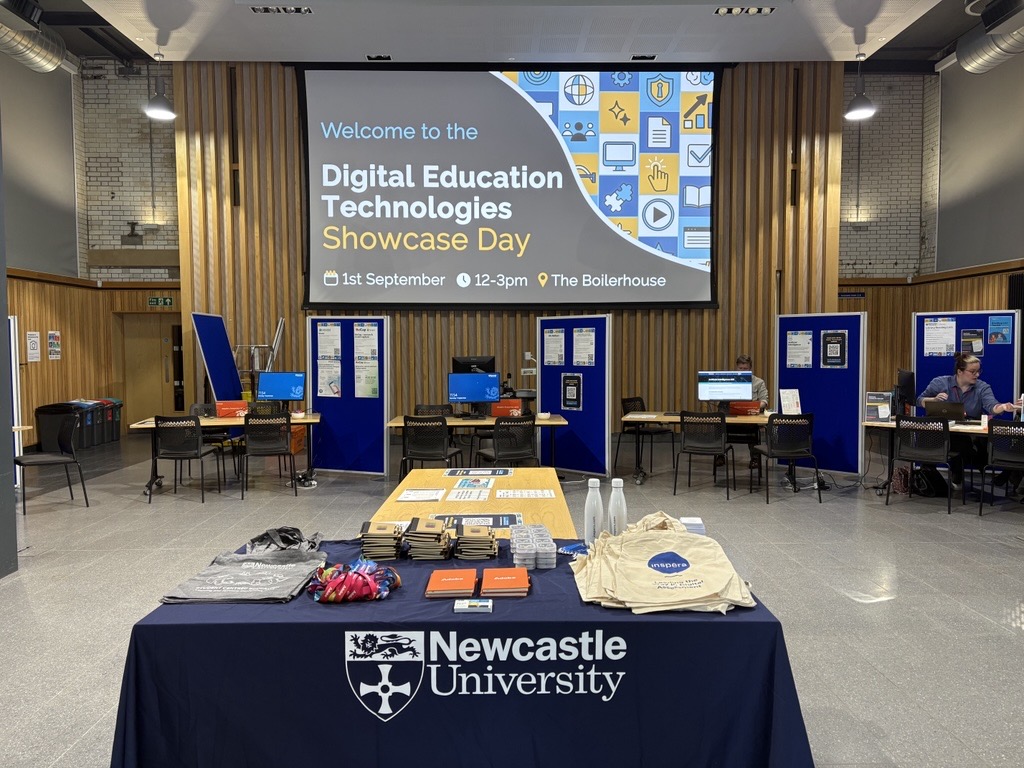
The Learning Enhancement and Technology Team in the Learning and Teaching Development Service (LTDS) are hosting a Digital Education Technologies Showcase Day on Monday 1st September 2025 between 12 and 3pm in the Boilerhouse.
This is a fantastic opportunity to meet the teams and people behind our Digital Education Technologies here at Newcastle. This will include: Canvas, ReCap, Vevox, Inspera (Digital Exams), Assignments (Canvas, Turnitin and New Canvas Quiz), Buddycheck, NULA, NU Reflect, AI, H5P, as well as the Numbas Team, Digital Adoption (M365 and Adobe) and Library Reading Lists Team.
This event is aimed at both academic and professional services colleagues already using these systems who want to take that step further, as well as new colleagues who want to learn about the digital technologies available.
The event will take place as a drop in, so you don’t need to sign up. If you would like to make any suggestions around what you would like to see at the event, please complete our Microsoft Form.
More information will be shared about this event over the summer.
NULA provides valuable insights into student engagement by consolidating a range of data sources. As colleagues, we know that interpreting this information effectively can make a real difference in supporting student success. To help you make the most of this powerful tool, we’d like to announce the launch of a new webpage dedicated to helping colleagues better understand and use the data provided by NULA.
What’s New?
This new resource has been designed to support colleagues by providing:
Examples of NULA data: using dummy data, there are practical examples of student engagement to explore and draw inferences from
Tips for interpreting trends: videos are provided to support interpreting the data, highlighting key trends and data points, in each practical example
Visualising key differences in the student profile view
As a reminder, the student profile in NULA offers two distinct views that provide complementary insights into engagement:
2 weeks display under Modules: the metrics within the Modules section give a focused, short-term view of a student’s engagement over the last two weeks, allowing you to spot recent trends and patterns.
Historic view under Engagement history: this offers a longer-term perspective, showing patterns and trends over time to identify consistent behaviours or shifts in engagement.
Additional Support
For further guidance, additional support is also available through the Traffic Lights and Metrics pages. These resources offer deeper insights into interpreting NULA data and understanding key indicators.
With the launch of the Newcastle University Learning Analytics (NULA) system we will be posting regular blog updates to inform our users of the latest developments within the system.
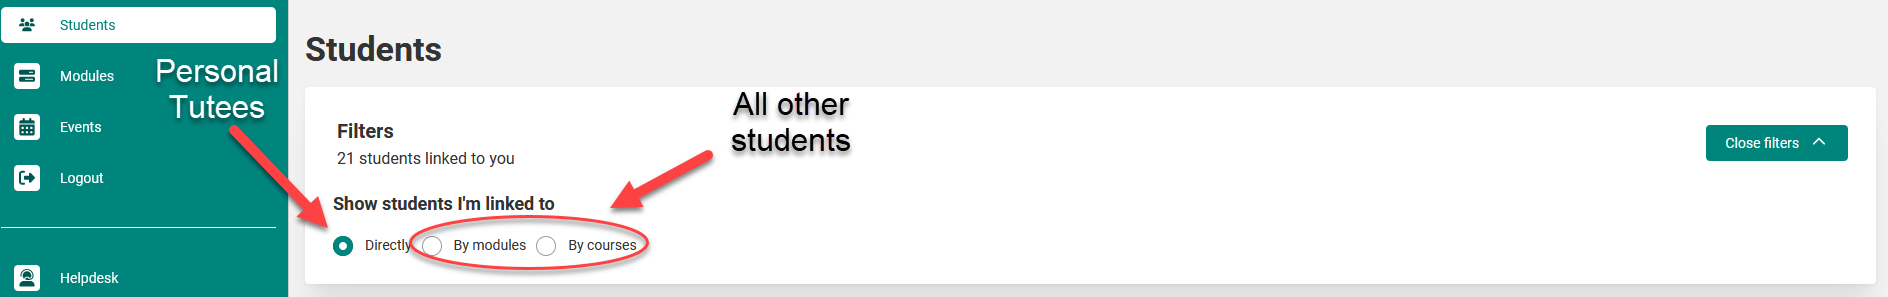
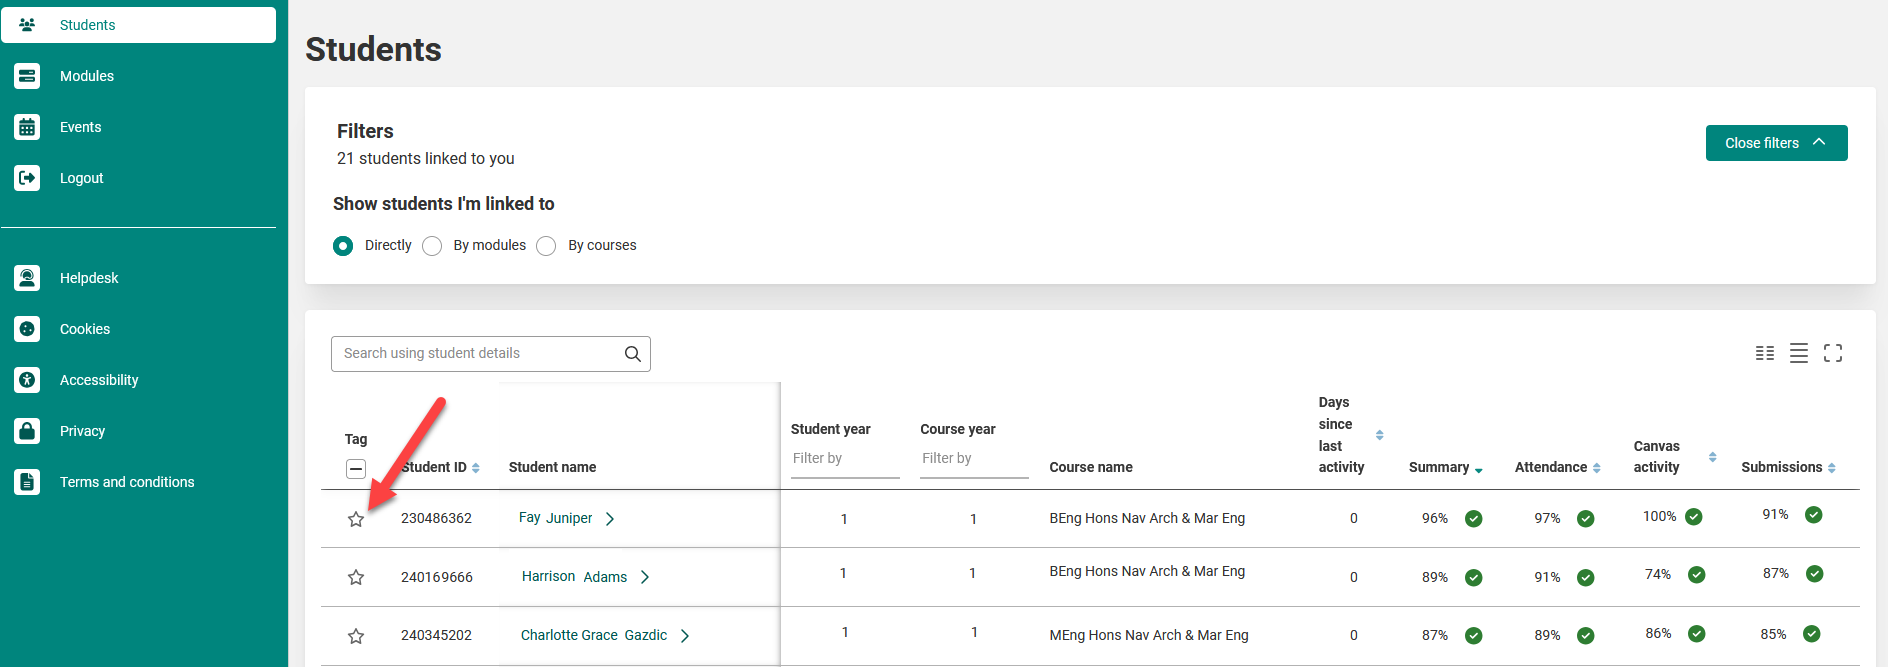
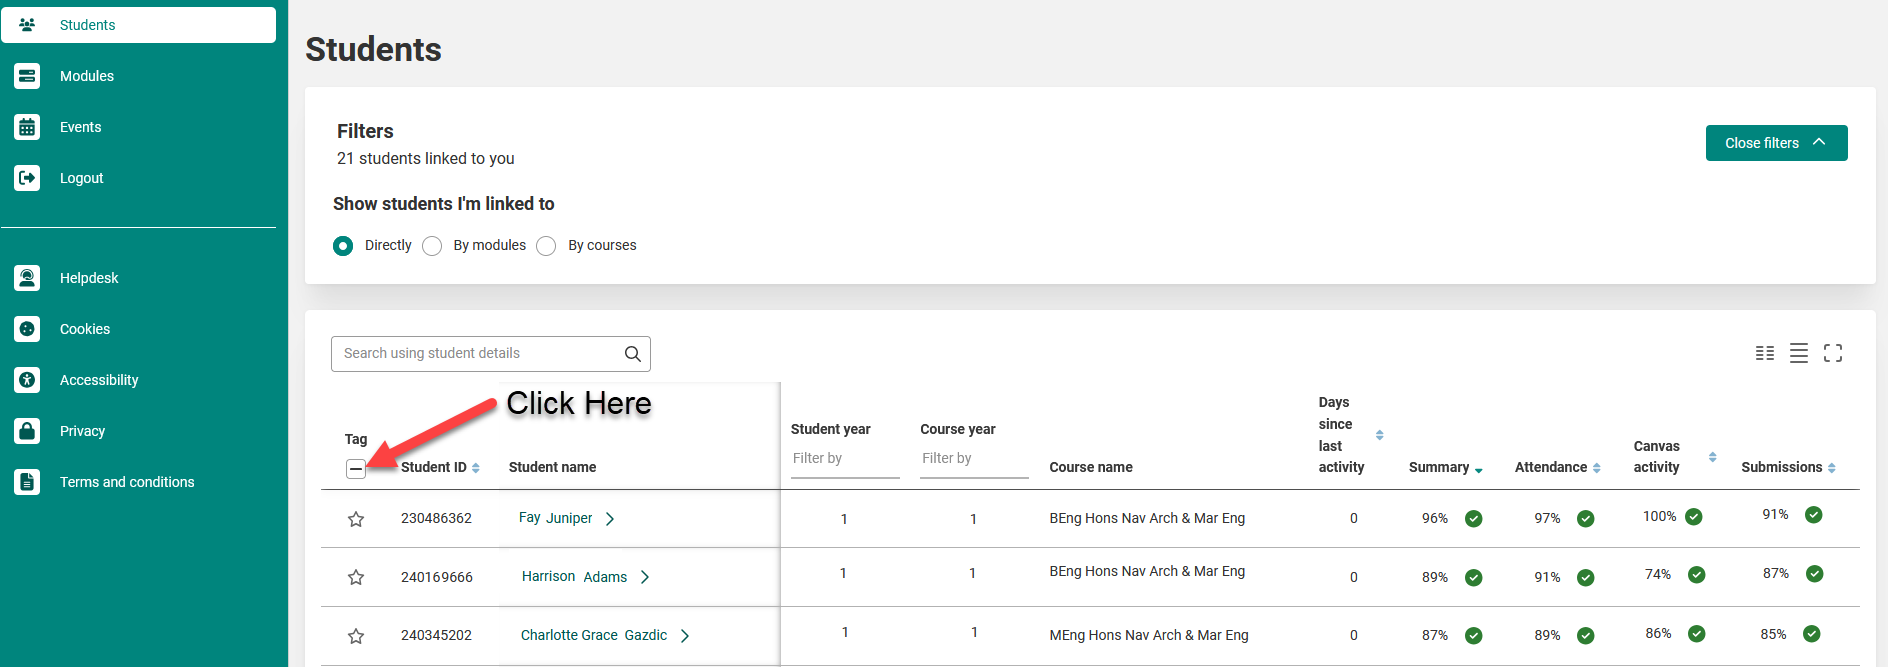
Finding students
We have updated how the lists of students are displayed; you can now find your personal tutees when selecting students you are “directly” linked to. To find any other students you can use the “by modules” or “by courses” options. A full guide on how to find students is available on the learning and teaching website here.
Tagging
The ability to tag a stuent using the star icon next to the students name is now available.
You can then filter a list of students to only show tagged/untagged/all students as shown below.
Student overview
When you view a student’s profile the first item you will be presented with is the student overview, which shows a quick snapshot of the students most recent engagement and lists some basic information such as the students contact details and personal tutor.
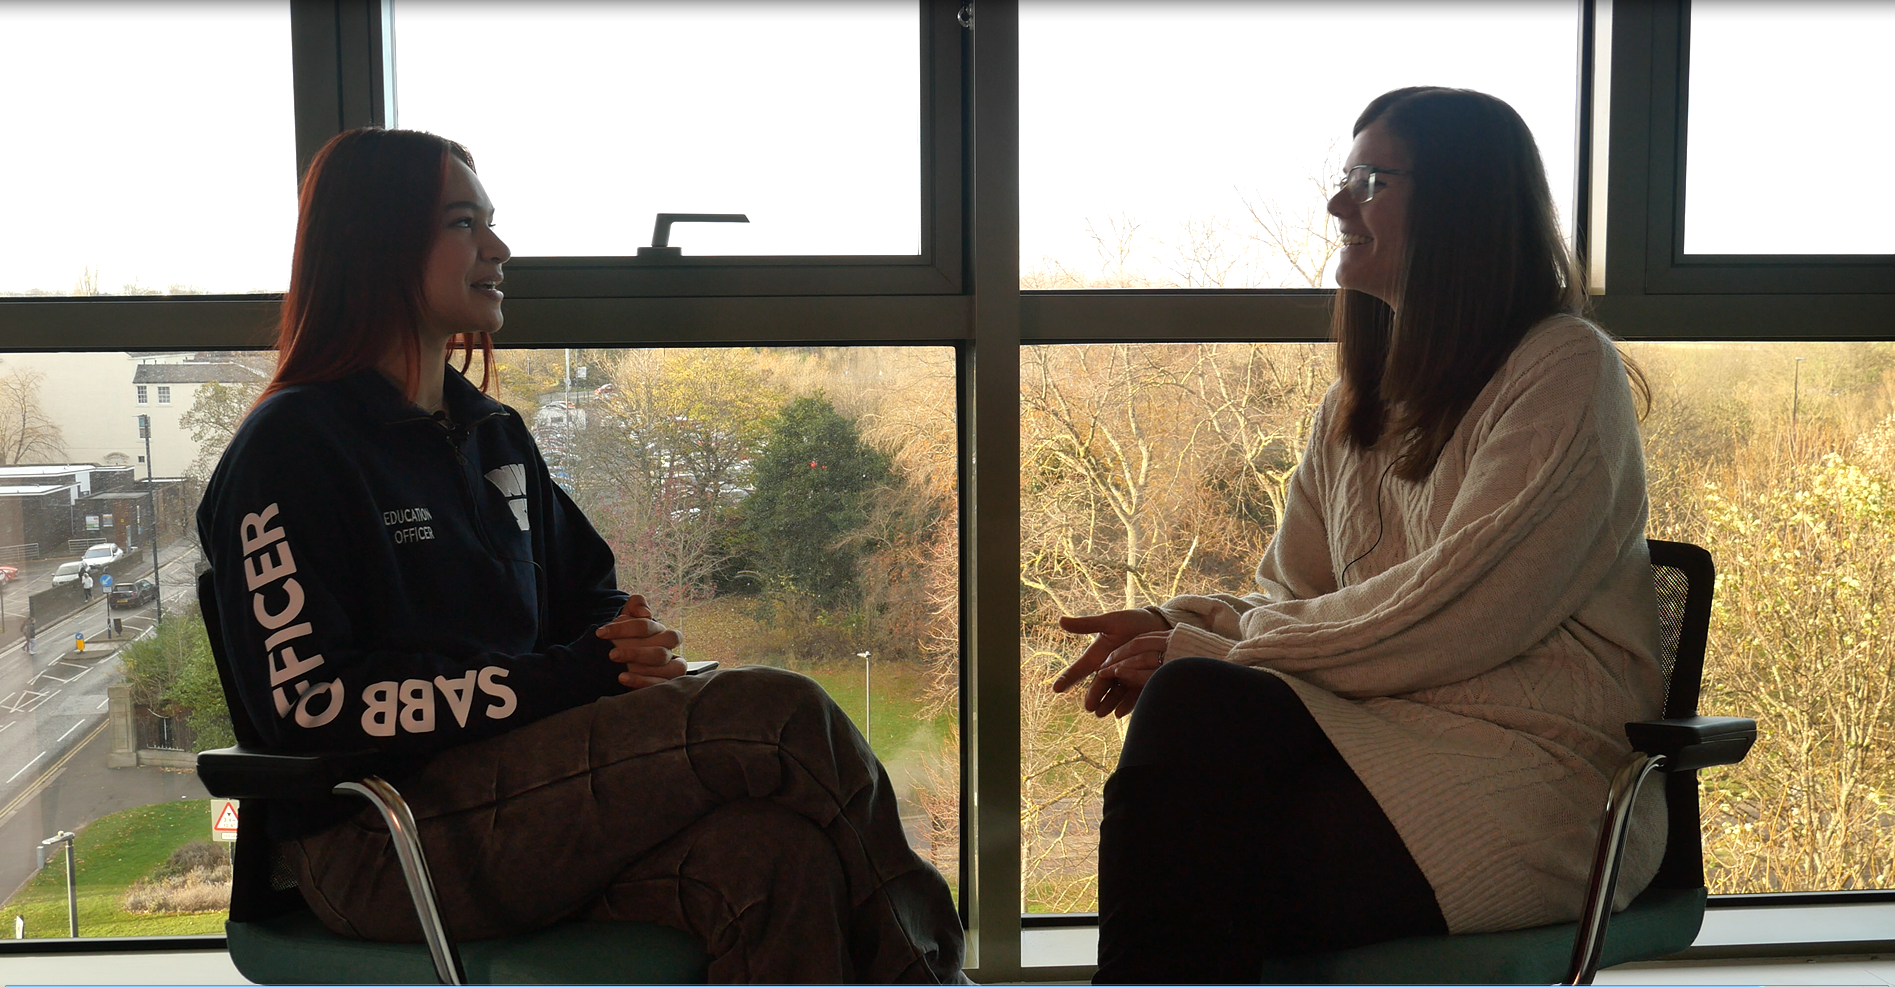
To introduce NULA to students Jasmine Banks, Education Officer at the Students’ Union, found out more about the system in conversation with Dr Lindsey Ferrie, Academic Lead.
They discuss: How NULA will benefit you What you can expect What you need to do
Watch our Introducing NULA video featuring Jasmine and Lindsey and read Jasmine’s article on the Student Noticeboard to find out how students are being updated.
Why this is important for colleagues
Students are being reassured that NULA is there to help support their learning, not to monitor or judge them. Keeping this in mind can help you talk to students about their data in a way that feels open, positive, and focused on their success.
What’s next?
Students have been encouraged to watch Jasmine Banks’ conversation with Dr. Lindsey Ferrie to learn more about NULA, and we recommend you do the same. This will give you a deeper insight into the messages they’re receiving, enabling you to mirror this approach in your tutoring practice.