Future heat-waves, droughts and floods in 571 European cities

Landmark study shows the impact of flooding, droughts and heatwaves by 2050-2100 will exceed previous predictions.

The research, by Newcastle University, UK, has for the first time analysed changes in flooding, droughts and heatwaves for all European cities using all climate models and highlights the urgent need to design and adapt our cities to cope with these future conditions.  The research is published in the academic journal Environmental Research Letters, and the paper is freely accessible.

The study shows:

  • worsening of heatwaves for all 571 cities
  • increasing drought conditions, particularlyin southern Europe
  • an increase in river flooding, especially in north-western European cities
  • for the worst projections, increases in all hazards for most European cities
  • Cork, Derry, Waterford, Wrexham, Carlisle, Glasgow, Chester and Aberdeencould be the worst hit cities in the British Isles for river flooding
  • Even in the lowest case scenario, 85% of UK cities with a river are predicted to face increased river flooding

Increase in ‘heatwave days’ for all European cities

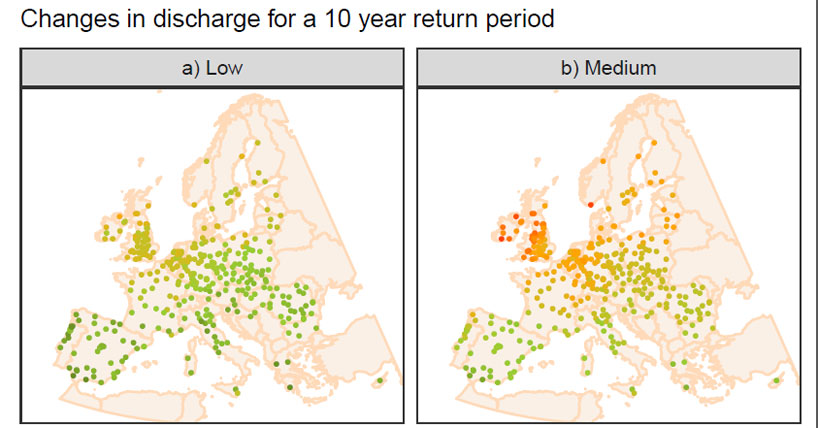
Using projections from all available climate models (associated with the high emission scenario RCP8.5 which implies a 2.6°C to 4.8°C increase in global temperature), the team showed results for three possible futures which they called the low, medium and high impact scenarios.

The study shows that even the most optimistic of these – the low impact scenario – predicts both the number of heatwave days and their maximum temperature will increase for all European cities.

Southern European cities will see the biggest increases in the number of heatwave days, while central European cities will see the greatest increase in temperature during heatwaves – between 2°C to 7°C for the low scenario and 8°C to 14°C for the high scenario.

For changes in droughts and floods, the cities which are affected depend on the scenario. For the low impact scenario, drought conditions only intensify in southern European cities while river flooding only worsens in north-western ones.

Worst flooding in the British Isles

The British Isles have some of the worst overall flood projections. Even in the most optimistic scenario, 85% of UK cities with a river – including London – are predicted to face increased river flooding, while for the high scenario, half of UK cities could see at least a 50% increase on peak river flows. The cities predicted to be worst hit under the high impact scenario are Cork, Derry, Waterford, Wrexham, Carlisle and Glasgow and for the more optimistic, low impact, scenario are Derry, Chester, Carlisle, Aberdeen and Glasgow.

By 2051-2100, for the low impact scenario, cities in the south of Iberia, such as Malaga and Almeria, are expected to experience droughts more than twice as bad as in 1951-2000. While for the high impact scenario, 98% of European cities could see worse droughts in the future and cities in Southern Europe may experience droughts up to 14 times worse than today.

“Although southern European regions are adapted to cope with droughts, this level of change could be beyond breaking point,” Dr Selma Guerreiro, lead author, explains.

“Furthermore, most cities have considerable changes in more than one hazard which highlights the substantial challenge cities face in managing climate risks.”

The implications of the study in terms of how Europe adapts to climate change are far-reaching, says Professor Richard Dawson, co-author and lead investigator of the study.

“The research highlights the urgent need to design and adapt our cities to cope with these future conditions.

“We are already seeing at first hand the implications of extreme weather events in our capital cities. In Paris the Seine rose more than 4 metres above its normal water level.  And as Cape Town prepares for its taps to run dry, this analysis highlights that such climate events are feasible in European cities too.”

80% increase in peak river flows

Of the European capitals, Dublin, Helsinki, Riga, Vilnius and Zagreb are likely to experience the most extreme rise in flooding. For the high impact scenario, several European cities could see more than 80% increases on peak river flows, including Santiago de Compostela in Spain, Cork and Waterford in Ireland, Braga and Barcelos in Portugal and Derry/ Londonderry in the UK.

Stockholm and Rome could see the greatest increase in number of heat-wave days while Prague and Vienna could see the greatest increase in maximum temperatures during heat-waves. Lisbon and Madrid are in the top capital cities for increases in frequency and magnitude of droughts, while Athens, Nicosia, Valleta and Sofia might experience the worst increases in both drought and heatwaves.

The United Nation’s Intergovernmental Panel on Climate Change (IPCC) has recognised the important role cites must play in tackling climate change and next month will hold its first Cities and Climate Change Science Conference, in Edmonton, Canada.

“A key objective for this conference,” explains Professor Dawson, who sits on the Scientific Steering Committee for the IPCC Conference, “is to bring together and catalyse action from researchers, policy makers and industry to address the urgent issue of preparing our cities, their population, buildings and infrastructure for climate change.”

Dr Guerreiro adds:  “Our analysis does not preclude the need for detailed climate change impact assessment for each city.  But it does provide comparable information for different impacts and cities that can be used to prioritise national and European adaptation investments and guide more detailed adaptation studies.”


Guerreiro S, Dawson RJ, Kilsby CG, Lewis E, Ford AC (2018) ‘Future heat-waves, drought and floods in 571 European cities’. Environmental Research Letters. 13: 034009. DOI: 10.1088/1748-9326/aaaad3

https://doi.org/10.1088/1748-9326/aaaad3

CESER research on natural flood risk management up for @guardian university award http://gu.com/p/4h6df/stw

ncegweb_276848Paul Quinn and Eleanor Starkey’s natural flood risk management and community involvement work over in the Haltwhistle Burn catchment (Northumberland) has been shortlisted for The Guardian University Awards 2016, under the ‘Social and Community Impact‘ category. This follows on from the media coverage which the ‘kerplunk’ inspired system received back in 2015. The work forms part of a wider project which involves a team of CESER researchers (PhD student Eleanor Starkey and her supervisors Geoff Parkin, Paul Quinn and Andy Large) who have worked in partnership with Tyne Rivers Trust.

It contributes to one of three categories which Newcastle University has been shortlisted for. Category winners will be announced at the awards ceremony in London on 16 March 2016.

Research to tackle ‘grand challenges’ for water sector gets £3.9m boost #ukcric #ibuild

Picture1A new £3.9million research project involving Newcastle University and Northumbrian Water will ensure the UK maintains a clean, sustainable water supply for the future.

The project will help the UK water sector tackle key challenges, including population growth, ageing infrastructure and climate change.

The project is part of the £21 million ‘Engineering Grand Challenges’ funding from the Engineering and Physical Sciences Research Council (EPSRC), announced today by the Universities and Science Minister, Jo Johnson who said: “We want the UK to be the best place in Europe to innovate and this £21 million investment will bring together the nation’s researchers to address some of the most pressing engineering challenges we face.

“From ground-breaking work with robotics to advanced air-flow simulators, this investment will help tackle our aging water infrastructure and air pollution in cities to improve the lives of millions of people around the world.”

Named TWENTY 65 (Tailored Water to ENsure sustainabiliTY beyond 2065), the project will ensure flexible and adaptive water systems by developing multiple solutions and technologies that can be ‘tailored’ to suit specific circumstances. The academic partners – led by Sheffield University and involving Newcastle, Exeter, Manchester and Reading Universities as well as Imperial College London – will undertake research across eight technical themes, focusing on demand-based technologies, social practices, water energy systems to minimise carbon emissions and the use of robotic autonomous systems for infrastructure inspection and repair.

The project will also create a Hub involving Northumbrian Water and nine other water companies, their supply chain and academic researchers to encourage shared idea generation, strategic roadmapping, networking, innovation stimulation and research leadership.

This combination of multi-disciplinary academic research and collaborative work with the UK water sector will enable the TWENTY 65 project team to lead UK and international transformation in the sustainable supply of safe water.

Professor Richard Dawson said: “We are delighted to be part of this consortium that will work to ensure there is enough water, for all, for ever. Newcastle are leading work that will develop new computer modelling tools to study the long term pressures on water, to enable development of integrated solutions to tackle future water challenges. This builds on Newcastle’s recent multi-million pound award in the 2015 Budget to develop new surface water flood management research facilities as part of their involvement in the UKCRIC programme.”

Chris Jones, Northumbrian Water’s Research and Development Manager said: “We believe it is important to work with universities to develop innovative solutions to challenges the water industry faces now and in the future.

“We are already collaborating with Newcastle University in many areas including research into low-carbon and energy efficient treatment processes and processes that work better in low temperatures; the recovery of valuable by-products from wastewater; gene sequencing to help improve bathing water quality and reducing flooding from sewers.

“Future focus will help us to improve the quality and appearance of our customers’ drinking water and to reduce leakage.

“Being part of this project will afford us even greater access to innovative ideas and stimulate our own innovation agenda and activities.

“The TWENTY 65 Hub will stimulate collaboration with a wide range of companies and academics, and enable quicker conversion of research ideas to implementation, clearly supporting our vision to be the national leader of sustainable water and wastewater services.”

Professor Joby Boxall, Director of Sheffield Water Centre and overall project lead, said: “Water supply is the foundation of society, but a service we are privileged to be able to take for granted in the UK. There is no single solution to the sustainable supply of safe clean water for the future. Our vision is that by 2065, collaborative innovation has generated a water sector that is delivering sustainable tailored water solutions that positively impact on public health, the environment, the economy and society.

“New approaches and models for collaborative working across the water sector are an essential part of the project. We have support pledged from over 50 partners and will be looking to get more organisations on board.”

“This is a truly unique and exciting opportunity to take a long-term view of how we can develop and implement technology to deliver transformative change.”

The project was developed in response to an EPSRC call in early 2015 which set out four Engineering Grand Challenges, developed through a two day event involving academics from many disciplines, representatives from industry and government.

www.sheffield.ac.uk/research/water

www.epsrc.ac.uk


New book: Managing #coasts in the third millennium https://doi.org/10.1007/978-94-007-5258-0 @TyndallCentre @NCLSustainable @SotonEngEnv #springer

Robert Nicholls, CESER director Richard Dawson, and Sophie Day launch a new book, Broad Scale Coastal Simulation: New Techniques to Understand and Manage Shorelines in the Third Millennium, that reports in full, for the first time, on the Tyndall Coastal Simulator.

Coastal scientists, engineers and policy makers around the world are increasingly recognising the challenge of sustainable coastal management in the third millennium. Long-term geomorphological, climatic and socio-economic changes are influencing coastal systems at unprecedented spatial scales and over extended timeframes – with profound implications for people, coastal infrastructure and settlements, biodiversity, ecosystem services and governance of the coastal zone. Coastal researchers and decision-makers are presently ill-equipped to deal with the problems emerging from multiple drivers of change across multiple coastal sectors. This reflects that the coast is a linked system, and any change in one area or sector may influence the impacts for other areas or sectors.

An integrated systems based approach that seeks to represent the interactions between different issues within the coastal zone is fundamental to understanding the impact of global change on coastlines and to assist the sustainable management of our shorelines over the twenty-first century. In 2000, the Tyndall Centre for Climate Change Research, an interdisciplinary consortium of engineers, scientists and social scientists, was established in the UK. This provided a unique platform to develop a coastal research programme with a major focus on an integrated assessment – known as the Tyndall Coastal Simulator. An earlier synthesis paper from this research by Dawson et al. (2009) won the Lloyd’s Science of Risk Research Prize for Climate Change in 2012.

Unlike other coastal books, this his book is not a handbook for design, nor is it a compendium of methods that cover every aspect of coastal systems or a compilation of case studies with differing aims. Rather it is a perspective on integrated assessment as applied to coastal problems, which represents a topic where there is an important gap in the literature.  Whilst each chapter can be read in isolation, each chapter also contributes to the wider integrated assessment. Throughout the book, the process of integrating information on the different environmental, social and economic dimensions of coastal management.

Taking a systems perspective of the natural, physical and social environment at a scale that is relevant to livelihoods and the economy has enabled the Tyndall Centre tea to analyse how the coastal system as a whole might evolve in a changing physical and socioeconomic environment. The application of the Tyndall Coastal Simulator to North Norfolk, UK, demonstrates that it is now feasible to explore long-term integrated projections of coastal processes such as geomorphology, flood risk and land use change, greatly increasing the evidence base available for coastal management decisions. Moreover, the methods and integrated assessment framework are transferable to other coastal areas.

The integrated assessment highlights a number of the opportunities, challenges and trade-offs and the need for a long-term perspective on coastal policy in order to allow adaptation to coastal change to occur, for example, the difficulties faced by coastal managers, who in reducing the risk of erosion may actually enhance flood risk (or the cost and viability of mitigating this risk) at sites within the same coastal system. Such results were captured within the Tyndall Coastal Simulator interface allowing the technical results to be accessible to a wide range of stakeholders.

It is now clear that the management of any coastline and the governance structures upon which that management depends need to reflect the connectivity between the various coastal features that comprise the natural and human coastal system and consequential trade-offs in management policy. Furthermore, the Norfolk analysis relates the technical aspects of coastal change to the present, and often emotive, debate around long-term shoreline management – in particular it strengthens the argument for a change in the widespread historic management approach of increasing lengths of “hold the line” towards allowing as much of the coastline as possible to return to a more natural and dynamic configuration, including the associated sediment supply from eroding coasts. Inevitably, this raises a number of fundamental questions from stakeholders, which we have explored through using results from the Tyndall Coastal Simulator, about how to address the concerns of directly and indirectly affected landowners and householders to facilitate this fundamental change in management approach.

More generally, the book shows the great potential for coastal stakeholders to develop improved understanding of coastal futures and for decisions to be based on a stronger evidence base. However, the work exposed the magnitude of many uncertainties about coastal futures.  Although the broadscale coastal simulation of the type presented here can provide a rich evidence base, in the context of adaptation it should be regularly reassessed, debated and reviewed as part of an ongoing process to reflect improving knowledge and changing priorities. Thus, the Tyndall Coastal Simulator and tools like it have the potential to provide a platform for the longer-term adaptation process.


Impacts of #climatechange on UK #infrastructure @lwec_uk @TyndallCentre @nclceser

LWEC Infrastructure Climate Change Impacts Report Card Published

The LWEC Infrastructure Climate Change Impacts Report Card has been published. The production of the card was led by a working group chaired by CESER Director, Professor Richard Dawson.

infrashot

This LWEC Report Card is aimed at anyone who works with, or has an interest in, infrastructure in the UK. Infrastructure provides services important for our safety, our health and our economic development. Climate change may affect it in a number of ways. Focusing on the possible physical impacts of climate change, this card sets out to aid understanding of the nature and scale of those impacts on UK infrastructure and so inform decisions about infrastructure’s management and further development. The card provides a high-level summary of the main findings from 12 detailed technical reports prepared by leading experts in their fields using the best available science from academic literature.

The card can be downloaded in pdf format [6.7MB]

The sectoral working papers that underpin the card and other relevant information can be accessed here:

http://www.lwec.org.uk//resources/report-cards/infrastructure

Please disseminate the card as widely as possible by forwarding the link to it to others in your organisation and stakeholder networks. If you have any queries please contact office@lwec.org.uk.


Improve #infrastructure resilience with permutable components @nclceser @unisouthampton @springeropen

Access the full research article for free:
http://www.infrastructure-complexity.com/content/2/1/1

Research just published by experts in the Centre for Earth Systems Engineering Research, working with Southampton University have shown how permutable infrastructure components can reduce the risks of cascading failures.

The inter-connected and complex nature of modern infrastructure systems has created a “network of networks” that, when disrupted by deliberate action, or natural hazard event, can result in cascading failure that leads to the complete fragmentation of all connected systems from the destruction of a comparatively small number of nodes.

Existing “network of networks” approaches are still in infancy and have shown limits when trying to model the robustness of real-world systems, due to simplifying assumptions regarding network interdependencies and post-attack viability.

This work challenge such assumptions and demonstrates, through simulation, how failure to represent certain infrastructure properties can lead to inappropriate, or counterproductive, network adaptation and protection strategies in many circumstances.

  1. Most assessments to date have assumed that in the event of a cascading failure only the largest single contiguous part of a network remains viable.  Whilst this measure is of some use, it fails to recognise that merely isolating infrastructure components does not necessarily mean they fail.  For example, dry roads within a town that has been cut off by floodwater, will still function even if the roads into the town do not.
  2. It is possible to influence the nature of the failure propagation between coupled networks by allowing nodes in a given network to have multiple supporting nodes in another network.  For example, providing a back up power supply.
  3. Previous studies have shown that removing interdependent links reduces the chance of cascading failure.  However, we find that this is counterproductive when you consider the nature of infrastructure systems and that one infrastructure network often requires a certain degree of interdependence with another in order to be viable..  For example, flooding of a road network may impact our ability to access railway stations, having a knock-on impact upon train use.  Obviously, removing all road-rail connections will ensure the rail network does not receive a minimum amount of passengers, goods, and personnel in order to operate.

Finally, we propose the use of permutable or adaptable systems as efficient and effective mechanisms to give network of network systems rewiring capabilities.  These permutable nodes and links appear to protect coupled networks from the destructive consequences of isolation and cascading failure and at the same time preserve network resources by limiting the amount of redundancy needed to absorb a disturbance.  These permutable systems are different from multi-service conduits.  For example, an electric line that carries phone communications at the same time would propagate failure through both phone and electricity networks in case of malfunction while, on the other hand, components that can provide alternated states of coupling to different networks limit the topological propagation of cascading failure while providing an alternate configuration to the system because of their rewiring capabilities.  Examples include roads convertible to landing strips, tunnels that can alternate between traffic and storm water management (e.g. the Stormwater Management and Road Tunnel (SMART) in Kuala Lumpur), energy storage devices on board electric vehicles that can be plugged to the power grid when not in use so as to store and produce energy whenever needed.


Read the full article for free:
Khoury M, Bullock S, Fu G, and Dawson RJ (2015) Improving measures of topological robustness in networks of networks and suggestion of a novel way to counter both failure propagation and isolation, J. Infrastructure Complexity, 2(1):1-20.

Mountains are hotting up @nclceser #climate

Experts from Newcastle University’s Centre for Earth Systems Enginering Resarch fear for water supplies and wildlife. Mountains may be hotting up faster than previously thought with potentially dramatic consequences, fear North scientists. An international team of experts, including researchers from Newcastle University, is now calling for urgent and rigorous monitoring of temperature patterns in mountain regions. This could lead to threats ranging from water shortages and the possible extinction of some alpine plants and animal life. Co-authors of the research, Prof Hayley Fowler and Dr Nathan Forsythe, from Newcastle University’s School of Civil Engineering and Geosciences, have been working on climate change in the Himalayas for over a decade. Prof Fowler said: “Changes to climate, glaciers and snow cover in the high mountains of Asia are of vital importance for water supplies to a fifth of the world’s population, so understanding past changes are key to understanding what might happen in the future.” Lead author, Dr Nick Pepin of the University of Portsmouth, said: “Most current predictions are based on incomplete and imperfect data, but if we are right and mountains are warming more rapidly than other environments, the social and economic consequences could be serious, and we could see much more dramatic changes much sooner than previously thought.” The most striking evidence that mountain regions are warming more rapidly than surrounding regions comes from the Tibetan plateau. Here temperatures have risen steadily over the past 50 years and the rate of change is speeding up. But masked by this general climate warming are pronounced differences at different elevations. For example, over the past 20 years temperatures above 4,000 metres have warmed nearly 75% faster than temperatures in areas below 2,000 metres. The team of scientists came together as part of the Mountain Research Initiative, a mountain global change research effort funded by the Swiss National Foundation. Between them, they have studied data on mountain temperatures worldwide collected over the past 60-70 years. Dr Pepin said: “There is growing evidence that high mountain regions are warming faster than lower elevations and such warming can accelerate many other environmental changes such as glacial melt and vegetation change, but scientists urgently need more and better data to confirm this.” Among the reasons the researchers examined for faster rates of temperature increase in mountain regions are: •Loss of snow and ice, leading to more exposed land surface at high elevation warming up faster in the sun; •Increasing release of heat in the high atmosphere. A warmer atmosphere holds more moisture, which, when condensing as clouds at high elevation, releases more heat to the mountain environment; •Aerosol pollutants at low elevations, including haze, dust and smoke, reduces warming at those elevations, thus increasing the difference in rates of warming between low and high elevations; •Dust and soot deposited on the surface at high elevations causes more incoming sunlight to be converted to heat. •The world’s highest mountain, Mt Everest, stands at 8,848 m. More than 250 other mountains, including Mt Elbrus in Russia, Mt Denali in Alaska, Mt Aconcagua in Argentina and Mt Kilimanjaro in Africa, also all top the 5,000m mark. Ben Nevis, in Scotland, is the UK’s highest mountain, standing at 1,344 m.

Video link

Full paper: Pepin, N., Bradley, N.S., Diaz, H.F., Baraer, M., Caceres, E.B., Forsythe, N., Fowler, H.J., Greenwood, G., Hashmi, M.Z., Liu, X.D., Miller, J., Ning, L., Ohmura, A., Palazzi, E., Rangwala, I., Schoener, W., Severskiy, I., Shahgedanova, M., Wang, M.B., Williamson S.N., and Yang, D.Q. 2015. Elevation-Dependent Warming in Mountain Regions of the World. Nature Climate Change 5, 424–430 doi:10.1038/nclimate2563

Understanding Weather Impacts in the Caribbean

cariwiglogoThe Caribbean Weather Impact Group (CARIWIG) Project Supports Risk-Based Decision-Making in the Caribbean

Bridgetown, Barbados; February 12, 2015 – The Caribbean Weather Impacts Group (CARIWIG) project is supporting risk-based decision-making in the Caribbean region. The Project hosted a policy workshop and training event at the Savannah Hotel and at the University of the West Indies, Cave Hill Campus in Barbados this week (February 10 – 12). The training exposed 34 participants, including institutional leaders and representatives from across Caribbean institutions, to a suite of tools developed under the Climate and Development Knowledge Network (CDKN) supported initiative. The four tools developed under the project for use in the Caribbean are:

Regional Climate Models and Caribbean Assessment of Regional Drought (CARiDRO)

The Caribbean Assessment Regional DROught (CARiDRO) was designed to facilitate drought assessment in the context of the Caribbean and Central America. It is a flexible system that should accommodate the requirements of different users. The online tool is composed of two main sections: a descriptive one where the user can find information on how to use the tool as well as terms and concepts that are useful. The other section is where the user can fill out a form indicate the necessary results required. CARiDRO allows the user to access and to process different observed and model datasets for the Caribbean Region to produce results based on two Drought Indexes, the Standardized Precipitation Index (McKee,1993) and the Standardized Precipitation-Evaporation Index (Serrano et al, 2010).


Weather generator

The Weather Generator provides daily weather time series for use in impact assessments and impact models. It generates weather data for the future that can be used across sectors (e.g., water, agriculture, health) in the same way as historic weather series. The main benefit and utility of the WG is that it provides information for a single point location – directly comparable to what is observed at weather stations.


The Simple Model for Advecting Storms & Hurricanes (SMASH)

SMASH is a simple model based on past memorable and notable storms that can generate grids for each 15 minute period in a modeled storm. The variables include precipitation rate and wind speed.


Portal and observed data

This web portal provides information and datasets concerning:

  • The observed climate of the present day
  • Regional Climate Model projection of the future climate
  • Future scenarios of weather downscaled from the Regional Climate Model projections
  • Scenarios of weather derived from hypothetical tropical cyclone events

This web portal is intended for use by regional and national institutions, consultants and scientists concerned with the climate and impacts of future climate change in the Caribbean region. Accordingly, a considerable degree of contextual knowledge of climate change and its impacts, and analytical expertise is assumed.

Further information on the project:  http://www.cariwig.org/

The tools will provide an open access online resource, and will advance efforts under the project to provide locally relevant and unbiased climate change information that is specific to the Caribbean and relevant to the region’s planning horizons. The integration of the tools into national policy agendas across the region is crucial to ensuring effective decision-making and improving climate knowledge and action in the region. It is a significant “contribution to the body of knowledge to aid in decision-making. Benefits will come through people being sensitized about what is Climate Change and their singular responsibility to engage in climate resilient actions based on their understanding of climate vulnerabilities and impacts,” according to Keith Nichols, the CCCCC’s project development specialist.

The efficacy of the tools in strengthening climate decision-making and planning in the Caribbean is being tested through ten case studies focussed on areas such as drought, agriculture, water resources, coastal zone structures, health (dengue fever), and urban development and flooding. The case studies offer a real-world testing ground for the demonstration and enhancement of the utility of the four CARIWIG tools for regional decision-making and the building of capacity regionally through training exercises.

The CARIWIG project is being implemented collaboratively by Newcastle University, the Caribbean Community Climate Change Centre (CCCCC), the University of East Anglia, the University of the West Indies and the Institute of Meteorology in Cuba (INSMET).


Environmental Risks and Big Data @nclceser @cranfielduni @Cambridge_Uni @unibirmingham @NERCscience @gregclarkmp

A consortium of four leading UK universities, including Newcastle, has been awarded £2.5m to train the next generation of researchers to become experts at assessing and mitigating environmental risk using Big Data.

Funded by the Natural Environment Research Council (NERC), the aim of the new Centre for Doctoral Training (CDT) is to produce researchers who can use large or complex datasets to understand and ease the risks posed by a range of societal and environmental changes, such as a rapidly expanding population, limited natural resources, and natural hazards.

Experts at Newcastle University, along with colleagues from Cranfield, Birmingham and Cambridge universities will lead the new DREAM (Data, Risk and Environmental Analytical Methods) consortium, supporting 30 PhD students to develop the key skills needed in these emerging fields.

Newcastle’s involvement is led by CESER academics Dr Stuart Barr and Professor Chris Kilsby in the School of Civil Engineering and Geosciences.

Dr Barr, a senior lecturer at Newcastle University, explains: “As our ability to monitor the Earth’s processes improves – collecting data from a wide range of sources from satellite observations through to ‘crowd sourcing’ – it is imperative that modern environmental scientists are able to analyse and use this data to its full potential.

“The aim is to train the next generation of risk specialists who will be able to seize the opportunities of ‘big data’ analytics to improve our understanding of environmental risk mitigation options for industry, businesses, government and society.”

As identified by the recent BIS data strategy – Seizing the Data Opportunity – the UK has some of the best universities and institutes in the world, some truly innovative small businesses, and some of the richest historic datasets of any country.

This means there is potential to produce a new generation of risk scientists able to maximise the opportunities big data offers, filling a skills shortage in this area. The CDT is a direct response to this shortage.

Minister for Universities, Science & Cities, Greg Clark, said: “In this fast-moving, digital world, the ability to handle and analyse large volumes of complex data is vital for the UK to maintain its competitive edge.  That is why the government identified Big Data as one of our 8 Great Technologies and central to our Industrial Strategy.

“This £2.5 million investment to train the next generation of Big Data experts will enable a skilled workforce to develop innovative tools to assess and mitigate risk that will help business, government and wider society cope effectively with big environmental and societal changes.”

Professor Duncan Wingham, chief executive of NERC, said: “We are becoming increasingly in need of a sophisticated understanding of changes, such as highly interdependent economies, a fast expanding and ageing population and climate change, that affect all of our lives. Decision makers in business, government and wider society need to understand these risks so that they can develop the most appropriate strategies to respond to them.”

“NERC’s new Centre for Doctoral Training will equip tomorrow’s researchers with the skills necessary to maximise the opportunities big data offers to develop risk analysis, contributing to this important area of the economy.”

Funding for ten studentships will be awarded each year. The CDT award will provide funding for three years of new student intake – 30 studentships in total – from 2015 to 2016. Two of the studentships in the 2016 cohort will be interdisciplinary and co-funded by the Economic and Social Research Council (ESRC) and NERC.

Students will gain advanced technical skills, be regularly brought together as a cohort to share ideas and skills, and have the opportunity to take part in partner-based secondments.

CDTs support strategically-targeted, focused PhD studentships aimed at addressing specific research and skills gaps identified by NERC and our partners.

In a related project, NERC recently launched a £5m strategic innovation initiative, called Environmental Risks to Infrastructure Innovation Programme (ERIIP), to help protect some of Britain’s most important national infrastructure from environmental hazards. The programme will give decision-makers in areas such as energy, transport and water improved access to NERC’s world-class environmental science.

Old photos shed new light on the #Antarctic #climatechange @nclceser @nclceg

Aerial photos from the 1940s and 1950s are drawing upon CESER’s expertise in observation and monitoring to probe the climate history of the Antarctic Peninsula.

Researchers from Newcastle University, the British Antarctic Survey (BAS) and University of Gloucestershire, are comparing the images with newly acquired data sets to assess the changes that have occurred in some of the region’s 400-plus glaciers.

The Antarctic Peninsula has undergone dramatic changes over recent decades due to global climate change and getting an accurate picture of change in volume and mass of the glaciers is difficult. Satellites are used to track such trends today but their record span only a relatively short timeframe.

Instead, the team are comparing the old photographs with modern information.  Using novel techniques that are able to precisely position the pictures, the information is carefully aligned in order to make sure any comparisons are accurate and reliable.

CESER researcher Dr Pauline Miller, based in the School of Civil Engineering and Geosciences at Newcastle University, explains: “The archive of aerial photos goes back to the 1940s and represents an extraordinary account of the pioneering days of polar exploration.

“The men who ventured forth in their planes to capture pictures of the peninsula’s rugged ice-scape took huge risks, with none of the back-up that modern expeditions can count on.

“They had no idea what they were flying into because no-one had ever been there before.  The 1940s were just about flying to see what they could find, but by the 1950s it was much more systematic – for topographic mapping purposes. It was all about staking a claim in Antarctica when nations were becoming more competitive.

“That these old images still have scientific value in the 21st Century is down to novel techniques that are able to precisely position the pictures using newly created accurate, modern-day elevation models of the peninsula.”

The study, funded by the Natural Environment Research Council (NERC), was presented this week at the American Geophysical Union Fall Meeting in San Francisco. Leading the talks were Dr Miller and Dr Lucy Clarke from the University of Gloucestershire

Speaking to the BBC, Dr Clarke said: “We want to use these pictures to work out volume and mass-balance changes in the glaciers through time.

“There are tens of thousands of these historical images, held by the British Antarctic Survey and the US Geological Survey.

“So, they’ve long been around, but it’s only now that we’ve had the capability to extract the 3D data from them.”

The team is using the latest optical satellite data to do this, as well as modern aerial photos acquired by BAS planes equipped with GPS.

Fundamental to these techniques is finding visual cues in the ice-scape that allow historical and current information to be married up.

“These visual cues have got to have some kind of rock; white areas of snow are no good to us because obviously they can change and they’re not easy to identify. We need stable areas like mountain peaks,” adds Dr Clarke.