Week Log 10 – NUTC

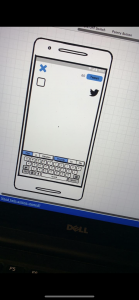
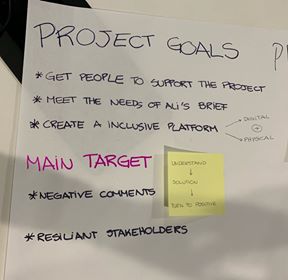
This week we met with Ali, Mark and John who we had decided would be our user testers. We finished our prototype last week so wanted to test it firsthand with stakeholders who could give us an honest opinion on how successful they believe our prototype to be. We completed this test at the civic centre, gaining a lot of very helpful feedback. And decided to leed our user test with the 5 act interview and by giving each one a computer to test and respond with no exterior influence.

Some examples of the feedback were:

  • “We don’t have any strong, clear messages so that’s what I really like, something that’s hard hitting and to the point, talking to driving rather than alternatives.”
  • “Will grab peoples attention”
  • “Directly targets people” – especially the travelling public
  • “Really likable”
  • “Very positive way of reaching out to the people.”
  • “Way of seeing how people feel in a positive sense not just always the negatives”

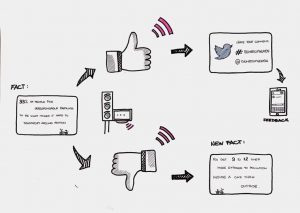
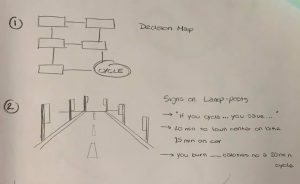
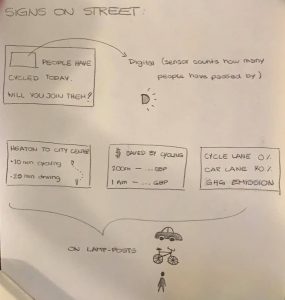
This was all very helpful as it gave us a lot more confidence in the prototype we have made and it was nice to hear how the council liked our idea and found it believable even thinking of a way they could make our project a reality. The only concerns brought up were the fact that traffic administration people only allow signs in relation to road safety. Although they liked our idea so much they began to think about and suggest to us ways it could become a reality through the likes of roadside signs instead or using modes of transport to display the signs.  

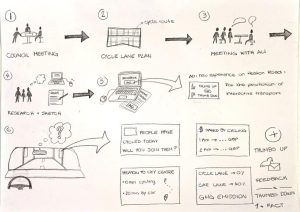
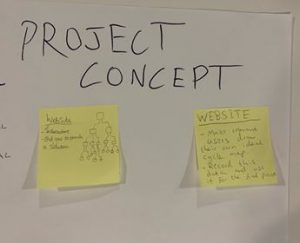
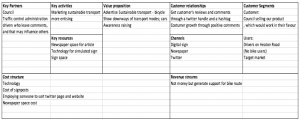
Later in the week we had a workshop on business modelling by Steve Bowden. This  helped us understand how to better our pitch for the proposition of our idea. And taught us how to make a Business Model Canvas.

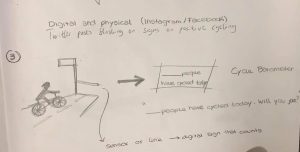
Business model canvas are based on key partners, key activities, key resources, value proposition, cost structure, customer relationships, channels, customer segments. We figured while doing ours and talking to Steve, that we would have customers (City Council) and users (Heaton Road passers-by) and we could both see our design as a service or product.

Next week we plan to finalise our presentation more, adding the final information with the prototype test feedback, and correct it based on the last presentation feedback, to get it ready ready to present the week after, and to start bringing our blog posts together into a final log for for assignment due dates.


LOG WEEK 9 – NUTC

This week we focused on getting the prototype test scenes done. Since we do not have the technology of the sensor (to identify the thumb up or down), we chose to do the prototype in a powerpoint presentation, we believe this method will be most efficient to display our ideas and present them in the most realistic and interactive way.

The slides show a scene sequence explaining how our design works and what would be the order we imagined it displaying, starting with a newspaper ad, followed by a street viewer scene and the drivers view of the traffic light. Then the different signs are shown and a voting system in powerpoint allows the user to actually vote as it would happen in real life. Depending of the users choice, a different sign or the Twitter handle will follow.

The scenes were made using Canva, Photoshop and Balsamiq, to create the signs layouts and the slides scenes, and a decision map was made explaining how the order the signs would be shown depending of the vote.

We have arranged to meet with Mark, Julie and Ali to test our prototype and see if they approve of our designs. We plan to do this within the civic centre which will be a fairly formal setting but very appropriate as this is where elections sometimes take place or ballots involving the public. We aren’t planning to ask questions during the prototyping but to explain our ideas more and how did we prepare the presentation so they understand when we expect them to actually interact and vote, so we can let our testers have a play around with our project to get to know it a bit better.

User Test Plan:

We believe our prototype is more a service than an actual device and we expect to find out if our users believe it would be effective for Heaton. We also want to find out if after testing it they agree that it would be a good method to introduce the idea that cycle routes are beneficial.

We know the ideal participants would be Heaton road passers by and residents such as Julie herself. But due to Ali’s wishes for us to keep this out of the public as much as possible, we decided to include her, Mark and third party to test it also.

We intend to start the testing with 5 act interview, welcoming the users, asking what kind of travellers are they, if they normally pass by Heaton road… Then, introduce the prototype, explain what it is and how we expect them to interact (after the scenes start voting). Fourthly, task – get them to carry out tasks on the presentation. Fifth, quick debrief to confirm whether they believe it is effective and would be successful.

For this testing we will only need a computer with the presentation and the users. We believe it will be very accessible and easy to perform the testing.


Week 8 Log – NUTC

Log week 8

This week, we started to polish our prototype ideas and which softwares will we use to accomplish our prototype design. We decided to use Balsamiq, Invision, Photoshop, InDesign, Sketchapp and Powerpoint. We have interpreted an interactive prototype as something visual where the people themselves can follow the storyboard that we will present, compared to as if they would play a video or computer game.

For our prototype, we decided to do a scene presentation explaining how would it work from the drivers or pedestrians vision. We intend to create the signs design and to explain how would the entire process work. As we have explained on the previous logs, the prototype is a informative digital sign with a sensor, which the participant after reading a fact would respond with a thumbs up or down to then get a Twitter handle or another fact. On our presentation we hope to be able to show exactly what would be presented to the passers-by, and what their next move would be.

Our group is currently refining the final ideas and trying to get to a final key concept to present in the end of this module. We have divided the work by taking different roles, that is, maker, stitcher, writer, collector and interviewer. Although, we decided that the group will work together and be apart of any role, in order for everybody to be on the same page during the whole process. But we do keep in mind that some of us are more skilled in some of the roles, for instance Gabriela has created the latest visuals for the final presentation, while the others have been collecting information and researching facts about the benefits with cycling as a transportation mode. We have not yet decided who is going to be the interviewer during the final presentation, as well as who to invite for it (but we intend to make Ali, Mark and Julie part of this).

Next step is to continue further with the research about the sensors and how they would work for our interactive signs. We will also continue to read on the different example projects (Australia for Vote etc.) in order to be able to back up our project as well as possible during the final presentation.

These pictures below show the creative process of some of the visuals that we are planning to use for when presenting the final prototype. These were made on Balsamiq and Photoshop.

The visual part of our presentation will be composed by, besides an introduction of the project and example research, introductory scenes that shows the storyboard from different perspectives, for example Heaton Road looking from the “outside” and from a “car view”, signs, thumbs up and thumbs down, responses and a phone with the twitter hashtag #thumbsupheaton.

For the prototype completion we would need more pictures, and the final designs of the facts signs and the Twitter handle sign, in order to include the whole story board that we have created earlier. Combining the new examples and the further research with the prototype designs we believe the we would be able to start with the final presentation.


Week 7 Log -NUTC

Log week 7

Sketch and Explanation of Prototype

This week, we began to prototype our design. From our storyboard we decided to visualize the interactive screens. The plan is to place them on traffic lights so that both pedestrians and car-users will be able to get involved with this project. Our prototype illustrates how a participant approaches one of a number of signs, that will be placed along Heaton Road. As mentioned in last week’s log the signs will display facts or tweets advocating cycling as a mode of transportation. The participant would then make a thumbs up or down, depending whether the participant likes the text that is being shown on the sign or not. Sensors on the sign would then register the thumbs up or down through Infrared & Motion Sensors and then, depending on whether the participant responses with a thumbs up or down, will lead to the #thumbsupheaton hashtag or a different cycle fact.

Extended research

This week we also looked further into research relating to our project. We wanted to find some examples that we could directly get information from. We looked into the Australian vote with your feet project, which helped us to think more about the type of interaction with the public we will have. We have found many different projects that use the same type of sensory technology although not as many that focus on the thumbs approach.

https://www.dezeen.com/2015/06/02/google-project-soli-interaction-sensor-radar-hand-gestures-digital-control-electronic-devices/

This example uses hand gestures to control electronic devices, we partially can take inspiration from this as we need to the hand gestures to be able to read and control our signposts.

Cycle facts

These are some of the facts we plan to use on our sign posts:

Environment

Traffic congestion

Health

Economy

  • The average cost to drive a car in the UK is £3500 a year, a bike can be as little as £100

Safety

What we will use to prototype our sign-posts

  • Pen and paper – early stages
  • Research & findings
  • Inspiration from previously created websites e.g.
  • Potentially we will use Balsamiq
  • Slideshow
  • Motion and infrared sensor technology

Next week’s aims

  • To carry on with our prototyping ideas and to hopefully begin to give roles within the group for prototyping so our tasks are all organised
  • For our storyboarding to all be completed
  • To have clear target users
  • To get our drawings into one big concept which will be our final digital concept

Week 6 Log – Storyboarding – NUTC

Week 6 Log – Storyboard

For the second part of this lesson, we decided what sketches and ideas would help bring our idea forward. We manifested this through a storyboard which depicted a theoretical, step-by-step process. It stems from the Newcastle City Council meeting where the main issue was addressed and the project discussed. We then looked at the official cycle lane plan to see what the council has done so far and how we can implement it to achieve our goals. Furthermore, we met with Ali Lamb who explained the whole procedure, we then began our group project and drew up our idea, along with its objectives and identified the surrounding issues such as stakeholders and opposition. This can all be seen on our hand-drawn storyboard.   

Final Idea

Through a long and insightful process of discussing and drawing up ideas, we collaboratively decided on a final concept for our NUTC project. The aims of the project were to advertise a new and extended cycling route for all and ultimately to convince residents and stakeholders of the advantages of this project and bring the issues surrounding it to a larger scale.

With this in mind we came up with a solid project – a series of digital, interactive sign posts for cyclists, drivers and pedestrians on Heaton Road. The way this would work is that the digital screen would display informative facts about the advantages of cycling for the environment and and show this to passers by so they can gain awareness of the positives it brings.

Our digital sign would be one of many, in different locations around Heaton Road (for increased exposure) and have a multicoloured digital face. It will display text as well as the twitter feed from our #thumbsupheaton campaign. In order to increase awareness of our project idea, this will be accompanied by a side project where we will create advertisements to promote this before the signs are introduced so people are aware of them coming – through leaflets, paper posters in the local area as well as Facebook adverts.  

Space for Heaton meeting

Apart from this we have also met with Mark and Julie. They gave us some more input about the project as well as explained the whole vision, which among other things is to connect the lower parts near Byker to High Heaton through a cycle route. As shown on the map, this cycle route runs through Heaton Road, which makes it a part of a “much bigger thing” that would promote future development in this area. After the meeting we decided that NUTC’s job is to inform the general public about the advantages with this vision, i.e the decrease of air pollution rates of the area, reduction of traffic congestion, improvement of health, offer of safe travel for children, elderly and disabled.

Next weeks plan

Our plan for next week is to start prototyping, as we feel satisfied with our ideas presented on the storyboard. We will also continue to search for project examples that are similar to our proposal. One of the main projects we want to look into are Vote with your feet and Vote as you go from Australia.

Week 6 Log – Sketching – NUTC

Log Week 6

Sketching

This week we began to pull all of our ideas together into sketches and a final storyboard for our choice of project. We had a range of ideas between us, all inspired by our previous research into cycling projects in the past/present.


Our ideas

Some of our ideas were the likes of using barometers to collect data of cyclists going by, animated signposts in which a thumbs up/down could be registered by the sign to see if people were to find it interesting or not, resulting in either more facts on the post or a link to a website/ twitter page in which people can leave positive feedback. We also came up with simpler ideas like bluetoothing/ airdropping people facts on their phones at certain points on the road so they are able to see benefits of the potential project, or even simple posters put up around Heaton to catch people’s attention or on buses.

Our Feedback From our Mid-term Presentation

Along with our seminar work we also completed our midterm presentation this week. We felt like this went okay and we got a lot of helpful feedback. From this feedback we realise we should do some more research into all aspects of our project, including other projects like ours from which we can get more inspiration, bus timetables and routes so we can supply the knowledge of other alternative transport methods to driving and needing to park along Heaton Road. We want to include more pictures from our site visit and our meeting with Julie and Mark, this wasn’t asked of us but came from our own personal reflection on the presentation. One final point given to us was to think about where we will display our signs.


Week 5 Log – NUTC

LOG WEEK 5 

This week we met with one of the academic partners that mentors us, Tom Maskell (PhD student in Open Lab) who happens to have a background in walking and cycling connections for the community.  He introduced us to the newcastle walking cycling routes website in which he participated in the creation of. This website was able to show us the main concerns by the general public and where these were located on a map.  This is mainly coming from walking and cycling advocates – most comments are green so they believe it is very important, the red and yellow are less important. ( which suggests there are not many drivers as there aren’t many red and yellow.)

https://newcastlewalkingcyclingroutes.commonplace.is/comments/5beefcc45a173b000e05ac22

Our group discussion with our mentor led us to review our project aims as we currently didn’t have a main focus. Tom helped us to understand the best way to use our projects user research and the examples that inspired us to get to the point we are at. He also made us realise that we should do something interactive along Heaton Road that could be seen either by cyclists and pedestrians or drivers. 

The Ladder of Participation 

Tom reminded us of The Ladder of Participation which we had heard of before but had forgotten about. He explained to us it’s very important to think about our approach to the project and to use this ladder to determine if we wanted more of a manipulative method of making the public more accustomed to the cycle route or if we wanted to be more informing and consult the public more on what they wanted.

Our Best Approach

After an intense group discussion we figured that our best approach should be a more persuasive one, closer to the middle/bottom of the scale, in which we could try to persuade the people sat on the fence or were fully opposed to the cycle route. We came to the conclusion the project is at its final stages of being given the go ahead, with one big final consultation happening in early May and then just the legal processes to be completed, so collecting people’s opinions wouldn’t be as relevant to just trying to change those of the opposed, as the project is shortlisted and one of the councils favourites to happen.

Process

After deciding our main purpose we came up with many different questions of how to actually get across our aim to the public. These questions can be seen in the picture below in which some of our main questions were :

  • who’s trying to convince who? Us or the public?
  • Will we try to target individuals or groups?
  • Would we want to use data/prove, discussions or tell stories to convince people?

In the end we decided our main target would be finding the correct data to answer the question ‘how can people benefit?’ as this would motivate them to change their opinions. We think people would be led by the reduction in costs, health benefits, the advancement in helping the planet (Carbon Footprint reduction), making Heaton a safer environment and if they knew other transport methods were available and easier to use they may be swayed by that. 

Conclusion

We have been trying to come up with as many ideas as possible ready for next week in which we are to begin sketching our final project ideas. We still like the idea of a form of an interactive decision map or signs along Heaton Road with phases that show people the benefits of cycling, and we also like the sound of the Cycle Barometers in which Tom introduced us to.

Although the last one may be too much of an expensive method and more focused on the cyclists and not the people who are opposed who’s minds we are trying to change. We are hoping to have made our mind up on this ready for our next lecture.


Week 4 Log – NUTC – Example search

Log week 4

This week we followed up on our idea of taking a site visit to Heaton Road here we managed to talk to a few of the locals and gather some ideas of how they felt about the project. Most of them seemed to be happy with the idea of a cycle lane although these people claimed to be cyclists themselves so it coincides with the data we found on the website ‘streets for people’ (51% wanted segregated cycle lanes). A couple of the people we spoke to said they were drivers of cars and would struggle with the addition of a cycle lane, due to the lack of parking spaces that would become a reality once the lane was installed.

Our Inspirations 

This research was inspired by a project we found in the Netherlands about How to turn a Car city into a Cycling city*. As most of the cities (both in this project and in general) were planned and designed for the car, the first thing that had to be done was “appeasing the motorists instead of encouraging cyclists”. As we have written before, Heaton Road is very “car-occupied”, which makes this reference project very relevant to our own project. It has  inspired us to do more further research into their ideas and how ours could relate seen as they were successful.

We also found this article** useful which was suggested to us by Sean. After reading through it we understood more about the concept of a “smart city” and how GPS, as well as other GIS tools, could be used to track the main cycle routes within an area. We were then also able to recognise the divide between the East and West were the West had hardly any cycle routes in comparison potentially down to the development of transportation and wealth of the area.

We spoke during the lecture about how negative comments would impact us and the project, and we have decided that negative comments would be our main target and we would focus on understanding them more and persuading the people to change their opinion. This is now one of our main project goals, alongside meeting the needs of the briefing given by Ali and creating a interactive/inclusive platform.

Our Concept 


We also began to come up with a concept for our project although we feel that we will be able to adapt this more after talking to the other project partners (Mark and Julie). One of the concepts was the idea of getting cyclists to map their ideal route and recording this information, then putting it into a map of sorts to show how useful the cycle route would be by connecting Heaton Road to other/ smaller cycle paths. The other concept was a interactive Decision Tree, we would make several questions which would have multiple answers provided already to choose from, leading to more questions, eventually ending up with one final answer, which would be an end goal of the cycle route being the best option for all users. This would be an online concept but we would also be able to make it as an interactive poster for people without access to the internet.  

This is an example of the format of a Decision Tree, although we believe ours would be larger. The “leaf nodes” would be one final answer for the participants.

Next week we are planning to visit Heaton Road again and to interview some of the stakeholders to get a wider range of views on the project and hopefully to begin to build upon our concept idea. We are also meeting the project mentor so hopefully we will gain some insight into their thoughts on the project and some much needed experience in the area. We also have our meeting with Mark and Julie arranged although due to unforeseen circumstances  this has been set back slightly.

References

*Link to reference project: https://nextcity.org/features/view/how-to-turn-a-car-town-into-a-cycling-city?fbclid=IwAR1ckGS1GZ-tyq5lrf_wh3yy4qd2owdLhLYOgG5topXSbMKYfzJ3AWH0ZMY [Online: Accessed 19-02-2019]

**Link to article:

https://ledantec.net/wp-content/uploads/2014/09/Le-Dantec-Planning-with-Crowdsourced-Data-CSCW15.pdf?fbclid=IwAR3FHHvqkw5f5ue3geihm0nwpHWlHdQmQyg-B_AhsobTz_BtbLac7kzeLQg  [Online: Accessed 19-02-2019]

Week 3 Log – NUTC

Log week 3

Hello, this week we decided upon our user research methods. We believe the best method for us would be to participate in detailed (structured) interviews with stakeholders and the general public, and also to take general observations of the areas usage. Within the seminar we came up with some brief questions, following this we met as a group to expand upon them more.

Planned site visit

This week we contacted Ali to try to organise a meeting with her, Mark (computer, tech side of the project) and Julie (environmental/health side of the project) although Julie wasn’t able to make the dates suggested, so we have agreed to try to meet up next week with them where we will be able to ask them more detailed questions about the project. As we cannot interview them this week we have decided to make a site visit instead to Heaton Road, to try to interview some of the locals and the stakeholders. We realise that we need different types of interviews for each set of people, some needing to more open and others more specific and closed to only certain groups of people who would know the answers or have experience with the questions asked. We would like to talk to a few of the people below, although we have been warned due to local elections to not focus on them too much. These would be users such as:

  • Residents (both alongside Heaton Road and nearby neighborhoods)
  • Cyclists
  • Stakeholders

Examples of our “open” to all questions – resident, general public etc.  

  1. What is your main usage for Heaton Road ?
  2. What are your usual methods of transport when on this road?
  3. Do you find parking spaces easy to find and are there a good amount of them?
  4. Would you find travelling along Heaton Road a positive experience, and why is this?
  5. What would you change, if anything, about Heaton Road if you could?

Examples of our “closed” for certain people questions – Mark, Julie, Ali, Space for Heaton etc.

  1. What is your main usage for Heaton Road?
  2. What are your usual methods of transport when on this road?
  3. How do you feel about parking along Heaton road?
  4. Do you find spaces easy to find and are there a good amount of them?
  5. What would you change, if anything, about Heaton Road if you could?
  6. Do you believe the changes would be beneficial for the area?
  7. What incentives would you think would lead people to want the changes made?
  8. What are the main reasons you believe people are against?

From these questions we hope to gain a greater insight into how people feel about the project and its outcomes, hopefully helping us to understand our project end goal a bit more, and the process in which we will develop our prototype to which will help us achieve this goal. We realise the reasoning behind why our research activities should be individual as to be the fact that many people should be be approached differently and we aim to get a less biased view of these things, alongside this the elections that Ali told us about play a large role in us needing to keep open questions as we wouldn’t want locals views to be changed due to our influence.

Additional Research

Streets for people ; Heaton and Ouseburn 1

Streets for people : Heaton and Ouseburn 2

After researching further into the Streets for People which is a local research method that has already been collected by the local groups, we found these two links which lead to posters including information on pedestrians, cyclists and drivers. This information showed us that pedestrians held the highest percentage of travel (42%) and cyclists came second with (34%) driving came in with the lowest percentage out of the three options (13%). We also took note that 51% of the people wanted a segregated cycling route, proving to us that this was a slightly more prefered option and our project is more favoured.


Week 2 Log – NUTC

Log week 2

This week we have welcomed Ben and Miki, who has become members to the NUTC. We also met with one of our project partners, Ali Lamb, who is the Engagement officer at Newcastle City Council. She talked a bit about her role and the project proposal for Heaton Road, as well as informed us about where it stands today. We then asked a couple of questions regarding the project and got together to identify the main stakeholders and the long-term goals what we want to achieve through a number of objectives.

The main stakeholders

With the help of Alis intel, we have done a mind map that presents the main stakeholders as well as their opposition towards the project proposal. The colour ‘Red’ represents the group that disagrees with the proposal, ‘Green’ represents the group that agrees with it and ‘Yellow’ represents the group who still remains undecided.

The stakeholders that disagree with the project proposal are:

  • Residents along Heaton Road
  • Services and facilities, such as Heaton medicals and Rugby/Cricket Pitch (University’s Sports ground)
  • The Corner House Pub
  • The People’s Theatre
  • The churches, e.g. St Gabriel, and the mosque

One reason to this has to do with them losing a number of parking spaces they will be facing. The stakeholder that would benefit from this cycle route project, and hence agree are:

  • The primary/secondary schools, who look for safe alternatives for their children to get to school, e.g. St Mary’s catholic school
  • Freeman Hospital
  • The Tax Office HM Revenue & Customs, who has over 10.000 employees
  • Cycling groups
  • Streets for people
  • The elective counselors important stakeholder, who also have the final say on which scheme goes forward, they support this project. Although, they are also heading towards an election so the project will be presented to the public afterwards.

Aims and objectives

Within our last blog we questioned what the actual form of the project would be, the state of the current situation and how connected it will be in the end. These were all answered by Ali and she helped us to understand the objectives of the project more along with the main aims.

Aims:

  • Advertising a cycling route for all and not only the existing minority of cyclists today
  • Convince the resistant stakeholders of the advantages with this project

Objectives to achieve the aims:

  • Site visit
  • Read findings report
  • Find other alternative transportation/parking options
  • Start with the concepts

Next Steps

Based upon the latest lecture we believe our next step is to focus on user research and how it would be more effective towards the outcome of the project if we have a plan for it beforehand. After speaking with Ali Lamb we have concluded that the website common place and the public platform streets for people will be the best way for us to conduct our research and gain a greater understanding of the public’s views on the subject matter.

Another next step we have considered is participating in a site visit to Heaton Road and beginning to survey some of stakeholders within the area, for example the local church, schools and businesses.

Using this diagram we intend to analyse the stakeholders and see their weighting within the project and see how we should act upon their perspectives on the project.

This week helped us to truly understand the main goal of the project and how we will play a role in the final outcome. Besides the research and site visit we now hope to also develop an understanding of what the best approach would be towards our users and how to get the most beneficial outcome from anyone involved in the project.