Week 8 Log – Greening Wingrove

Week 8 Log 


What is an interactive Prototype? 

Interactive prototypes aim to show how the interaction will work in practice. This is a much better way to evaluate design. Commercial prototyping software allows you to define clickable areas, transitions and events, in order to produce an interactive prototype that captures the user flow process and demonstrates interactivity, without having to write a single line of code. Basic programs such as PowerPoint and Keynote can be used to create such prototypes. You can use interactive prototypes in user tests before any code has been written. The whole point of having an interactive prototype, and prototypes in general is to ensure that the proposed design will work effectively in practice before spending money, time and effort developing code. 

Our Prototype  

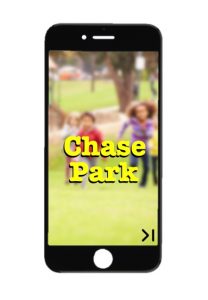
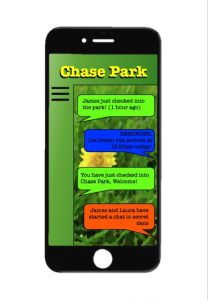
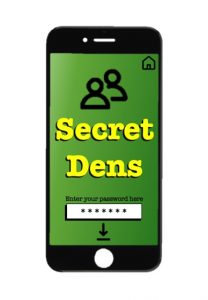
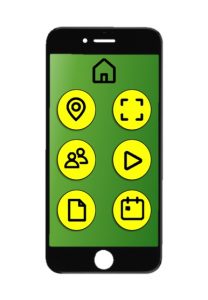
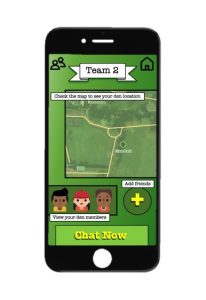
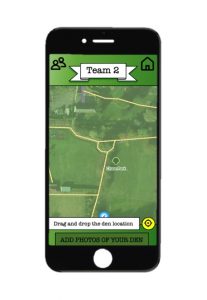
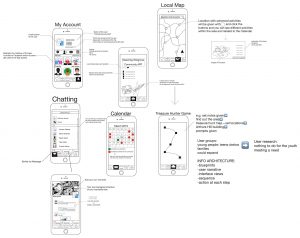
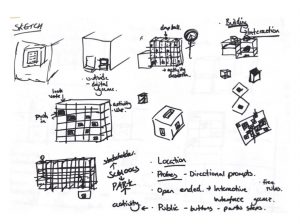
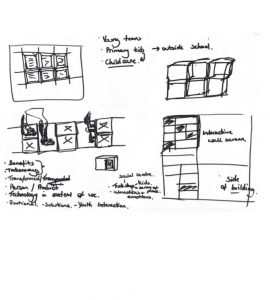
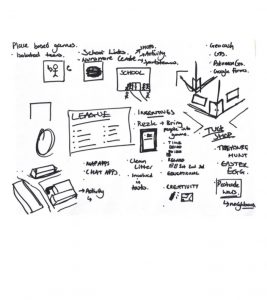
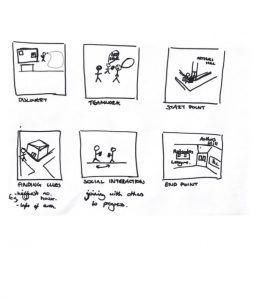
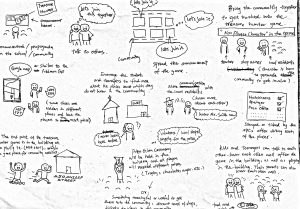
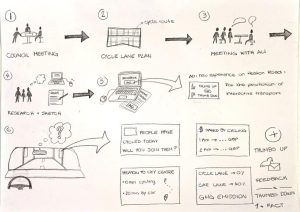
This week we began to work on our prototypes for our Wingrove Community explorer application. The prototyping tools we have decided to use for this project are in a 2D digital format through the use of Microsoft PowerPoint. Our application has two primary uses for its user. The first is to easily and effectively communicate with other residents, which is achieved through the use of a contacts search bar whereby the user can message other people to organize community events and gatherings. It works the same way as your contacts on your phone. The application also includes a calendar to pin community events that are of interest to the user, which is followed by a map which shows the locations of various events organized by the Wingrove Community in the local area. In practice, the map will be interactive giving the user the ability to tap and select locations on the map that they wish to explore. Once a location has been selected the user will see a picture of the location on their screen, and from there, they will have the option to select and search for activities within that vicinity or building. This is where our idea then overlaps with the creation of an interactive form of leisure for the local community. We have done this by implementing an activity section whereby the user can take part by completing tasks designated to various locations e.g. taking a picture of a community landmark within a certain area to prove that it’s been visited, or carrying out some kind of community activity and evidencing it with a picture. Though this feature was designed with primary and secondary schoolchildren in mind, anyone can use it. The whole purpose of our application is to provide community information on the go in a compact and simplistic format, whilst giving the user ways of interacting with and contributing to the local area, or simply keeping in the loop with other residents in the area. In terms of what still needs to be done to complete the prototype, we just need to add some finishing touches that explain and display all the features we intend to include within the application, such as the treasure hunt game. Our idea is basically a social media app for the local community to increase the participation and awareness of local residents.  


Week 8 – Chase Park

This week we looked at prototyping and made a start on creating our own interactive prototype. An interactive prototype is something which is ‘real’ for the user to look at and use. For example, they would be able to navigate around an app clicking on buttons which then moved to a different page etc. so that it feels the functions are real.

We have decided to use PowerPoint for our prototype of our app. PowerPoint is a simple tool for creating a prototype, but it is a tool which we are most familiar with and think it will be able to perform all the necessary functions that we need on our app. We will show our prototype by getting people to go through the prototype app on the PowerPoint by simply beginning the slide show and then the user can click on the buttons, such as a ‘main menu’ button or a ‘home button’ to go back to the main menu, these will be linked with a hyperlink which will make it interactive and give it a feeling of ‘realness’ because things will happen depending on which icon or button you select. We still need to complete a few more interfaces of different pages to the app before it is complete, but below are a few pictures of what our current prototype looks like.


SIA Storyboard (Extra)

This one is the extra post of SIA’s storyboard blog and this is Zhaodong. This is the storyboard of the Greening Wingrove Community App and it is a little bit late to post it to the blog because of my personal issues so very sorry about that.

Basically the idea of the App is to provide a stronger connection between the community and one of our previous ideas was to make a treasure hunter game within the community and now we put the idea into the App which let it become a part of the App.  Apart from the front page the App has four basic functions: Chatting, Calendar/Activities, Local Map and ‘My Account’. On the front page you can see the local temperature and weather today as well as the news and announcements within the community. The treasure hunter game is set as the latest news here and can be clicked for mor info. and we made some analysis on it (you can open the picture attached and have a look). The chatting function is similar to the iMessage but apart them a new function is designed called ‘Moments’. You can share your own special events happen around you here and let your friends to look and make comments. Calendar/Activities function looks like the calendar on your phone but also shows the activities that will take place as well as the activities that you will attend and show you the location of the activities. For the Local Map function, the location with schemed activities will be marked and able to be clicked and you can see different activities within the area and these are related to the Calendar/Activities function. ‘My Account’ is very easy to understand: manage your personal account, make self-introduction to others, add more friends and precious pictures into your album. More infomation of the App can be seen in the picture attached within this post.

BLOG 7 – Preparing to Prototype

Leading on from last weeks extended storyboarding/sketching session, this seminar we worked on improving our location-based game idea and expanding the interface to include a map of Wingrove in which users could click on certain ‘hot spots’ and find activities or local information. We wanted to broaden the initial GPS game into something more tangible in which implementations to the local context could be made.

We began brainstorming some ideas for what could be included in the digital game/interface as we did not want to overcompensate and flood the interface with options. We narrowed in to focus on exploration activities and interactive digital inclusions such as camera options that would prompt digital probes in order to gain wider opinions on the local area and Greening Wingrove activities. We wanted to preserve the idea of having a treasure hunt feature, furthering this to think about engaging with the idea of including schools or families, to tackle the safe-guarding/ethical implications a location-based game may have.

For our initial plan, we thought about having a map as the home screen and placing pointers which the user could click on to participate in different activity options. Such as history tours or nature walks. Including options such as these it begins to broaden the location-based games into potentially becoming part of both youthful and family livelihoods, as it could be something that families want to use together to explore their area and get outside. This gives users a broadened scope of activities they could engage with whilst using the service as, although we are mainly focusing on a younger target market, the wider aim of social cohesion can only be met with a developed broadened user base. Our new refined storyboard will be uploaded in a separate blog post as we wanted to ensure it portrayed our ideas seamlessly.

Our idea of location and mapping is key in driving our aim of social cohesion, nationwide there is a lack of children playing outside, we feel that by having this game/app which enforces people to go outside and explore, with the win-win potential of gaining free or discounted activity incentives, it is responding to and tackling this urban issue on a local level. Organisations such as Playing Out address this, by attempting to ‘activate street play in neighbourhoods’.

In response to the digital interface’s unique aspects, the app is a personalised social media space for the residents of Wingrove, from our user research we found out that the Facebook pages are scattered and become very inactive shortly after starting up. Bringing all these pages together into one system would refine the area’s digital platform voice and provide a space for local events to be promoted and spoken about.


Moving forward, we would still like to begin to prototype the locational game based idea, focusing on the youth of the area as that group was at the forefront from the opinions of the participants of our user research. Our demo activity for the prototype may simply be a piece of paper with instructions, questions and locations on and then using google maps to travel around the map to complete the treasure hunt quest, or using development software to create and interactive prototype.

In terms of promoting and gaining further user research from our prototype, a youth workshop would have to take place, perhaps linking in with the primary schools or the Nuns Moor centre.

Our next steps are, to further develop and refine the technicalities of: 1) user narrative, 2) the information architecture and data of the interface and 3) initial design views of the interface. We want the product to be focused on the map idea, therefore having the design be centred around the map of Wingrove.

Week 7 Log -NUTC

Log week 7

Sketch and Explanation of Prototype

This week, we began to prototype our design. From our storyboard we decided to visualize the interactive screens. The plan is to place them on traffic lights so that both pedestrians and car-users will be able to get involved with this project. Our prototype illustrates how a participant approaches one of a number of signs, that will be placed along Heaton Road. As mentioned in last week’s log the signs will display facts or tweets advocating cycling as a mode of transportation. The participant would then make a thumbs up or down, depending whether the participant likes the text that is being shown on the sign or not. Sensors on the sign would then register the thumbs up or down through Infrared & Motion Sensors and then, depending on whether the participant responses with a thumbs up or down, will lead to the #thumbsupheaton hashtag or a different cycle fact.

Extended research

This week we also looked further into research relating to our project. We wanted to find some examples that we could directly get information from. We looked into the Australian vote with your feet project, which helped us to think more about the type of interaction with the public we will have. We have found many different projects that use the same type of sensory technology although not as many that focus on the thumbs approach.

https://www.dezeen.com/2015/06/02/google-project-soli-interaction-sensor-radar-hand-gestures-digital-control-electronic-devices/

This example uses hand gestures to control electronic devices, we partially can take inspiration from this as we need to the hand gestures to be able to read and control our signposts.

Cycle facts

These are some of the facts we plan to use on our sign posts:

Environment

Traffic congestion

Health

Economy

  • The average cost to drive a car in the UK is £3500 a year, a bike can be as little as £100

Safety

What we will use to prototype our sign-posts

  • Pen and paper – early stages
  • Research & findings
  • Inspiration from previously created websites e.g.
  • Potentially we will use Balsamiq
  • Slideshow
  • Motion and infrared sensor technology

Next week’s aims

  • To carry on with our prototyping ideas and to hopefully begin to give roles within the group for prototyping so our tasks are all organised
  • For our storyboarding to all be completed
  • To have clear target users
  • To get our drawings into one big concept which will be our final digital concept

Week 7- Team 2- Chase Park

After visiting the primary school we gained a bit more of an insight of what features we would like to include within our app. Sketching out ideas of what features the app would have and what they would entail, we decided to focus on one specific feature of our app that seemed to be a strong point when visiting the school. Secret dens were talked about a lot and we think this feature would make our app unique and feel we have a lot to work with. Sketching out further detail and features of this one specific topic, sketching the app as a walk through and how the children would use it.

SIA Storyboarding – Blog 6

SIA Blog 6

This week we began storyboarding our idea with the aid of Erkki Hedenborg, our academic mentor. We discussed many alternative options and finally honed our digital idea into a designed interactive game for social cohesion and community exploration.

During the beginning of the session we began drafting potential ideas for a digital solution, initial ideas started as digital interventions placed around Wingrove in specific points that would advertise activities and allow users to interact with it, by sound or movement for instance. We then moved on to discuss this interaction in a more physical manner by creating an interactive game. With this, users would gain insight into the Wingrove area, meet other locals, and gaining knowledge of potential activities happening. This is important as those we questioned in our door-to-door survey did note that they did not know of many activities taking place within the area.

The idea stems from the concept of location based GPS games such as Pokemon Go, Geocaching, and ActionBound, in which users have to explore an area to earn rewards or learn things about the specific area chosen. We wanted to replicate this idea by giving young adults/teenagers/kids the option to discover Wingrove and connect with other users to enhance their social connections within the area.

Potential ideas for prototyping this concept could initially be a piece of paper with set questions or facts on it and use of google maps to navigate the treasure hunt. Those using the game would have a set route to follow and have to pick up points along the way that would collate into a final league board, with those with the most points earning prizes or gift vouchers (potentially). Some reservations are held by having incentives to play the game, however we did then lead onto looking at having proactive rewards such as a free one hour music session, or one free activity session at the Nuns Moor centre. In doing this, this improves the users awareness of activities within the area, therefore subverting their attention indirectly to other recreational activities for the youth to engage with within Wingrove.

Below are some initial mind-mapping/sketching that led us to the interactive game idea.

. 

User Research

From this we took insight from our user research, as many of the people we interviewed discussed the need for more youth programmes and activities, by using the game idea it gives teenagers and kids the opportunity to play outside and embrace their area rather than having nothing to do. In addition, the use of the Arthurs Hill building as a central addition to the game to engage the youth of the area with the activities going on there, thus indirectly creating a youth centre/central point by having them physically visit the building. Katrina and David Webb both spoke about the need for youth engagement within the area, we feel targeting this group will then set the path for future generations to converse with one another and begin a narrative with them in Arthurs Hill and community engagement.

After including our user research we developed a final storyboard proposal which depicts the narrative of downloading the game to the end point of the game.

Storyboard

Next Steps

Our next steps include refining the game idea, deciding where the set routes would be, as well as potentially including different interfaces for alternative uses. The game idea does hold some reservations as we do need to define what exactly the user is putting in and getting out of the game, what sets this idea apart that would make users want to actively engage with it and also, perhaps developing what else the interface can offer, so that we define exactly how it meets our project aims.

Week 6 Log – Storyboarding – NUTC

Week 6 Log – Storyboard

For the second part of this lesson, we decided what sketches and ideas would help bring our idea forward. We manifested this through a storyboard which depicted a theoretical, step-by-step process. It stems from the Newcastle City Council meeting where the main issue was addressed and the project discussed. We then looked at the official cycle lane plan to see what the council has done so far and how we can implement it to achieve our goals. Furthermore, we met with Ali Lamb who explained the whole procedure, we then began our group project and drew up our idea, along with its objectives and identified the surrounding issues such as stakeholders and opposition. This can all be seen on our hand-drawn storyboard.   

Final Idea

Through a long and insightful process of discussing and drawing up ideas, we collaboratively decided on a final concept for our NUTC project. The aims of the project were to advertise a new and extended cycling route for all and ultimately to convince residents and stakeholders of the advantages of this project and bring the issues surrounding it to a larger scale.

With this in mind we came up with a solid project – a series of digital, interactive sign posts for cyclists, drivers and pedestrians on Heaton Road. The way this would work is that the digital screen would display informative facts about the advantages of cycling for the environment and and show this to passers by so they can gain awareness of the positives it brings.

Our digital sign would be one of many, in different locations around Heaton Road (for increased exposure) and have a multicoloured digital face. It will display text as well as the twitter feed from our #thumbsupheaton campaign. In order to increase awareness of our project idea, this will be accompanied by a side project where we will create advertisements to promote this before the signs are introduced so people are aware of them coming – through leaflets, paper posters in the local area as well as Facebook adverts.  

Space for Heaton meeting

Apart from this we have also met with Mark and Julie. They gave us some more input about the project as well as explained the whole vision, which among other things is to connect the lower parts near Byker to High Heaton through a cycle route. As shown on the map, this cycle route runs through Heaton Road, which makes it a part of a “much bigger thing” that would promote future development in this area. After the meeting we decided that NUTC’s job is to inform the general public about the advantages with this vision, i.e the decrease of air pollution rates of the area, reduction of traffic congestion, improvement of health, offer of safe travel for children, elderly and disabled.

Next weeks plan

Our plan for next week is to start prototyping, as we feel satisfied with our ideas presented on the storyboard. We will also continue to search for project examples that are similar to our proposal. One of the main projects we want to look into are Vote with your feet and Vote as you go from Australia.

Week 6 Log – Sketching – NUTC

Log Week 6

Sketching

This week we began to pull all of our ideas together into sketches and a final storyboard for our choice of project. We had a range of ideas between us, all inspired by our previous research into cycling projects in the past/present.


Our ideas

Some of our ideas were the likes of using barometers to collect data of cyclists going by, animated signposts in which a thumbs up/down could be registered by the sign to see if people were to find it interesting or not, resulting in either more facts on the post or a link to a website/ twitter page in which people can leave positive feedback. We also came up with simpler ideas like bluetoothing/ airdropping people facts on their phones at certain points on the road so they are able to see benefits of the potential project, or even simple posters put up around Heaton to catch people’s attention or on buses.

Our Feedback From our Mid-term Presentation

Along with our seminar work we also completed our midterm presentation this week. We felt like this went okay and we got a lot of helpful feedback. From this feedback we realise we should do some more research into all aspects of our project, including other projects like ours from which we can get more inspiration, bus timetables and routes so we can supply the knowledge of other alternative transport methods to driving and needing to park along Heaton Road. We want to include more pictures from our site visit and our meeting with Julie and Mark, this wasn’t asked of us but came from our own personal reflection on the presentation. One final point given to us was to think about where we will display our signs.


SIA Week 5 Log

This week we researched further into digital solutions for public engagement and we found some examples which deal primarily with engaging public opinion on a local level. From our seminar work we found the example ‘Viewpoint’, which is a digital interface that allows residents to vote and submit their opinion on local matters. The original Viewpoint technology was developed as part of the Bespoke project and it allowed local councillors and community organisers to ask simple questions with binary answers. A concept like viewpoint would reduce the time needed to complete door-to-door surveys. It would also remove the unpredictability of uncertainty, as we found out, door-to-door are not always successful. Cons of the product however, include the loss of the personal face to face conversation that community thrives on, the lack of explanation or elaboration of peoples’ opinion.

The Viewpoint example can be seen at: https://blackboard.ncl.ac.uk/bbcswebdav/pid-3867159-dt-content-rid-13421720_1/courses/K1819-TCP2031/Reflections%20on%20Deploying%20Distributed%20Consultation%20Technologies%20with%20Community%20Organisations.pdf

We hope to continue looking for more examples in the following days.

We also finalised our user research tasks and performed door-to-door surveys around the streets of Wingrove with one of our project partners, Katrina, the Greening Wingrove CIC Community Organiser. Whilst surveying local residents we also took this opportunity to interview Katrina about her personal thoughts on the area and the aims for the Arthurs Hill building. She spoke passionately about the need of more activities for the youth, ranging from toddlers to teenagers, and about the interconnection and potential link the building could have with other community facilities within the area, such as Nunsmore park.

From our door to door survey we obtained 20 responses. Of the people who answered the door their opinions seemed to echo Katrina’s in their vision for a thriving youth programme within the area. Below are the questions we asked and the most common responses we received:

What activities or events usually take place in this area? This question received various responses including Greening Wingrove events, Nunsmore litter picking, community groups and parties. However, of the 20 responses, 10 said that they did not know of any.

What are the changes Arthur Hill should make to become more socially environmental? The most common response was creating or finding things for the youth to do, such as having kid’s clubs. There was also mention of waste management, a community centre and a social media platform for communication.

 How do you feel about interaction within the area? (Ranked 1-5, 1 = poor, 5 = good) Out of the 20 responses, the average response given was 2.7, which is a fairly poor response. Not a single person gave a 5 response and 1 was given four times.

How close are you with your neighbours? (Ranked 1-5, 1 = poor, 5 = good) Out of the 20 responses, the average response given was 2.6, which is also a poor response. From this question and the one before it is clear that there is room for improving social interaction in the area.

Do you wish to improve your interaction with your neighbours? (Yes or No) 13 respondents said that they would want to improve interaction with their neighbours.

Do you think a digital platform would help with this? (Yes or No) 15 respondents said that they believed a digital platform would help with improving interaction in the area.

What is your experience of using local facilities? (Ranked 1-5, 1 = poor, 5 = good) The average response received here was 2.9, so just below a satisfied response. Again this proves there is room for improvement.

What local facilities do you often use?  This question received a wide range of responses including restaurants, church, cafes, Time Centre, transport, shops and supermarkets. However, the most frequent response was green spaces and parks.

How often do you use existing local facilities in a week? From the responses, the average response was 2.4 times a week. The most common response was once a week.

Do you use existing social platforms (such as Facebook groups) regularly? (Yes or No) Only 10 of the 20 respondents said they use existing social platforms regularly.

What do you use these social platforms for? Of those that said they used the social platforms, entertainment and news were the most common response. Arranging meetings and reporting issues were the other responses given.

 Whilst surveying door-to-door, we did come to the realisation that this method is not as successful as pre-arranged interviews or meetings, it is a long process with little outcome. We felt that for the most part, a digital solution could be a highly effective potential going forward, taking inspiration from the Viewpoint boxes, which we found in our example search. From this, our digital design could be focused on gaining a broad and ranged opinion from a digital polling system. Whether this could perhaps be an interface inside/outside the building or in local shops/cafes is something we would have to discuss further.

Another idea that came from the user research was potentially creating a digital interface for the youth of the area to connect with the building, and the area, as we learnt of the hardships of many of the families within the area. It could potentially be worth-while to create an interface for the youth of the area, as many come from disenfranchised homes, some even being crammed into a house with 5 or 6 families, as we learnt from Katrina.

Our next steps for the project is to begin mapping out and sketching our digital interaction solution. Bringing together both our example search and user research to create the best solution for public engagement and interaction within the Wingrove area.