Modelling change and adaptation in infrastructure systems: state-of-the-art modelling and simulation approaches @ TU Delft, Netherlands, 14th May 2013

As part of the geospatial engineering team’s on-going involvement in the ITRC project, researcher David Alderson was accompanied by newly-recruited Computing Science PhD student Mr Razgar Ebrahimy to attend a workshop kindly organised by Margot Weijnen, at TU Delft entitled “Modelling change and adaptation in infrastructure systems: state-of-the-art modelling and simulation approaches”. The workshop aimed to bring together researchers and academics from the Next Generation Infrastructures (NGI) team at TU Delft, representatives from across work streams 1 and 2 from ITRC (), and also welcomed the visit of Research Director of the SMART Infrastructure Facility at the University of Wollongong, Australia, Professor Pascal Perez, with the aim of sharing experiences, projects and outputs of each research team to help further build and maintain the research links and community developing between these three groups.

The morning session of the workshop consisted of a series of short presentations, each delivered by a representative of one of the afore-mentioned groups, with a view to then discussing some of the topics and concepts raised during the post-presentation discussion session. Initially we heard from Professor Paulien Herder about how research in to the current and possible future states of infrastructure systems should be considered as a combination of understanding both the traditional physical, technical components thought of when infrastructure comes to mind e.g. power stations, roads, water treatment works, but also the social actors that operate, maintain, build and ultimately consume services offered by infrastructure. Many studies of infrastructure systems tend to focus on the technical aspects of the systems, which are clearly of paramount importance to being able to deliver the levels of service society has become to expect when interfacing with infrastructure, but perhaps do not consider enough the impacts that “people” have on the performance and evolution of infrastructure over time.

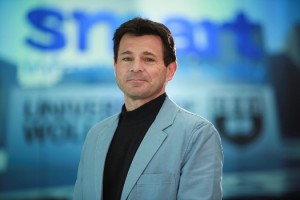
The audience subsequently heard from Pascal Perez about the great work being undertaken at the University of Wollongong, Australia as part of the SMART Infrastructure Research Facility. A key aspect of the outcomes from Pascal’s presentation, was again the need to think about how the social actors play a role in the infrastructure “complex” system. This was of particular focus when thinking about the economic benefits of infrastructure service provision, and the conundrum as to whether it is society that drives the economic growth/decline in the first instance leading to either increased/decreased demand for infrastructure services, or whether economic growth/decline leads to changes in societal make-up and thus acts as the stimulus or suppressant for infrastructure demand and supply. The “chicken-and-egg” discussion point of whether it is the economy driving society or vice versa was of particular interest to Professor Peter Tyler (ITRC), Ed Oughton (ITRC) and Robert Carlsson (ITRC) who are interested in understanding the interactions between infrastructure and the economy, whether at a national, or regional level.

From a more technical perspective, the audience learnt about the excellent work being undertaken at SMART with respect to their development of a regional, SMART Infrastructure Dashboard, helping to enable infrastructure decision makers gain access to a plethora of infrastructure-related information via a tablet/mobile-compatible interface. The technical components, but also the design process through which this dashboard has been developed is of particular interest to work stream 1, 2 and 4, as it is the intention that something equivalent be prototyped and developed to potentially enable UK-based policy makers and planners, as well as scientists and researchers, to ability to access outputs from the various capacity and demand modelling activities from work stream 1, as well as looking at the possible infrastructure failures as part of work stream 2.

A mixture of further presentations by Pieter Bots, Igor Mayer and Igor Nikolic focussed more on the ways in which infrastructure systems and complex systems can be modelled and evaluated. In particular Pieter, thankfully, raised the point of ensuring that modelling, and the subsequent dissemination of results of those models, be tailored to suit the problem or challenge to be solved, but also tailored to the audience to which the results are being presented. A “one-size-fits-all” approach to dissemination is not an appropriate solution as the types of questions to be asked of complex systems by different audiences, may require different tools, techniques and visualisations suited to each audience. This ideal fits well with the approaches being thought about within ITRC, where tools developed will need to be adjusted to suit the needs of those using them. For example a three tier approach could be conceived to determine the functionality of any interface to infrastructure modelling data, whereby the highest tier offers access to information to a wider audience but allows decreasing levels of functionality and therefore reduces the complexity of questions that can be asked, against the lowest tier offering potentially more analytical capabilities but to, for example, only researchers within the relevant fields.

However, Dr Mayer’s presentation and discussion focussed on the potential application of gaming, or correctly termed, “serious gaming” to help evaluate the interactions between the social and technical aspects of the complex infrastructure system. For further information on some of the evaluation work, and other projects undertaken by Dr Mayer and his team, can be found here. It was particularly interesting to here how this approach allows the individual stakeholder to actually be immersed in the model or environment itself, and how their interaction or reaction to particular events or shocks can be evaluated as examples of how user’s interact with complex infrastructure systems outside the test environment. Dr Mayer raised a point heard previously when considering the use of games to evaluate socio-technical systems and that is to ensure that the appropriate level of abstraction from reality is applied such that a user does not become too disconnected from reality and as such does not interact in a manner as close to mimicking interaction with the “real” system as possible. This abstraction is important at both the functional level in terms of what functions any model is representing, but also in terms of the physical representation of real world features in a computer environment, whether that is in terms of selecting appropriate temporal and spatial scales across which to model a system. One drawback however, highlighted as part of the discussion sessions during the course of the day, was that the use of serious gaming to evaluate interaction can really only be performed a handful of times due to the restrictions of having to utilise people heavily in the evaluation process, and so this can make it difficult, to repeat evaluation activities.

Dr Nikolic helped to conceptualise the problem of complex adaptive system modelling, giving a great overview of what is really happening when a modeller models something. Dr Nikolic stated that any model, or any system is effectively a three-step abstraction from reality, with the level of complexity found within each of the following steps, increasing from left to right:

Computer Model <- Modeller’s Conceptualisation <- Stakeholder Understanding <- Reality

This was an interesting point to raise, and highlighted the necessity to include as many relevant stakeholders in the modelling design process to help capture as much of reality from different perspectives as possible. However, the audience agreed that stakeholder interaction and engagement, especially when thinking about the multiple actors involved in modelling complex infrastructure systems, can be one of the most challenging aspects of the modelling process.

Further during the post-lunch session of the workshop we heard about some great research efforts being undertaken in TU Delft to help develop tools and methods that can help in the modelling of complex systems. For example, Dr Gerard Dijkema, delivered a fantastic presentation on behalf of PhD student Chris Davis and others on the Enipedia database developed at TU Delft. The database contains relevant information on power generation facilities worldwide, gleaned by marrying together different linked open data sources available across the web. Clearly something of this nature is not only interesting in terms of a pure inventory of information, but is also of interest as a repository of information for energy-sector modelling purposes. The Wikipedia-style nature of the database, allows online users to edit information, as well as review different visualisations, plots, charts, maps, graphs of energy-sector information. These types of tools are now being used within TU Delft to help in further research work, and underlines the importance of trying to use consistent data sources for these areas of modelling activity.

Overall the workshop was a fantastic opportunity to see some of the research being undertaken within the Next Generation Infrastructure group at TU Delft, and subsequently further enhance potential collaboration opportunities between that group, UK ITRC and SMART, Australia. Many thanks to Margot Weijnen and her team for the invitation! It is likely that a similar workshop will be organised and hosted within the UK, for some time in 2014 to help continue building the links between the NGI, ITRC and SMART infrastructure research teams.


UK Infrastructure Transitions Research Consortium (UK ITRC) Next Generation Infrastructure Logo SMART Infrastructure Facility Logo

Seminar by Prof. Pascal Perez on urban simulation and planning

TransMob: A micro-simulation model for integrated transport and urban planning.

Prof Pascal Perez, SMART Infrastructure Facility, University of Wollongong, NSW

4-5pm, 24th May, Room 2.32: Cassie Building, Newcastle University

To book your place please register online


How will current socio-demographic evolution affect future transport patterns and traffic conditions?

How will urban development and transport policy influence the quality of life of various segments of the local community?

The ‘Shaping the Sydney of Tomorrow’ Project (StSoT) was commissioned by Transport for NSW (Australia) to better understand the interactions between transport and land-use dynamics as experienced by individuals and households over extensive periods of time (15-20 years). Stepping away from traditional optimisation, our model focuses on anticipating short and long-term emergent consequences and feedbacks resulting from interactions between people and their urban environment, through the creation of ‘what-if’ scenarios (risk assessment approach).  The innovative design and development of TransMob aims to challenge three traditional but highly limiting modelling assumptions:

•Long-term steady-state equilibrium of the system: in fact, transport services and urban development co-evolve along with socio-demographic changes in highly dynamic ways and out of equilibrium.
•Feed-forward effect of urban development on transport networks: in fact, evidence suggests that there is a strong feedback effect of transport solutions onto land-use changes.
•Homogeneous and utility-based social responses to transport and land-use planning: in fact, there is more to decisions on transport modes or residential locations than pure micro-economic reasoning; most unintended consequences stem from unexpected heterogeneous individual considerations.

TransMob is made of six modelling components: (1) synthetic population, (2) perceived liveability, (3) travel diaries, (4) traffic micro-simulator, (5) transport mode choice and (6) residential location choice. The model is applied to the inner south-east area of Sydney metropolitan area and simulates the evolution of around 110,000 individuals and 50,000 households over 20 years, according to various transport and land use scenarios.

Linking OpenLayers, D3, JSON and NetworkX to build a topological and geographic network viewer

As many of the networks that I am building as part of my involvement in the Infrastructure Transitions Research Consortium (ITRC – www.itrc.org.uk) are inherently spatial, I began thinking about how it might be useful to be able to visualise a network using the underlying geography but also as an alternative, the underlying topology. I began exploring various tools, and libraries and just started playing around with D3 (d3js.org).  D3 is a javascript library that offers a wealth of widgets and out-of-the-box visualisations for all sorts of purposes. The gallery for D3 can be found here. As part of these out-of-the-box visualisations it is possible to create force directed layouts for network visualisation. At this stage I began to think about I can get my network data, created by using some custom Python modules, nx_pg and nx_pgnet and subsequently stored within a custom database schema within PostGIS (see previous post here for more details), in a format that D3 can cope with. The easiest solution was to export a network to JSON format as the nx_pgnet Python modules allow a user to export a networkx network to JSON format (NOTE: the following tables labelled “ratp_integrated_rail_stations” and “ratp_integrated_rail_routes_split” were created as ESRI Shapefiles and then read in to PostGIS using the “PostGIS Shapefile and DBF Loader”).

Example Code:

import os

import osgeo.ogr as ogr

import sys

import networkx as nx

from libs.nx_pgnet import nx_pg

from libs.nx_pgnet import nx_pgnet

conn = ogr.Open(“PG: host=’localhost’ dbname=’ratp_networks’ user='<a_user>’ password='<a_password>'”)

 #name of rail station table for nodes and edges

int_rail_node_layer = ‘ratp_integrated_rail_stations’

int_rail_edge_layer = ‘ratp_integrated_rail_routes_split’

 #read data from tables and create networkx-compatible network (ratp_intergrated_rail_network)

ratp_integrated_rail_network = nx_pg.read_pg(conn, int_rail_edge_layer, nodetable=int_rail_node_layer, directed=False, geometry_precision=9)

 #return some information about the network

print nx.info(ratp_integrated_rail_network)

 #write the network to network schema in PostGIS database

nx_pgnet.write(conn).pgnet(ratp_integrated_rail_network, ‘RATP_RAIL’, 4326, overwrite=True, directed=False, multigraph=False)

 #export network to json

nx_pgnet.export_graph(conn).export_to_json(ratp_integrated_rail_network, ‘<folder_path>’, ‘ratp_network’)


Having exported the network to JSON format (original data sourced from http://data.ratp.fr/fr/les-donnees.html), this was then used as a basic example to begin to develop an interface using D3 to visualise the topological aspects, and OpenLayers to visualise the spatial aspects of the network. A simple starting point was to create a basic javascript file that contained lists of networks that can be selected within the interface and subsequently viewed. Not only did this include a link to the underlying file that contained the network data, but also references to styles that can be applied to the topological or geographic views of the networks. A series of separate styles using the underlying style regimes of D3 and OpenLayers were developed such that a style selectable in the topological view used exactly the same values for colours, stroke widths, fill colours as styles applicable in the geographic view.  These stylesheets, stored within separate javascript files are pulled in via an AJAX call using jQuery to the webpage, subsequently allowing a user to select them. Any numeric attributes or values attached at the node or edge level of each network could also subsequently be used as parameters to visualise the nodes or edges in the networks in either view e.g. change edge thickness, or node size, for example. Furthermore, any attribute at the node or edge level could be used for label values, and these various options are presented via a set of simple drop down menu controls on the right hand side of the screen. As you may expect, when a user is interested in the topological view, then only the topological style and label controls are displayed, and vice versa for the geographic view.

For spatial networks, the geographic aspects of the data are read from a “WKT” attribute attached to each node and edge, via a WKT format reader to create vector features within an OpenLayers Vector Layer. It is likely this will be extended such that networks can be loaded directly from those being served via WMS, such as through Geoserver, rather than loading many vector features on the client. However for the purposes of exploring this idea, all nodes and edges within the interface on the geographic view can be considered as vector features. The NodeID, Node_F_ID, and Node_T_ID values attached to each node, or edge respectively as a result of storing the data within the custom database schema, are used to define the network data within D3.

At this stage it is possible to view the topological or geographic aspects of the network within a single browser pane. Furthermore, if graph metrics have been calculated against a particular network and are attached at either the whole graph, or individual node or edge level, they too can be viewed within the interface via a series of tabs found towards the bottom. The following image represents an example of visualising the afore-mentioned Paris Rail network using the interface, where we can see that the controls mentioned, and how the same styles for the topological and geographic views are making it easier to understand where one node or edge resides within the two views. The next stage is to develop fully-linked views of a network such that selections made in one window are maintained within another. This type of tool can be particularly useful for finding disconnected edges via the topological view, and then finding out where that disconnected edge may exist in it’s true spatial location.

Example of the geographic view of the Paris Rail Network displayed using OpenLayers (data read in from JSON objects, with geometry as WKT)


Example of graph metrics (degree histogram) for Paris Rail Network (data stored at network level)


Example of the topological view of the Paris Rail Network displayed using force directed layouts from D3.js

Open Source, Open Standards 2013 Conference, 18/04/2013, America Square Conference Centre

A member of the Geospatial Engineering team at Newcastle, David Alderson, recently attended a GovNet series conference in London, entitled “Open Source, Open Standards”. This was held at the America Square Conference Centre, and more information about the conference can be found here.

The conference delegates were largely comprised of various government agencies including the Department for Transport, Office of National Statistics, representation from emergency services, Department for Work and Pensions, Department for Education, Department for Environment, Food and Rural Affairs (DEFRA) as well as representation from many local councils from around the UK. From within these various organisations the delegates were largely found to be based within some part of their specific IT operations.

Keeping in mind the public sector background of a significant number of the delegates in attendance at the conference, many of the exhibitors were offering open source solutions to various IT-related challenges including content management, telecommunications, secure mobile offsite collaborative working, data storage amongst others. Some of the major players in the open source world were also exhibiting their products, and post-purchase services including redhat, and MySQL (Oracle), whilst there were also stands from (amongst others):

The conference overall was a fantastic opportunity for public sector employees, to gain further insight in to how open source solutions can offer alternatives to proprietary software, that are often found within government department and agencies as a result of a legacy of long-term IT contracts and vendor lock-in. The general feeling amongst those presenting was that open source offers IT managers, and those involved in the procurement process of IT within the public sector, fantastic competition to the proprietary software providers meaning that the options available are greatly increased and improved. However Tariq Rashid, Open Source Policy Lead, HM Government and a speaker at the conference was keen to stress that open source is not being “favoured” over proprietary solutions, and that both operate on a level playing field. The take home message for delegates seemed to be more related to understanding what open source can offer by dispelling fears and myths about it’s use or misuse, whilst intimating that the choice of open source vs proprietary should be more related to the problem to be solved, and that a mixture could be the best solution. 

A number of keynote presentations were delivered during the conference, and further information can be found at the conference website, including hopefully the presentation slides themselves. Of particular interest to geospatial people was the presentation delivered in the afternoon by Executive Head of Technology at the Met Office, Graham Mallin. He introduced some excellent work that has been undertaken at the Met Office with collaborations from other national meteorological services from France, South Korea and Australia, nearly all put together using open source products including the ever-popular Python products, Numpy, Scipy, Matplotlib, as well as GeoNetwork and PostgreSQL. A Space Weather interface was also briefly demonstrated during Graham’s presentation highlighting how open source is completely capable of handling all types of data and IT-related challenges.

Further information on the OpenWIS project can be found at the Met Office website.

Some other interesting talks were given by Mark Taylor, CEO of Sirius Corporation which operates as the UK’s leading Open Source services provider. Mark gave some interesting examples of how aspects of IT infrastructure within different organisations or government departments with which Sirius has worked with, were swapped or migrated to open source alternatives. The general take home message there seemed to be that caution is sensible and making the right choice for your problem is key, and that finally taking bite-size steps to replacing components is more sensible than wholesale change.

Upon reflection many of the speakers and exhibitors did a great job of promoting the use and exploration of open source alternatives at all levels of spatial and non-spatial software stacks but ultimately that the process of technology selection, deployment and maintenance is not that different to when considering purchasing licensed-based proprietary software.

Some interesting links:

http://scitools.org.uk/iris/docs/latest/index.html – IRIS tool

http://www.slideshare.net/zaiziltd/graham-mallin-head-of-it-infrastructure-at-the-met-office-presentation-at-the-open-gov-summit-2012 – OpenWIS explained by Graham Mallin, Executive Head of Technology, Met Office

GISRUK 2013

A number of the Geospatial Engineering team attended GISRUK 2013 (Geographical Information Science Research UK)  http://liverpool.gisruk.org/ held at the University of Liverpool April 2nd ~ 5th.  Neil Harris presented a poster showing his work on the real-time air quality sensors and the NUIDAP architecture (Ncl Uni Integrated Data Access Platform) for transport and air quality modelling.  Javier Urquizo (Phd student in Architecture with Phil James and Carlos Calderon) presented  a paper his work on spatial urban energy models.

The short talks and lively atmosphere with a mix of young researchers and a digestive base of more mature academics and researchers provided a great platform for seeing the breadth and depth of GI research in the UK.  This year there were some interesting technology observations with R and PostGIS providing the underpinning to many analyses and research.   There were a also some great talks on visualisation (not a subject I normally warm to) including some great visualisations by keynote Jason Dykes (links can be found here: http://www.soi.city.ac.uk/gicentre/t/wordpress/jsndyks/gisruk-2013/).    GISRUK 2014 returns to Glasgow.  For those that remember the last time – bring on the beige food and the ceilidh dancing (or maybe not..).

Nice summary of some of the talks here: http://gogeo.blogs.edina.ac.uk/2013/04/09/gisruk-2013-liverpool/  Thanks to Addy Pope at EDINA.

“Tweet Support Our Local Team” – Crowd sourced football team fan base locations

The location of the football team that you support is often a cause for debate, with chants like “we support our local team” being heard on the terrace week in week out. And now with the influx of football fans taking to twitter to support their teams this provides another way of measuring this metric.

As a group the idea of using twitter to crowd source the location of events is not a new one. Previously we have used it to record flood events across the north east allowing for a real time map to be produced. An idea which will be used heavily in the forthcoming iTURF project (integrating Twitter with Realtime Flood modelling).

So for me to develop a football script it was simply a matter of applying our previously developed scripts to record the locations of tweets related to football teams. For this I used the official hashtag for each team and then simply recorded the club, location and time, the actual body of the tweet is not stored.

Once this script was in place and I had the data feeding into a database I was able to develop a webpage displaying the tweets in real-time.

which is available here


As well as this by using the google maps api I was also able to produce heat maps for each club. Showing the hotspots for the support of each team, predictably some show more spread than others.

Analysing a section of tweets also revealed some interesting statistics the club with the lowest average distance from tweet (uk based only) to their home ground was Fulham and Newcastle who pride themselves in their local support were the second furthest away.

club Average distance in km
Fulham FC

81.64537729

West Ham United FC

82.46339901

West Brom Fc

82.78354779

Wigan Athletic

109.7845034

Tottenham Hotspur

112.3828775

Southampton FC

121.436554

Stoke City

123.7468635

Manchester City

128.4830384

Chelsea

134.4779064

Reading Football Club

141.2626039

Arsenal FC

147.5236349

Aston Villa Football Club

148.2891941

QPR

157.5900255

Swansea

162.7745008

Norwich City

164.774284

Sunderland

172.5479224

Everton

176.5113378

Manchester United

184.157026

Newcastle United

203.0311727

Liverpool

209.1425266


However analysing the proportion of tweets by county about team in their county, it revealed that almost 85% of the recorded football tweets in the Tyne and Wear region were about either Sunderland or Newcastle. Whilst Norfolk, which is said to be a one team county, had only 47% of the recorded tweet mentioning Norwich City.

County Teams Proportion about teams
Tyne and Wear Sunderland & Newcastle

84.54%

Haringey Tottenham Hotspur

74.83%

Manchester Machester United & Manchester City

64.44%

Merseyside Liverpool & Everton

63.86%

Hammersmith and Fulham QPR & Chelsea

62.79%

Southampton Southampton

61.80%

Stoke-on-Trent Stoke

48.25%

Norfolk Norwich

46.99%

West Midlands West Brom & Aston Villa

36.12%

Islington Arsenal

30.00%

Newham West Ham

18.52%

Berkshire Reading

18.35%

Swansea** Swansea

11.11%

Richmond upon Thames Fulham

8.51%


**Note the low proportion for Swansea is suspected to be due to the clash with Stoke City. Whilst Stoke City hashtag is #scfc and Swansea City’s is #swansfc are large number of #scfc are still recorded in south wales.

The hope is for this work whilst relatively simple and rather unscientific it demonstrates what can be achieved by using twitter as a source of information. It also provides a good way of load testing our code and backend database that we will use in the iTURF project


Adaptation Training School – Bilbao

From the 18-22 February 2013 the Adaptation Training School (COST Action TU-0902) was held in Bilbao, Spain. The main objective of the training school was to generate basic knowledge for adaptation management in beginner cities. It also aimed to provide an opportunity to identify key policy needs to overcome difficulties for adaptation implementation at local level, helping scientific agents to scope and align their research with those needs.

Each day was split into to three main sections; firstly a group of presentations in the morning, with secondly a practical exercise in the afternoon (outlined before).

On the Monday sessions were led by Efrén Feliu, and some of his colleagues from Tecnalia in which an overview of the week’s timetable, as well as to an introduction to vulnerability assessment. Tuesday consisted of presentation & a practical exercise from Astrid Westerlind Wigström on the Adaptation Management cycle. In addition Birgit Georgi discussed policies, initiatives, tools and upcoming EU Adaptation Strategy. Wednesday Juergen Kropp introduced uncertainty management and Alistair Ford discussing integrated assessment of urban sustainability, including a practical exercise.  Thursday Johannes Flacke outlined co-benefits and trade- and Peter Bosch provided information and a practical on integrating adaptation in land use and urban planning. Friday’s presentations were: green Infrastructures and ecosystem services role in adaptation measures (Kari Oinonen); regeneration of Bilbao; Urban metabolism and industrial ecology (Rolf Bohne); and Economics of adaptation (Graham Floater).

Finally a discussion focusing on both; the key take home messages from the day’s work, and how the scientific community can aid local authorities in initiating such programs. These discussions had familiar themes, such as: practitioners being unaware of the tools that exist; language differences; a lack of expertise to produce maps, etc., required for decision making purposes; a “gap” between scientists and local authorities.

Various ideas to counter these issues were also discussed, with the idea of knowledge mapping of tools and research seen as an important step to allow for beginner cities to start on the road of climate change adaptation, as well as the age old need for science to be presented in a useful form for those who are to apply it. A further suggestion was to address a funding gap which may exist been when a research project is completed and the dissemination of methods to local authorities. It was proposed that funding applications in the future could be adapted to include the resources to allow academics to spend time with practitioners at the end of a project to increase the likelihood of ideas to be implemented.

The training school, in my opinion, was an initial success as it brought representatives of sixteen European cities together (with four early career researchers) to discuss how cities could begin to adapt to climate change. Although, if it is to be seen as a long term success these cities must assimilate what they have learnt and implement it within planning and policy to allow for adaptation to take place.

Shaun Brown

Libelium Waspmotes (development of weather sensors)

In order to establish a long term urban research facility Newcastle University is looking to bring together new and existing data that includes the urban climate, air quality, pedestrian and traffic flows as well as hydraulic flows. These new data sources will come from a number of sources, one of which will be a system of new sensors set-up around Newcastle. The particular sensors that are going to be used are waspmotes developed by Libelium, sensor devices specially oriented to developers. They work with different protocols (ZigBee, Bluetooth and GPRS) as well as a variety of frequencies (2.4GHz, 868MHz and 900MHz). More than 50 sensors can be connected with these devices with the measurements and frequency configured manually.  The sensors can take a number of readings such as the concentration of different gases, temperature, liquid level, weight, pressure, humidity, luminosity, accelerometer, soil moisture and solar radiation.

Thus, as part of my role as a research assistant on this project I was sent along to a training course learning how to write the code to configure these devices. The training course took place in Zaragoza, Spain at Libelium HQ.

It consisted of 4 days of demonstrations and exercises getting familiar with the equipment and how to use them. These ranged from getting the waspmote to send “hello world” to a gateway (a USB device that receives messages and prints them to the screen) all the way through to sensing nearby Bluetooth devices then sending these to a database. We were also taught “clever” uses of the sensors like using the internal accelerometer to detect whether the device had fallen or was being stolen (attach a GPS and a SIM card and you can get it to text you the thief’s location!).

At the end of the training course we were shown their next generation of sensors; the Plug and Sense. These require very little development work as the devices come already mounted in a box and the user just has to attach the relevant sensor probe and then use the code generator to set the recordings taken and frequency at which they are taken.

Since returning I have started to develop a weather station using a waspmote, an agriculture board and weather sensors such as a rain gauge, an anemometer and a temperature gauge.

My cluttered desk whilst developing the weather station

Despite initial setbacks, like recording monsoon like conditions whilst inside, I was able to get it set up and feeding into a postgres database. From this, I set-up a simple webmap using the database along with django to display the location of the sensor and the data feed.

The first version of web map and data feed

The aim is now to develop more sensors and deploy these in more meaningful places (not everybody just wants to know the temperature in my office) around the University campus and wider city.

Weather proof box which contains the sensors
Weather proof box for the deployment of the sensors

Neil


Alpine Training

At the end of 2012 Dr Stuart Barr and Alistair Ford from the Geospatial Engineering group paid a visit to the University of Innsbruck for a week of discussions, demonstrations and workshops with the ‘Umwelttechnik‘, or the Unit of Environmental Engineering. The group of Professor Wolfgang Rauch specialises in urban water management through novel modelling approaches which link traditional hydraulic modelling with cutting-edge urban, infrastructure and agent-based models. Since the Geospatial Engineering group is interested in environmental sustainability and climate change, the entire journey from Newcastle to Innsbruck was undertaken by train!

Catching up on some reading...

During the week, the researchers from Innsbruck demonstrated their innovative models of water infrastructure development. These link physical simulations of water supply and sewerage systems with future projections of urban growth, allowing assessments of network performance under climate and socio-economic change. Also demonstrated was the ‘ACHILLES‘ approach (link in German) to network failure assessment, ranking each component according to the impact its failure may have on the whole network. The group are based in the Faculty of  Civil Engineering, based on the new technical campus of Innsbruck University. The view from their offices is quite impressive…

A meeting room with a view!

The work of the Newcastle Geospatial Engineering group was also presented to demonstrate alternative techniques for urban development modelling being developed here. Fruitful discussions followed, leading to possible collaboration and crossover activities. The opportunity was also taken to learn about new computing and processing techniques being developed in the Innsbruck group (using GPU processing for hydraulic simulations) and to discuss contrasting open source modelling frameworks being developed by both groups.

After five days of excellent discussions and collaboration, the Newcastle delegation took some time on the Saturday to see the other sights that Innsbruck had to offer before catching the sleeper train back home.

Dr Barr scales the peak (this time on the cable car instead of on foot!)

Unfortunately the snow wasn’t quite deep enough for any alpine sports, although I wouldn’t want to try this one anyway:

The view down the Bergisel ski jump, used in the 1976 Winter Olympics. Scary...

Thanks to Wolfgang and his group at Innsbruck for being such excellent hosts, and look out for news of future collaborations between the two groups.

The End

Ali

Updating Geometry Columns for views in PostGIS

The recent upgrade to PostGIS has caused some issues with geometry types when creating views from geometry that don’t use the new typemod geometry modifiers.  The following workaround correctly inserts an entry into the geometry_columns view so you can see your data in QGIS and the like:

DROP VIEW myview;

CREATE OR REPLACE VIEW myview AS (

SELECT field1, field2, field3,

St_Transform(the_geom, 27700)::geometry(Point, 27700) as the_geom

FROM mytable

);

Change the geometry type and CRS as required.