Identifying the pattern trends of temperature in a city of a difficult and challenging subject, though through the use of Advanced Very High Resolution Radiometer (AVHRR), our researchers have shown the extent of the variability across a major city can be tremendous. Using data for London, it has been shown that there is a high degree of sensitivity to local meteorological effects and daily cycles.
Comparison of the Urban Heat Island Intensity (UHII) [the maximum difference between urban and rural temperatures during one day] in a statistically robust manner showed that the 2003 heatwave UHII data sets for both image surface and ground air temperatures did not exhibit significantly greater intensities than the other years under consideration. This is in contrast to other work on this topic (e.g. Cheval et al., 2009; Tomlinson et al., 2010) that indicates that not only is the UHII metric a relatively poor means by which to distinguish between a heatwave summer in London, but also the need for further scrutiny of the use of the UHII.
We are pleased to announce the establishment of Open Source Geospatial Research and Education Laboratory at the University of Newcastle, United Kingdom. The laboratory is one of the members of a worldwide network developed under the auspices of the ICA-OSGeo Memorandum of Understanding (MoU).
In 2011, the International Cartographic Association (ICA) signed a Memorandum of Understanding (MoU) with the Open Source Geospatial Foundation (OSGeo) with a view to develop global collaboration opportunities for academia, industry and government organisations in the field of open source GIS software and data. The MoU aims to provide expertise and support for the establishment of Open Source Geospatial Laboratories and Research Centres across the world to support the development of open source geospatial software technologies, training and expertise.
Newcastle University is one of the leading geospatial research group in the UK and have very strong research and teaching expertise and well developed CPD programs etc. The Open Source Geospatial Research and Education Laboratory is run by the Geospatial Engineering Research Group but draws heavily on interactions with other research groups and partners within the University, nationally and internationally. The Geospatial Engineering Group supports the development and training of Open Source Geospatial technologies by utilising these technologies to carry out fundamental research and to deliver geospatial solutions to engineering problems. They also provide training both as part of thier Undergraduate degree programmes in Surveying and Mapping Science, Geographic Information Science and Physical Geography as well as through short training courses.
Open Source Geospatial Research and Education Lab at Newcastle University is led by Dr Philip James. Key members of the lab are Dr Stuart Barr,Dr David Fairbairn,Dr Rachel Gaulton,David Alderson,Alistair Ford ,Dr Pauline Miller and Neil Harris.
Over the last 6 months, we have a rapidly expanding network of Open Geospatial Labs and we are now in the process of setting up Open Geospatial Lab Network node site within OSGeo website so that all participating labs urls can be added to this.
We are actively working in expanding this ICA-OSGeo initiative (http://www.osgeo.org/node/1230) globally in our aim to bring the benefits of geospatial technology to all.
We especially welcome applications from universities, educational institutes, government organisations in developing countries to develop capacity building in geospatial education by establishing Open Source Geo Labs. Details of how to apply for OSGeo Lab is at http://wiki.osgeo.org/wiki/Edu_current_initiatives
We wish you all the best for the Holiday Season and the New Year.
Best Wishes,
Dr Suchith Anand
Nottingham Geospatial Institute
Nottingham Geospatial Building
University of Nottingham NG7 2 TU
Tel: (0)115 82 32750
Last week I attended a training course in Cambridge on Image Exploitation using SOCET GXP. The photogrammetric software, developed by BAE Systems, is the latest release and the successor of the SOCET SET software. As this is going to be the intended software I will be using for my 3D modelling of buildings, and with nobody in the Geospatial Engineering department having any experience with SOCET GXP (SOCET SET is currently installed on the computers), I was chosen as a representative from the University. The majority of the attendees had military backgrounds, two from the Swiss and two from the American military. There was a few from industry, including two from a 3D modelling company in London.
The four day course started with a basic introduction to the software and getting to know our way around the windows. SOCET GXP has made several alterations to SOCET SET, most significantly the interface. GXP has two main windows, the Workspace Manager and Multiports. The Workspace Manager is where all the data is managed, and the Multiport is where the data is displayed. Data is loaded from the Workspace Manager into Multiports. Previously, SOCET SET could only load two images at a time. Now with GXP, four images can be loaded, either as a singular view with the imagery in layers, similar to that of ArcGIS, or in a tiled panel. GXP has also adopted the ribbon menu approach, similar to that seen in Microsoft Word, which makes it much easier to find things compared to SET. After drawing and editing the image, various formats can be used as outputs, for example a screenshot can be exported straight into PowerPoint, shapefiles can be created in a geodatabase, and GeoPDFs can be produced.
After the first two days of familiarisation with the software, the final two days looked at the capability of data extraction, in both 2D and 3D using stereo. Tools in the toolbox are segmented into different types depending on their functionality; draw tools, mode tools (which describe how the draw tool operates) and modifier tools. Cue Cards help explain how to use the tool, making them very straightforward to use. One of the main tools in the software which may prove worthwhile in my project is the Automatic Feature Extraction tool, which can depict building outlines and trees based on a set of parameters. Having only used this tool on lidar data, it will be interesting to see what results it yields for aerial imagery. For 3D extraction, several models exist in GXP, such as planar roofs and gabled roofs. These can usually be utilised by defining a ground point and the rooftop points. Although this is an easy option for modelling, it cannot be incorporated into my work-flow due to its heavy reliant on manual interpretation of ground and roof points. The accuracy of the building is therefore dependent on the analyst.
As well as learning about the software a vast amount of ‘networking’ was undertaken over the four days.
The course has given me an insight into the new and existing capabilities of SOCET GXP and how it can potentially be utilised in my research project.
Two members of the Geospatial Engineering team (David Alderson and Craig Robson) were due to present their current infrastructure/network-related research at the recent ITRC Early Career Researcher’s conference, held at Cambridge University on November 27th 2012. As such both embarked on a journey, departing from Newcastle at 0556 on the morning of the 27th, that would end having only reached as far South as Darlington…approximately 6 hours after departing! The cause of being only able to travel a few miles in that time…a flood-related failure of the rail network leading to a loss of power to the train and line between Durham and Darlington. A set of images taken on the day of the failure illustrate the researcher’s plight.
On a snow-covered evening, transport planners, policy makers and those generally interested in transport-related data, made their way to the School of Civil Engineering and Geosciences’ Cassie Building, for a Transport Planning Society organised event; Applying GIS and Open Data in Transport. The promise of tea, coffee, and the odd mince pie drew those in from the cold…only to discover that caterers had fallen foul of the snow and icey conditions, leaving the audience with little other sustenance than having to digest the two presentations delivered during the evening.
Initially we heard from CESER researcher Alistair Ford on the work he and colleagues in the School have been doing, looking at climate change mitigation and adaptation within an urban context. This work was conducted as part of the Geospatial Engineering team’s involvement in the Tyndall Cities programme, and the ARCADIA projects. The delivered presentation can be found here and here (click both links to retrieve all slides, the first link is just slides 1-20, and the second 20-37).
The audience then heard from Graham Grant from the Tyne and Wear Integrated Transport Authority (TWITA). Graham discussed the possibility of some UTMC-compliant data streams being “opened” to developers, potentially allowing access to approximately 5 pre-approved data streams, with some real-time data included. There are approximately 20-25 datasets that could be made open to developers, and so Graham (contactable at Graham.Grant@newcastle.gov.uk) and colleagues will be looking for developers to prioritise that list, and help select data of most interest to them.
Thanks to Laura Hanson (CEG), and Nicola Hill (Senior Transport Planner, ARUP) for organising the event. Find out about more Transport Planning Society events here.
On the 26th October, as part of the monthly Geospatial Engineering meeting, I presented an update on some of my research thus far, since beginning my PhD last September. The presentation focused on some of the more recent research I have been doing, associated with identifying a hierarchical structure in networks. Below is a summary of the work and a note on future presentations.
It is acknowledged in infrastructure literature that some infrastructures have a hierarchical structure, different from the traditional theoretic network structures. These include common models like the random model, scale-free and small-world structures. The main difference between graph structures is the distribution of node degree, the proportion of nodes which are connected to a certain number of edges. A hierarchical structure (looks like a tree) would be expected to have some sort extra organization in it, leading to an underlying hierarchical structure, such as a tree. If it can be shown that this is true and hierarchical networks can be identified, it may be shown that the structure of these are significant and thus may allow for the improvement of the resilience of such networks.
The research utilised the networkx python library, a complex network package. This allowed for the creation of the common network structures mentioned earlier, as well as for the analysis of these through an extensive collection of analysis algorithms. To create a better representation of hierarchical networks, two in-house algorithms were developed to soften he transition between random networks and the balanced tree network, an explicit hierarchical network.
The first set of analysis was performed using common graph metrics such as degree (the number of edges connected to a node) and the average shortest path across a network. A suite of graphs were created for this analysis which covered a range of sizes and complexities for all graph types. This led to the identification of a pair of metrics, which in combination, allowed hierarchical networks to be separated from the other graph structures in the analysis. (The metrics which were identified are the assortativity coefficient and the max betweenness centrality value).
The accuracy of this was confirmed through a series of statistical test, for all pair wise combinations, including chi-squared tests as well as transformed divergence tests to compare the distribution patterns of the metrics of all graph types. In the majority of cases it was shown that the distributions for the graph types did not match in many cases, and there was a significant difference between the rest and the hierarchical structures.
This shows that there is a significant difference between the structure types and thus further investigation into the significance of this, as planned, is worth while completing as there could be future implications on the resilience and design of infrastructure networks. This work will involve resilience analysis of the range of network structures so the results can be compared and the significance quantified. In the longer term this work will be applied onto real-world networks.
A similar presentation with recently completed work will be presented at the ITRC Early Career Researchers Conference at the end of November.
The second ITRC Stakeholder Workshop was held at The Royal Statistical Society, on November 6th 2012. The workshop presented an opportunity for project partners, stakeholders and the Expert Advisory Group of the ITRC project to hear about progress on the main work packages from a wide range of researchers and investigators, and again offer their opinions and feedback as to what aspects of the programme they would like to know more about, or become further engaged with.
Those attending the workshop, included representation from industry, government and academia who participate in infrastructure provision, maintenance, delivery and research, including:
Government / Pseudo-government
Research / Academia
Infrastructure / Utility Providers
Engineering Consultancies
Local Government
Other
Committee on Climate Change
University of Illinois at Urbana-Chamaigne
BP International
Atkins
Hampshire County Council
Institution of Civil Engineers
Department of Energy and Climate Change
ECI, University of Oxford
United Utilities
Black & Veatch
CIRIA
Department for Transport
University of Cambridge
Northumbrian Water Ltd
JBA Trust
Highways Agency
Imperial College London
Thames Water
John Dora Consulting Limited
Climate UK
University of Southampton
National Grid
Bam Nuttall Ltd
Environment Agency
University of Oxford
COSTAIN Group
DEFRA
University of Leeds
Parsons Brickerhoff
HM Treasury
University of Newcastle
AECOM
EPSRC
University of Exeter
CH2M HILL
National Soil Resources Institute, Cranfield University
MWH
Sandia National Laboratories
University of Birmingham
TU Delft, Netherlands
University College London
Judges School, Cambridge
University of Wollongong, Australia
University of Sussex
UKCIP, University of Oxford
During the workshop, presentations were delivered by various members of ITRC, including the following:
– ITRC Infrastructure Strategies (WS1): Alex Lorenz (Oxford University)
– Process for conducting the next cycle of ITRC assessment (WS5): Robert Nicholls (Southampton University)
– Infrastructure Risk Analysis and the ITRC Infrastructure Database (WS2, WS4): Raghav Pant (Oxford University), Stuart Barr (Newcastle University)
One of key aims of the workshop was to help guide aspects of WS1, and consult stakeholders about reviewing and identifying infrastructure options and begin to build cross-sector strategies. This process was coordinated by Alex Lorenz (WS1 Researcher) and Roger Street (ITRC Stakeholder Champion), and required stakeholders to review the proposed infrastructure options from ITRC within each infrastructure sector (energy, water / waste, transport) for their completeness and priority for evaluation. The options proposed within each sector represent a change or alternative to the current status, possibly in terms of structural change, or influencing supply and/or demand. For example, consideration of the electrification of transport could be considered an option within the energy sector. Furthermore, this led to consideration of cross-sector strategies whereby options from different sectors can be considered together e.g. energy-transport options, or energy-water options for example.
The workshop also presented an opportunity to showcase the custom network database schema developed within Geospatial Engineering @ Newcastle, and the Python linking architecture coupled to that. This system is being used to build national and regional-scale infrastructure network models to then subsequently form part of the infrastructure risk analysis being carried out in WS2. If you would like to read more about this, please see a previous post here.
Further to the afore-mentioned, ITRC-specific presentations, the audience also heard from two external speakers, who delivered keynote addresses on complex adaptive system modelling, and future finance options for infrastructure provision:
– Complex Adaptive Systems modelling to inform policy decisions: Theresa Brown (Sandia National Laboratory)
– New business models for national infrastructure provision: Simon Taylor (University of Cambridge)
Stakeholder workshops such as this, provide project partners with a direct opportunity to get involved in the various aspects of the consortium, and help to continue the consortium’s success to date with stakeholder engagement and co-production, a key deliverable and consideration of WS5. This process will continue with the next cycle of assessment as part of WS5.
I have spent the last 10 years organising, analysing and presenting spatial data in a variety of projects. My research has led me into the dark corners of transport modelling, climate statistics, energy modelling and a whole host of other fields. Spatial data underpins all these disparate activities (and we also make cool maps and use cool tech). However, I am increasingly frustrated by the effort that goes into finding and looking for spatial data. In the UK we are sort of OK as far as it goes as we have the Ordnance Survey and a few commercial and academic portals that provide (at a price) one stop shopping for most things. I suspect the situation is similar in most first world nations but that certainly is not the case in many other places.
I have now sat through a number of presentations on INSPIRE, have looked through geoportals both open and closed, battled with OGC metadata specs, geoserver config and openlayers and come to the realisation that we should just let Google do it. Think about it, they have the financial clout, the technical clout and they are probably (definitely in my case) smarter than us anyway. I envisage a Google geometry search so that I type a place name and I find spatial data stored as a file of geometry (raster or vector) as the result.
Ah, but will it be the right one – well surely this is just another good use for Page Rank? Is it not the case that more likely than not in the UK we will use an Ordance Survey Opendata admin boundary. Surely their metrics will show this? I mostly want the best information for the job and this could give it, quickly, easily and cleanly. Page rank for spatial can do what ISO 19115 will never do and provide a filter of perceived utility.
Ah, but “spatial data is more complex”. Is it really? What is complex about it that big compute and big tech cannot sort? Take projections – why can’t we just reproject our data a la Google translate (easier as it is just maths not language). What about layers of geometries that interact spatially – well this is resolved using a spatial index in a database – I suspect having a massive spatial index of all the objects in the world would not be a stretch for a company whose starting point is an Index. And format conversion – that is just compute – shouldn’t be an issue (or perhaps just index and cache call the converted versions for everything). Linking spatial data to a rich keyword based and natural language processing means we should be able to find things – alternative geographical names fall out of the system (and as a not insignificant byproduct the number of neogeography talks may dwindle).
Imagine a world where I want data on Nigeria Rivers and I type into Google Geometry such a query term – the result, peer reviewed by the vast caucus of humanity (or those special ones interested in spatial anyway) is a link to a file that I can visualise online, download and add value to or combine in a web based “mash up”. One suspects our tools would be simplified as well when data is easy to find, view and retrieve.
We can then ditch the metadataverse and multiple WMS/WFS endpoints and catalogue services that make up the current crop of portals and the INSPIRE vision and do what we do best – use spatial to help understand the world and make better decisions. If this is the way that users expect spatial data then there is incentive to put your data out there (and let Google find it and index it). There’ll need the spatial index anyway to do sensors properly (but that’s another story).
GeoAnorak. Changing the world one vertex at a time.
The 4th Annual Open Source GIS Conference, held at the University of Nottingham on September 5th this year was attended by four members of the Geospatial Engineering team at Newcastle; David Alderson, Tomas Holderness, Alistair Ford and Craig Robson. The conference offered an opportunity for those working in academia, government and the private sector to listen to some of the latest technological and research developments focussed around open source GIS.
During the conference, David Alderson, Research Associate in GeoInformatics delivered a presentation focussed around the network modelling framework being developed at Newcastle University, entitled “An open source relational database schema and system for the analysis of large scale spatially-interdependent infrastructure networks”. The framework links the network analysis Python package, networkx, with a PostGIS database, allowing a user to take raw point and line data, and convert them in to topological and spatial networks. Additionally the framework, and database schema, enable the interdependencies between different networks to be represented and stored. The modelling of interdependencies between different infrastructure networks e.g. between gas and electricity, or water and electricity, will help to understand how infrastructure networks are dependent on resources supplied from a different network. This work has been a collaborative undertaking between researchers, and PhD students within the Geospatial Engineering team at Newcastle.
The slides delivered at the presentation are here.
The conference also offered an opportunity for the team to attend a workshop on the open source software “GeoNetwork”, with a view to potentially utilising this as an alternate front-end to the Geomatics Data Server (GDS) developed at Newcastle University. The GDS was developed to act as a metadata server, and data repository for data held by colleagues working within the School of Civil Engineering and Geosciences. The system allows users to add and search metadata records, stored within a PostGIS database. Currently the system is used by researchers, 3rd year undergraduate project and PhD students, to help assist them in finding data for their research. The GeoNetwork workshop gave the GDS developers some basic knowledge of the capabilities of the software, and some more detailed tutorials and materials to help further explore whether the software will be suitable for the GDS.
As part of Geospatial Engineering’s on going involvement in the Infrastructure Transitions Research Consortium (ITRC – www.itrc.org.uk), various network models of infrastructure networks have been developed. This has involved the development of a custom database schema within PostGIS to handle networks created within the Python package, networkx. The linkage architecture has been provided by a custom built set of Python modules allowing raw line and point data within PostGIS to be fed into networkx.
Each network is represented within PostGIS as a series of three tables; a table representing nodes, a table representing the edges within a network and their attributes, and finally a table representing the geometry of the edges. A series of node, edge and edge geometry parent tables within the custom database schema are inherited from when a specific network instance is written to the database. The inheritance from these parent tables ensures a minimum set of columns are transferred to each instance table for each network, with a series of foreign key constraints applied to enforce referential integrity within the database. These foreign key constraints for example, ensure that an edge can only exist within a network provided that the nodes at either end of that edge also exist.
The attributes of each edge created are transferred from the attributes supplied within the raw line data. If no point data is supplied to the network build functions, then nodes are created at the end of each linestring, with blank attribute values. Alternatively if a set of points are supplied, then these attributes are copied through to the node table. Each node and edges created within networkx are written to each table individually, where checks are made against each node and edge table to check if a node or edge with the same geometry has already been created. This check is performed using the ST_Equals function available within PostGIS.
To enhance performance of the Python network writing module that is used to write networkx network instances to PostGIS, a version of the writing functions has been created exploiting the PostgreSQL COPY function. Prior to writing the data to the PostGIS database each node, edge and edge geometry table is created as a CSV file, with the COPY function used to bulk write the data to the database. Furthermore, this second approach to writing the networks to the database does not require multiple read/writes to check if a node or edge already exists i.e. stored, as this is handled within memory.
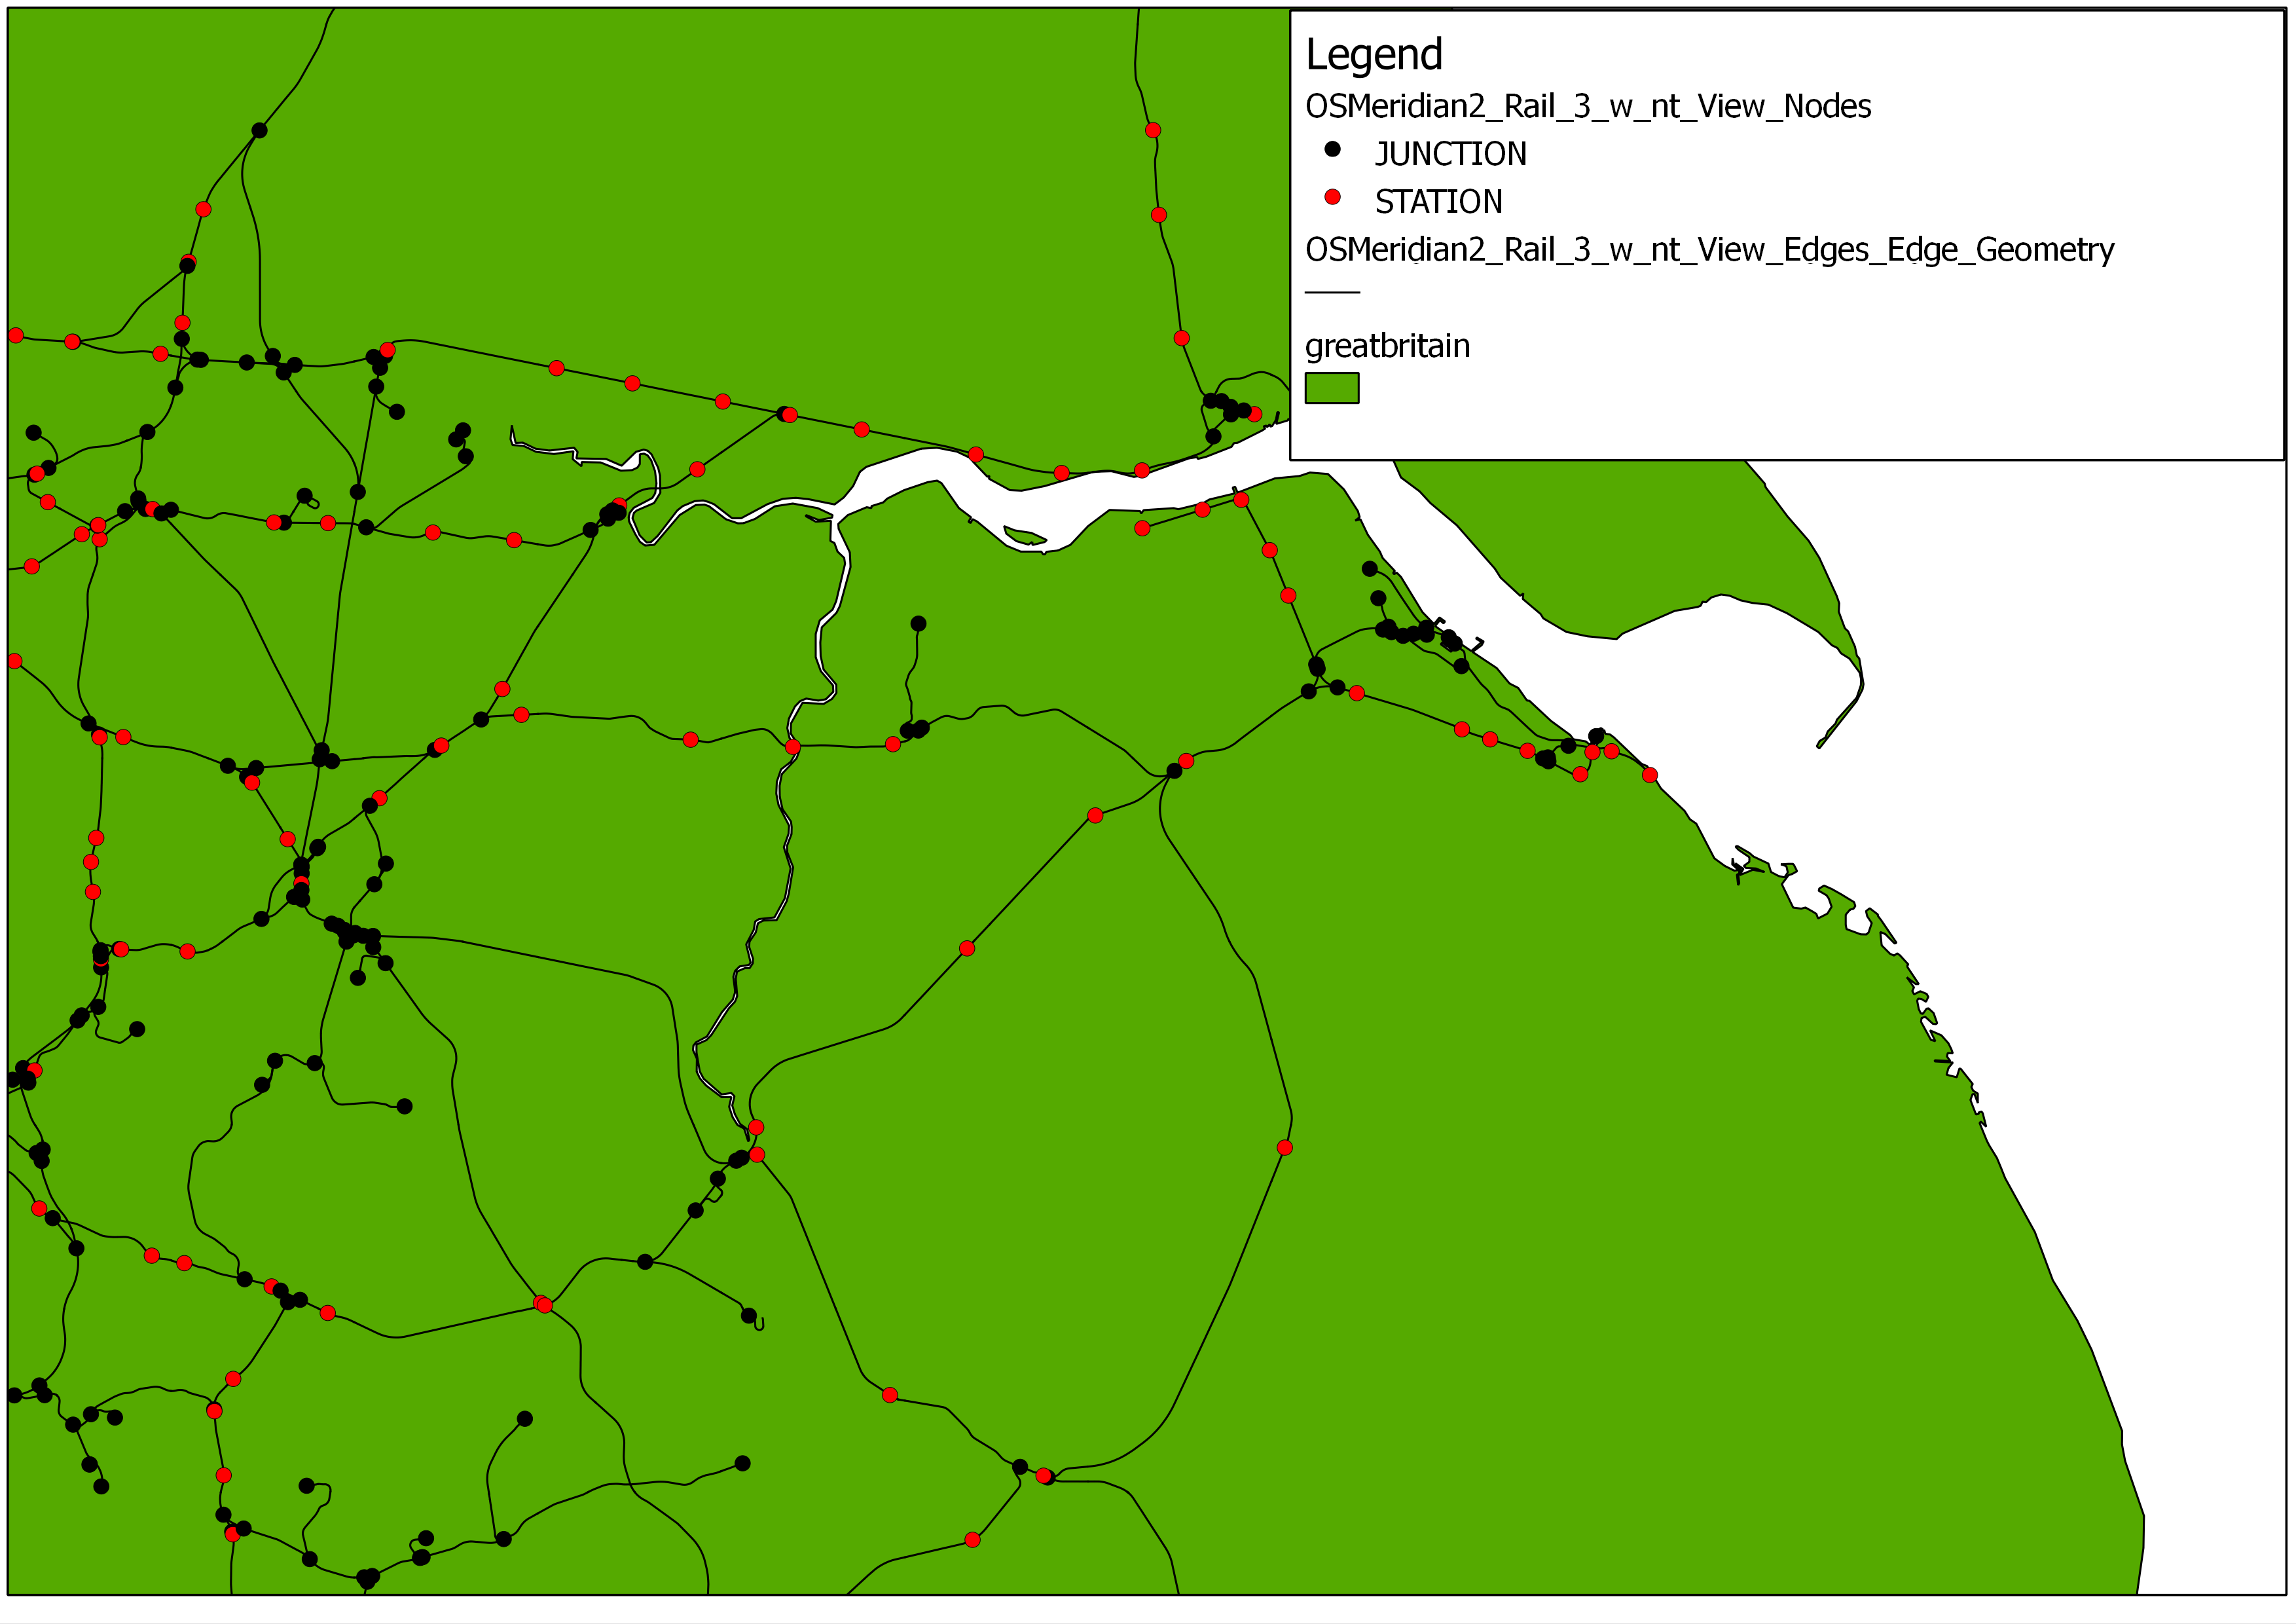
The Ordnance Survey Meridian 2 Rail data has created as a spatial and topological network within the database schema, using the Python linking architecture between PostGIS and networkx. Initially a table of rail ‘junctions’ was created offline by calculating the number of intersecting lines at each vertex within the raw data. This data table was used as the point input table, whereby a “type” attribute for each node with a value of ‘junction’ was defined.
Utilising the writing functions whereby a network edge and node is written individually to the database for each within the network, the network was built from the raw data, and then written to the PostGIS database within 5 minutes. This network contained:
7995 nodes (1416 JUNCTIONS)
8484 edges
The image below shows a portion of the Meridian 2 Rail network as discussed above:
Ordnance Survey Meridian 2 Rail Network
Utilising the CSV writing functions whereby a CSV version of the Meridian Nodes, Meridian Edges and Meridian Edge Geometry are created prior to bulk writing these to the database, reduced the network build and write time, for the same number of nodes and edges as discussed previously, from approximately 5 minutes to less than 30 seconds. Furthermore the CSV representation of the Meridian Rail network, based on the level of attribution available from the raw data plus the newly-defined “type” attribute to store the ‘junction’ value, are only 5Mb in size, making this easy to share with others.
Further comparison of the two approaches to writing the network data to PostGIS, utilising the Ordnance Survey Meridian 2 Road (A, B, Motorway) data shows a similar improvement in writing performance if the PostgreSQL CSV COPY approach is used. For an area in North West England (covering approximately 22,000km2), containing a total of 291759 raw input points (taken from the road_node and rndabout for A, B, and Motorways only), and 46836 input lines (combining A, B and Motorways for the chosen North West region), it was possible to reduce the network build and write time from approximately 61 minutes to 17 minutes 25 seconds.
The image below shows a portion of the Meridian Road Network (A, B, Motorway) for the North West of England
Ordnance Survey Meridian 2 Road Network (A, B, Motorway)