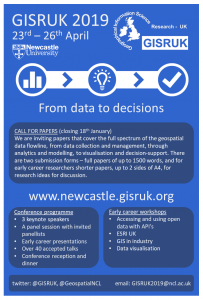
GISRUK 2019 – registration open!

In what is the week of #gisday we can now announce that that registration for GISRUK 2019 is now open – see our website for prices and a link to register! (Prices start from £150). And we have announcements lined up for later in the week too!

Alongside registration we have also opened up the application process for our early career scholarships which we are offering to eligible candidates. To be qualify you must be a lead author on a submission, be a student (masters or PhD) or an early career researcher (with less than 3 years experience). For more details, and to apply, see our website.

If you missed our call for papers, announced on the 9th October, there is still plenty time to get your submissions in with the deadline being the 18th January. We have already had a few submissions, so if you want more information, there is details about this years call on our website. (We also have a flyer if you want to help spread the word A5 or A4).

More details about our keynotes will be announced very shortly – the first hopefully this week!

Some useful links

Submission page – https://easychair.org/conferences/?conf=gisruk2019

Template downloads – Full templateShort template

Registration link – click here

Attending the Esri UC as a First Year PhD Student

In April, I submitted a Story Map to Esri UK titled ‘Geovisualising Environmental Impact Assessments’; this explored the work I completed in my undergraduate dissertation and how this led on to my current PhD work. When I received the call that I was successful I felt a whole series of different emotions – excited, nervous, motivated, and overwhelmed. But, nevertheless unbelievably eager to be one of the 16,000 attendees at the 2018 Esri User Conference in San Diego. I am going to tell you my top five moments I had whilst attending the UC.

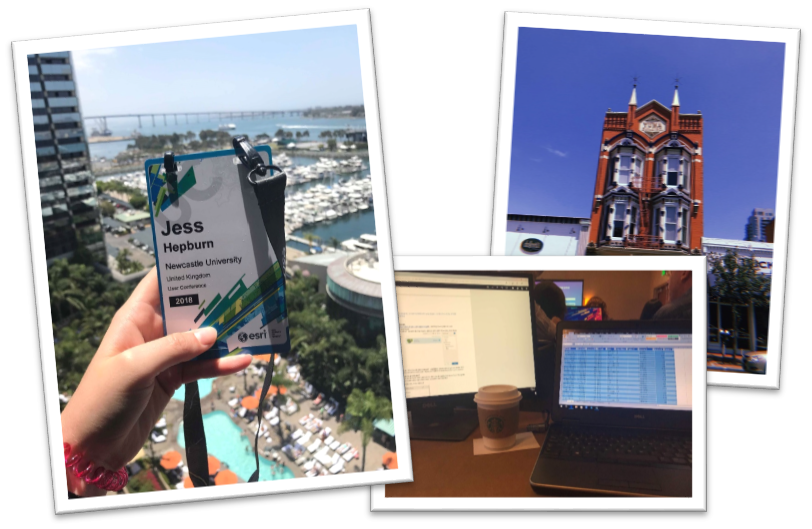
Once I arrived in San Diego and had settled down by gaining my bearings and stocking up on some snacks, the Education Summit began. I collected my badge and started to make my way over to the hotel. The first stand out moment for me were the workshops held at the Education Summit. These either 30 or 60 minute sessions gave me an understanding into areas of the programs that I hadn’t considered. Which included Insights for ArcGIS, transferring data from ArcGIS Pro to Online and creating dashboards using data from Survey123. The information from these sessions was invaluable as it allowed me to fully understand how the Esri platform would be able to help support my current PhD research work as well as engage with stakeholders and the general public. The Education Summit was also a great opportunity to speak to the fellow recipients of the Jack Dangermond Young Scholar Award as well as academics and students from around the world.

Sign up, Education Summit and looking around San Diego

After a busy couple of days at the Education Summit it was then time for the main event… THE ESRI UC, with over 1000 sessions, 450 hours of GIS training & 300 exhibitors! But, before all of that started was my second stand out moment; The Plenary, led by the President of Esri, Jack Dangermond. This was an experience I will never forget, the hall was massive, full of screens covered in maps and GIS-users from across the globe. This session lasted all day and it really captivated me, making me realise how much of an impact my work can have and how applicable GIS is across the world in nearly every discipline. Some of the guest speakers were really inspiring; including Felix Finkbeiner who set up at the age of 9 initiated Plant-For-The-Planet in 2007. His aim is for children to plant 1 billion trees to offset their own carbon emissions. He had harnessed the power of GIS to make an incredible difference, contributing to saving our planet.

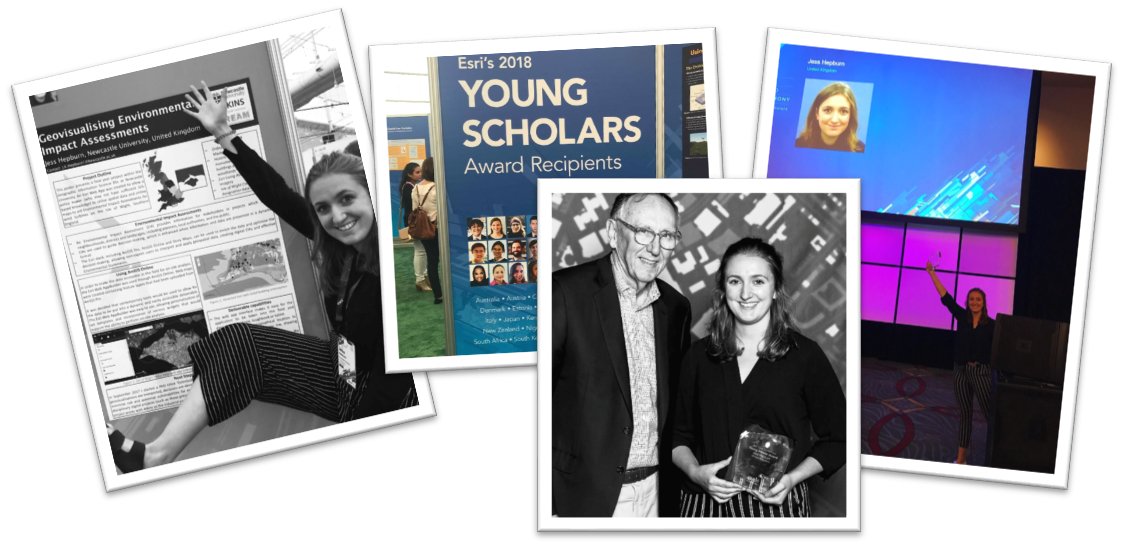
The Plenary was followed by the Map Gallery, which was the third stand out moment in my time at the UC. This provided an opportunity for me to show the poster I submitted along side the other Young Scholars, interact with other attendees to discuss my work and look at 100’s of stunning maps submitted to the Map Gallery. This was a fantastic networking opportunity, I spoke to people from all over the world about my work (and gaining some great connections on LinkedIn). As well as chatting about the GIS education I received at Newcastle University and my PhD program through the DREAM CDT.

Map gallery as a Young Scholar and receiving my award from Jack Dangermond

Throughout the week I attended a vast number of sessions. Using the app, I was able to jam-pack my days from 8:30am – 5:30pm with a variety of sessions, discovering the expo and learning new skills through the digital workshops. This gave me an insight into the abilities on the Esri platforms as well as the capabilities and applications across a number of different sectors from exhibitors from across the globe. My fourth stand out moment was attending the Cartography sessions which reaffirmed my current knowledge and opened my mind up to exploring more of ArcGIS Pro. It introduced me to the MOOCs which are free from Esri to help improve and engage key cartography skills – I’ve signed up for two to complete over this academic year.

Social events, including the Young Professionals Network and Balboa Park Party

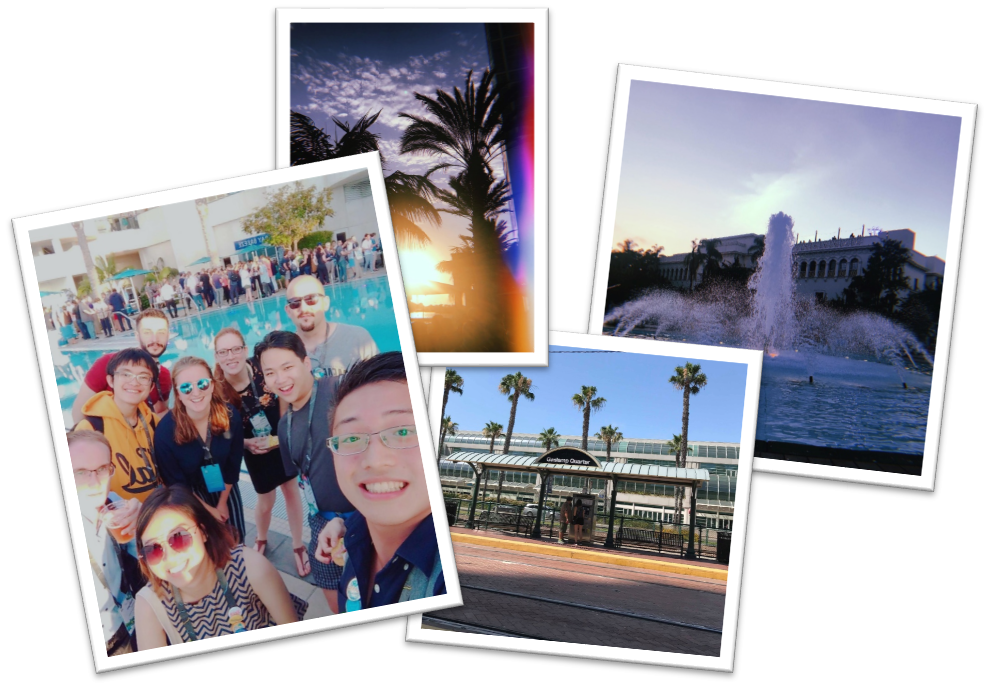
As well as all the fantastic academic and informative opportunities, there were some great social events that were my fifth stand out moment. The Young Professionals Network (YPN) allowed for interaction with young GIS professionals from around the world. It was interesting to meet a wide variety of people in a fun and fresh environment. There was great upbeat music, food and company! On the Thursday night, a party was held at Balboa Park; which was massive. The park contains a variety of museums, all open for free – with music, drinks and food from different areas of the world. It was great to explore with the fellow young scholars, with a good dance at the main stage – ending the week perfectly. Overall, I had a once in a lifetime experience in San Diego at the Esri UC, it opened my eyes to so many new possibilities and demonstrated how highly GIS is regarded across the world. I would like to thank Esri UK for this fantastic opportunity and would recommend anyone to apply!

Link to the Esri Education Newsletter, giving details of next years competition:

https://esriukeducation.maps.arcgis.com/apps/Cascade/index.html?appid=70c638cc32ca48218961a63db42ea4e

Link to the winning StoryMap:

https://ncluni.maps.arcgis.com/apps/MapJournal/index.html?appid=138ac18950bd4c9db3e8501f95701fb9


GISRUK 2019

For those who were not present at GISRUK 2018 this year in Leicester we are delighted to announce that we are hosting GISRUK (GIS Research UK) in April 2019! And for those that were at Leicester, what follows is a reminder about some of the key details.

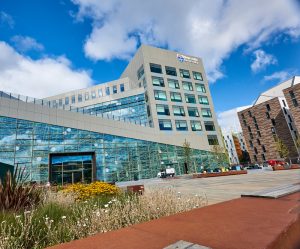
The conference will be between 23 – 26th April, and will be hosted in the new Urban Sciences Building, one of the most (if not the most) sensored buildings in the UK. The conference theme has already been decided, and will be ‘From Data to Decisions’. More details about this, the programme, abstract submission process and registration will be announced in September.

We have also been busy organising the social events, from the conference reception to the conference dinner, and again we will announce more details about these soon.

Our website will be going live in September, but in the mean time please follow @GISRUK on twitter for the latest announcements, follow #GISRUK2019 or follow us at @GeospatialNCL. To get in contact with any queries email us at GISRUK2019@newcastle.ac.uk or contact us on twitter.

We look forward to hopefully seeing many of you hear next year!

Your GISRUK 2019 conference committee.

PS. Our website is now live – www.newcastle.gisruk.org

Urban Sciences Building, Newcastle University
GISRUK 2019 Conference Venue, Urban Sciences Building, Newcastle University

NECSI 2016 summer school course

Between June, 10th and 18th, 2016, I travelled to Boston in USA, for attending the NECSI (New England Complex Science Institute) 2016 summer school course, which was about general theory and models of complex science. The course was held in MIT tang center, where there was roughly thirty attendies from diverse backgrounds (economics, neurosciences, physics, biology, civil engineering, etc.). Besides those from USA, many of us came from different continents (New Zealand, Malaysia, UK, Japan, etc.), so it was rather cool to meet Francesco Castellani from same university of mine! Francesco was a very interesting Italian PhD student, who was studying urban infrastructure vulnerability and resilience against external hazards.

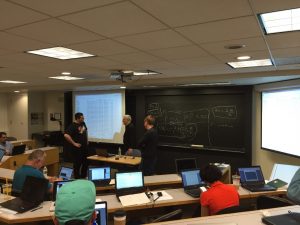
The main course lasted for four days, and was chaired by Assistant Professor Hiroki Sayama, Professor Dan Braha (Fig 1). We were introduced to the basic concepts in complex systems and some specific and most commonly used models for dealing with them, such as cellular automata, networks and agent based models.

Fig 1. Professor Dan Bara and students were discussing about network metrics.

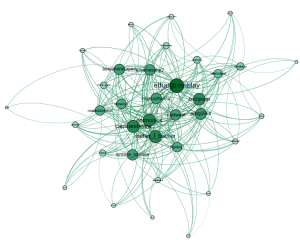
Then Joseph Norman and Alfredo Morales joined them to show us some real life case studies (data mining and machine learning) using such models. One interesting moment during the course was about the social network analysis. Alfredo demonstrated how to listen to social media, such as twitter and to extract the user information to construct a social network in Python. All attendies were asked to register a twitter account and to tweet for any information he/she wanted using a hashtag. In the end, we got a cool social network (tweeting network) which was ready for visualization and network-related analysis (Fig 2).

Fig 2. Tweeting social network from attendances, visualization in Gephi. Each node is a registered user and edges are based on tweets where other users are mentioned.

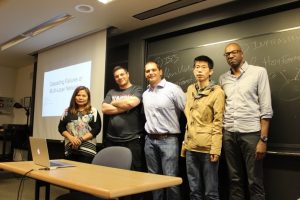
During the course, we were also required to form teams to do a project using the tools and techniques we had learned. I teamed with Cristi, Francesco, Alex and John (Fig 3) to finish an interesting project about interdependent urban infrastructure networks and the cascading failures from them to economic sectors. Francesco and I were in the urban infrastructure network research field, while Cristi, Alex and John were economic data users in their daily work. That’s why we had the idea for this project. We used a very simple model of interdependent infrastructure networks (power, water supply and telecom) and simulated different failure scenarios to model the cascading failure and its impact on the economic sectors using some economic models.

Fig 3. Cool team members, from left to right: Cristi (Malaysia), Francesco, Alex (USA), me, John (Canada).

The course was short but intensive, and it was interesting to learn and team up with people from different backgrounds and with different experiences. I wish all the best for my team members in the future work and it was a pleasure to meet them.

Besides academic work

The course started on Monday, June 13th, while I arrived at Boston on Friday, June 10th, which means I was to lucky to have two free days for some adventures and sight-seeing in the city before the course!

One thing I would never forget was the extremely pleasant weather in Boston. Being at almost the same latitude of Spain created warm and sunny days during my stay there. Since it is at coastal area, there was always breeze, which is really nice in the summer. The city was highly connected by its underground train system, which made my travelling plan even easier. And let’s start!

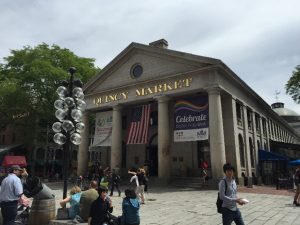
Quincy market is always the most welcome place for the first time travelers. It is a Roman style architectures (Fig 4) where there are lots of stores for fancy food and souvenirs. You can always find a place to have meals of tasty lobsters at a decent price!

Fig 4. Quincy Market, in the center of Boston.

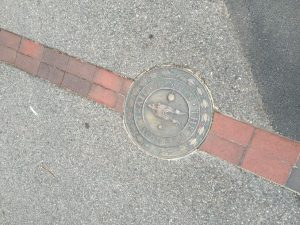
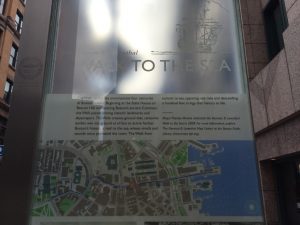
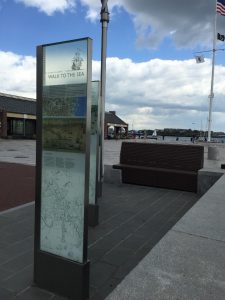
Another thing that makes Boston a little different from other US cities is its colonial history. This was the place where the British adventurers landed in the American continent, which was why this region was called “New England”. There is a very special road in the city, which is call “Trial of freedom”, it is a long route (around 5km) made of red bricks on the road (Fig 5). This trail of freedom leads to the coast, and following this road, you will see many historical architectures, which represents the colonial history of Boston (Fig 6). It was a long road, and I was lucky enough to have the time to reach the sea side following this road! (Fig 7).

Fig 5. The sign of “Trail of freedom” on the road.
Fig 6. Walking to the sea, following the trail of freedom.
Fig 7. And we reached the destination, the sea side, always nice weather!

Despite the exciting sightseeing, I still felt a little regret for not having enough time to explore more about city. While it is a dynamic young city (the same age of USA), it was a city mixed with modern and historical culture and architectures, and a really nice place to live. I wish I can visit this beautiful city again sometime in the future.

Thanks for reading

Qingyuan Ji

ESRI UK User Conference Tuesday 17 May

This year’s ESRI Annual Conference took place once more in the QEII Conference Centre in the heart of Westminster.  It was good to meet up with several Newcastle graduates, each making their mark on the GI industry.  The major ‘take-away message’ from this year’s conference was the increasing ease by which the traditionally ‘clunky’ ArcGIS desktop can be left behind in favour of developing using ArcGIS Pro and ArcGIS Online, products with regular and frequent update cycles and increasingly comprehensive functionality.

From the perspective of ESRI, David Rix (1976 graduate) and Dominic Stubbins (1995) were amongst the welcoming corporate hosts, contributing to an efficiently-run and informative event, well worth the trip from the north!  Nathan Ward (1993) was manning the Leica stall, one of several associated partners exhibiting in the building.  Laura Hanson (2003 graduate), now with Arup, and Rachel Oldroyd (2011 graduate), now with the University of Leeds, were ex-staff members spotted, along with Meredith Williams (staff 2000-2010).

Joining Dominic from the 1995 cohort was Ian Moodie, whilst from even further even back, Rob Knight and Helen Durham (both 1985) are both thriving.  Clive Surman-Wells (1988) and Andy Hopkins (1996) made their presence known also, along with some 21st century graduates – Bruce Ford (2009), Claire Watkins (2009), Victoria Short and Matt Bowerbank (2010), Matthew Bierton (2014) and Jonathan Hallam (2015).

Next week, the re-unions will continue in London at the GeoBusiness event.  There is a formal Newcastle alumni meeting on Tuesday 24 May at 15:00 hrs.  Come along to the Business Design Centre in Islington, if you are in town …

GIS students present research projects Friday 13 May

This week saw the annual ‘Final Year Conference’, the showcase for the Stage 3 Geomatics students to present their dissertation research in a formal venue to their fellow students and to the staff and postgraduates in the School.  A total of 31 Newcastle Geomatics students delivered talks in two parallel tracks with themed session titles including ‘Built Environment’, Spatial Analysis’ and ‘Geovisualisation’.  The 12 final-year Geographic Information Science students’ topics were as follows:

Nada Alabdulwahed used an impressive range of satellite remote sensing imagery from the past 20 years to track the urban development of the city of Al Khobar in eastern Saudi Arabia.  Standard image analysis and classification techniques along with ground truthing and integration with other data on population and land reclamation allowed for accurate quantification of urban growth.

Ed Drummond-Hay researched house price changes across England and Wales, using millions of records from Land Registry, ONS and commercial sources.  His hypothesis was that house price increases in London ‘rippled’ out from the capital to affect the rest of the country after a time lag.  The dynamic and animated representation of such patterns was an important part of the output from Ed’s research.

Emmanuel Egunyu aimed to create an online website resource to promote tourism in his native Uganda.  Using OpenStreetMap data and open source technologies with PostGIS and Geoserver, he reported on the creation of a map-based information portal for those planning to visit national parks and view wildlife in this country.

Alexia Fenn’s study concentrated on the validity and reliability of observations from GPS receivers worn by athletes.  A variation of sport/athletics course shapes, course distances, and exercise/movement intensities were examined.  Walking, jogging, and sprinting over various distances and in a variety of course configurations were examined, with GPS accuracies determined for each exercise regime.

Will Franklin developed a system to estimate the safety of junctions on the road network in Newcastle.  By calculating a Junction Risk Factor, based on a number of parameters related to road conditions and traffic volumes, he was able to develop a predictive model to determine the optimum location for investment in road network improvements.

Jo Gallagher’s interest in spatially-enabled Twitter data led to a study of the geolocation of football clubs’ fan base.  He found that the ‘bigger’ the club, the more dispersed the distribution of fans – backing up the popular theory that the mean location of a Manchester United fan is some distance from Old Trafford.

Patryck Janicki’s research aimed to develop a geodatabase schema able to hold both CityGML data at Level of Detail 1 and main Industry Foundation Classes (IFC) classes.  The ability of the schema to abide by standards, allow for SQL queries, hold geometry effectively, was to be supplemented by an effective visualisation flowline through export to QGIS.  The outcomes of this project have impact on the integration of BIM with GIS.

This was also the focus of the research of Anthony Morley, who examined current technologies for importing a BIM model into a geospatial environment and assessing interoperability.  This involved using a range of software and data formats, including ArcMap, ArcScene, ESRI City Engine, REVIT, AutoCAD and FME.  The geometric and semantic integrity of the model, and the needs of users were considered.

Amber Kaye-Kenyon chose the analytical capabilities of ArcMap, ArcScene and City Engine (including Buffer, Viewshed and Line of Sight (LOS)) to look at the modelling of an urban sensor network.  In the context of the instrumented city concepts being developed in Newcastle upon Tyne, particularly around the university’s new Science Central campus, ease of use, visualisation and effective monitoring of the sensor network were derived.

Ben Nicholls undertook a very detailed study of some of the rich cartographic generalisation tools in ArcGIS.  Applying these to different types of feature (railways, contours, buildings etc. as represented on large scale Ordnance Survey data), and in different locations (e.g. central urban zones, rural regions), Ben presented an impressive assessment of the data pre-processing, algorithm effectiveness and presentation quality of such procedures.

Josh Watson’s theme was a big data set dealing with cardiac arrests outside hospital.  The spatial and temporal distribution of these events was determined, as a precursor to understanding the nature of the phenomenon and to try to raise low survival rates in the North East.  Clusters of cases were apparent and these were linked to population distribution, to ambulance stations and response times, and to times of day, season and year.

Imogen Weight made a comparative study of several web mapping APIs, assessing data needs, scope of functionality, usability, and final appearance of maps created in Leaflet, Mapbox, and the dedicated Javascript APIs for Google Maps and for ArcGIS.

The remaining students (Surveying and Mapping Science students) pursued research topics in a wide range of other spatial themes, many of which have a GIS ‘flavour’.  Environmental monitoring of coasts, glaciers, urban heat, and floods used GIS tools, as did further investigations of BIM, and further social investigations of education from a GI perspective.

My GISRUK 2016 Experience

So this year I (Kaizer) managed to attend the GISRUK conference in London with Dr. David Fairbairn. I must admit it was quite a good experience to meet other researchers working in the GIS field. I also had a chance to present my poster to a large number of people who never gave me a breather because they kept on coming and asking more questions. It was a good experience, to share with them what my work entailed. Their fascination was mostly on the fact that I was working towards introducing a novel concept of VGI, to a developing country (Botswana). Volunteered Geographic Information in Land Administration has a big role to play in developing countries. This research with its objectives of investigating how such a technology can be used to improve Land Administration Systems in developing countries is very optimistic that it is what the doctor ordered for regions with limited resources, dysfunctional, closed and ineffective land administration systems.

Having standards based systems has worked diligently for western countries and a large number of developing countries have tried to follow suit, with less success. The reasons being that they are simply not affordable to these countries, while in other cases they lack capacity to carry them forward after they have been implemented. As such, alternative solutions like VGI, which aim to develop affordable, fit for purpose, more open and participatory solutions are worth investigating. Our belief is that they are the answer to these countries especially in rural areas where there is little or no land information to help rural communities secure tenure. In addition, the participatory nature of VGI helps individuals become aware of activities in the communities and they are better poised to manage their land and its resources. With VGI, there can be clarity of who owns what, where, and in what proportions. Conflicts can also be reduced amongst neighbouring villagers in the community.

Reflections on GISRUK 2016

The 24th GISRUK conference took place last week in the University of Greenwich.  After significant Newcastle input to the 2015 GISRUK in Leeds, this year saw a smaller presence – just David Fairbairn and Kaizer Moreri attended, each with a poster, each on VGI and the fidelity and value of such citizen-sourced data for applications in national mapping and in land registration systems; the overall attendance and size of programme was certainly smaller than previously. 

The venue was certainly impressive, Greenwich (a UNESCO World Heritage Site) looking stunning in the spring sunshine.  The university’s vice-chancellor, David Maguire – GIS guru from his time at ESRI and his continued joint authorship of ‘the book(s)’ – welcomed us, thanking the main organisers, Zena Wood and Mike Worboys from the Greenwich GIS Research Group.

There was the usual variety of sessions and papers, with some unusual focus on gazetteers, on novel systems and applications (e.g. an innovative tourist guide to Lancaster), and on VGI issues and uses.  Those ex-Newcastle GISRUK stalwarts from Maynooth introduced us to some interesting personalities, responsible to addressing GIS concepts long before GIS was ever thought of …

Workshops and challenges, and an appeal to informality which benefits the large number of MSc students brought along to GISRUK every year, are what can be expected from this annual meet-up.

The three keynotes, well-scheduled throughout the programme, were the highlights: Ross Purves (University of Zurich) demonstrated the enduring value of his long-standing research on tags, semantics, ontologies, and full text retrieval and analysis; Nye Parry (University of Greenwich) took us on a tour of music (and dissonance) which had a spatial aspect to it; and Jeremy Morley (an external examiner at Newcastle in a previous life), demonstrated, amongst other things, the response of Ordnance Survey to changes and opportunities in GIS technologies, in a wide-ranging and thoughtful presentation.  Amongst his assertions was that fundamentally GIS has not changed in the past 30 years, and that all developments have been incremental ‘add-ons’.  It was ever thus, of course, with Ordnance Survey itself being recognisable, even today, to the apocryphal cavalry officer for whom its maps were created from 1791.  The main debate of the conference, and perhaps one its main outcomes, was about the nature of change in GIS, and whether GIS needs a revolution or continued evolution.

Dr Rachel Gaulton to co-organise Royal Society international research meeting

Dr Rachel Gaulton, School of Civil Engineering and Geosciences, with colleagues from Salford University (Professor Mark Danson, lead organiser), University of Massachusetts Boston, and University College London, has won support from the Royal Society to hold a Theo Murphy International Scientific Meeting at The Society’s Chicheley Hall. The meeting will bring together key researchers from around the world to discuss “The terrestrial laser scanning revolution in forest ecology” and amongst the sixteen invited speakers are researchers from Australia, United States, Finland, Netherlands and the UK. The meeting will lead to a special themed issue of the Royal Society’s inter-disciplinary journal Interface Focus.

Forest Structure

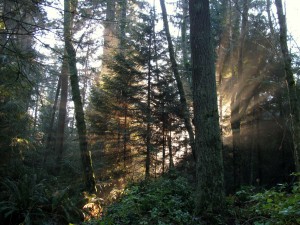
Complex forest structure is difficult to quantify from traditional field inventory but can be characterised in 3-dimensions using TLS

Terrestrial laser scanners, or TLS for short, provide detailed three-dimensional measurements of forests with unprecedented accuracy, by firing millions of laser pulses up into the canopy. These measurements are set to revolutionize the way in which ecologists measure forests, allowing changes over time to be characterised, and will help scientists to understand the role of forests globally in carbon storage and to monitor the impacts of climate change.  Newcastle University Geomatics Research Group has a long track-record of research at the forefront of TLS processing and application, including recent NERC-funded work on dual-wavelength laser scanning for forest health monitoring and the meeting will provide a key showcase for this work, whilst helping set the wider agenda for the future of the field. The meeting will take place on the 27-28th February 2017 with the programme released soon.

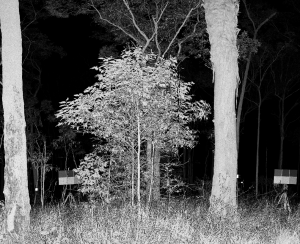
SALCA forest image

Forest laser scan from the Salford Advanced Laser Canopy Analyser


Ordnance Survey PhD Workshop

February 9th and 10th was the third of what has become an established annual event for Ordnance Survey (OS); inviting all sponsored PhD and postdoc researchers to present their latest research at the Ordnance Survey head office in Southampton. Whilst many know OS mainly for their paper maps, there is a wide range of research that is being undertaken to keep OS at the forefront of mapping technologies. This diversity in research was presented over the two days in four themed sessions. The opening session was ‘3D’ and was opened with my research on automatic reconstruction from a dense image matching dataset. Other 3D research presented included automatically adding texture maps and semantic information to 3D building models (Jon Slade, Cardiff University), why people need 3D (Kelvin Wong, University College London) and real-time urban dataspace modelling (Oliver Dawkins, University College London).

As well as giving oral presentations, a panel session was held at the end of each session where the session’s presenters and OS employees working in the relevant field were asked questions on the overriding theme of the session. This generally led to some really interesting and insightful discussions about how the panel saw the discussed research fitting into the OS remit. It also became apparent that parts of the research presented in the session as well as the other session had several overlapping themes, opening the opportunities for future collaboration. A poster session was also held after lunch each day which allowed OS employees who may not be directly involved with the research to view what studies are currently being undertaken, whilst giving the authors an opportunity to network and discuss their results.

The final session of day one was themed ‘Data Analysis’. The first two presentations from Robin Frew, University of South Wales, and Rebecca King, University of Southampton, addressed spatial usability issues and temporal modelling, respectively. The final two speakers of this session were first year PhD students presenting an overview of their research; Nick Bennett, University of Southampton, and Judit Varga, University of Nottingham, will be investigating similar topics in the use of data mining to map events and update mapping at different scales.

The second day opened with the theme of ‘People and Places’, the social sciences side of Ordnance Survey research. This covered a wide range of research included mapping vernacular geographies (Katherine Stansfeld, Royal Holloway, University of London), how people identify with narratives and place (Iona Fitzpatrick, University of Nottingham) and how different users interact with geo-spatial technology (Mike Duggan, Royal Holloway, University of London).

To close the workshop the final session theme was ‘Machine Learning’. Presenters Ce Zhang (Lancaster University) and postdoc David Young (University of Southampton) discussed their research utilising deep learning for supervised and unsupervised image classification.

As well as giving us the chance to see the various research projects undertaken by OS as well as getting to see our external supervisors, it also gives the chance to see how fellow PhDs are progressing through their projects and share an tips or advice of how to overcome the next hurdle. As I am now approach the writing up stages of my research, this will unfortunately be my last OS PhD workshop. I would therefore like to take this opportunity to thank Ordnance Survey for the data supplied and their continuing support throughout the progression on this research.

Andrew McClune

Final year PhD Researcher