This week myself and Neil Harris from the Geospatial Engineering group are participating in the second Technical workshop of the Cariwig project. Participants from the Climate Research Unit at UEA, the University of the West Indies Climate Studies Group, the Caribbean Community Climate Change Centre in Belize and representatives from the Instituto de Meteorología, Cuba have been discussing how best to use the web based climate data, analysis and visualisations tools developed by Neil and myself to create impactful case studies to show decision makers the potential impact of climate change across a variety of Caribbean countries and sectors.
A follow up meeting later this year will provide training in the web based tools to a large number of stakeholders in the region.
From the 16th April to 18th April I attended GISRUK in a surprisingly sunny Glasgow. The started with a welcome from Jane Drummond followed by an interesting key-note talk from Mike Worboys , A Theoretician’s eye view of GIS Research. He talked about how GISRUK has developed there has been a dramatic fall in the proportion of papers that covered the theoretical side of GIS, with the focus now being on Application.
Talks from the first day that I particularly enjoyed focused on Spacebook, a system of delivering directions via audio as users encountered various way points on a route. William Mackaness talked about his research in comparing directions given using street names and direction given using landmarks.
Phil Bartie, who was a researcher on William Mackness’s paper delved deeper into the issue of Landmarks. Using images he looked at what people identified as landmarks and then analysed them semantically and spatially to distinguish related and unrelated features.
The following day saw me presenting a talk on some of the sensor infrastructure work we’ve done at Newcastle using HStore as a key-value based approach to storing heterogeneous data. Robin Lovelace’s talk round the merits of twitter data in research. Sparking some interesting debate about how research using twitter data uses data from the public so should benefit the public.
Thursday evening then featured the conference dinner followed by the Céilidh, an event that I was secretly dreading, dancer I am not. So was pleasantly surprised at how much fun the event was, as someone pointed out to me; it’s dancing but dancing with an algorithm.
Friday morning then featured my favorite talk of the conference with Paul Brindley talking about his Phd work on extracting the additional address information from addresse listed on the internet to map out neighborhoods. A simple idea but with fascinating results.
The conference was then wrapped up with a keynote from Professor Alias Abdul Rahman who gave an interesting overview on the state of 3D GIS work.
The event was a fun filled thought provoking and thoroughly interesting. Thanks must go to Jane Drummond for seamlessly organizing the event, even managing the weather. I would also like to thank William Mackness who brilliantly chaired my session.
Bring on Leeds 2015. Wonder what there version of Céilidh will be?
The inaugural International Symposium for Next Generation Infrastructure was held between 1st and 4th October 2013, at the SMART Infrastructure Research Facility at the University of Wollongong, Australia, and one lucky Geospatial Engineering researcher from Newcastle was able to attend. David Alderson gave a 20 minute presentation entitled “A National-Scale Infrastructure Database and Modelling Environment for the UK” following a successful submission of a conference paper to the conference committee, under the same title. The work contained within the paper and the presentation represented an amalgamation of work conducted by David and other researchers from the Geospatial Engineering group at Newcastle and other research institutes and universities involved in the Infrastructure Transitions Research Consortium (UK ITRC) programme. The focus of the paper and presentation was to give readers and delegates alike a glimpse of some of the work undertaken in the process of constructing a database of infrastructure-related data relevant to the UK. This included not only an overview of some of the datasets that may be found within the database, but also a preview of some of the visualisation tools that are being developed on top of the data. An overview of these visualisation tools can be found within other posts in this blog site here.
A copy of the slides can also be found here and here. Unfortunately the presentation has had to be split into two parts, so please download from both links to get the full presentation.
Other representatives from the School of Civil Engineering and Geosciences at Newcastle University, UK could also be found delivering presentations at the event including:
Further to this fantastic opportunity, a further round of meetings looking to develop collaborations between researchers at SMART, including former Newcastle-based PhD student and post-doctoral researcher Dr Tomas Holderness, and the Geospatial Engineering group at Newcastle, is being held at the SMART infrastructure facility between October 8th and 11th 2013. These meetings will look to focus on potential collaborative opportunities regarding network interdependencies between infrastructure networks, and also web-based data dashboards for visualisation and dissemination purposes.
From the 17th-18th of September I attended the Geohack event at FOSS4G conference in Nottingham. The event was sponsored by the MetOffice in partnerships with many other of organizations within Environmental Science to Services Partnership. A number of challenges were presented for hackers to work on, these are listed here http://2013.foss4g.org/geohack/challenges/ . As part of the LTURF project I have found myself working with a number of APIs trying to extract any information for around Newcastle. This lead me to picking the outdoor event challenge as it was making use of several APIs http://2013.foss4g.org/geohack/challenges/events/ .
This aim of this challenge was to estimate the effect that weather has on outdoor events in the UK. The first task was to retrieve information about any outdoor events happening in a given location. This was achieved by using the skiddle.com, an events listing website, and their API. Which allows you to search for events planned using a point and a buffer. Once we had the events the next goal was to gain an estimate of the number of people attending each event. This task was assigned to me, and for this I used both the Facebook and the twitter APIs. With Facebook returning the numbers of attending and maybe responses to the event, and twitter returning a popularity score. The final step was to use Met Office DataPoint API to get the weather forecast of the event. These were then all integrated into a very simple web portal. This is live here , we had little over 24 hours to complete this task so the portal is very much substance over style.
At 1pm on the second day everybody had to stop developing and then present they work for it to be judged. It was very interesting to see what the other groups had achieved , with some of the achievements being very impressive given the amount of development time. Phonegap, which is a free and open source framework that allows you to create mobile apps using standardized web APIs across many platforms, was used by a number of groups. And is clearly a very powerful tool with some groups having a completed app developed in just 24 hours. Unfortunately my group didn’t finish in the top 3 which I’m certain is only because the complexity of our app was hidden, in short we lost because it was too good.
The event was brilliantly run with plenty of food, drink and electricity to go round and I would like to thank the members of the Met office and the foss4g volunteers for organizing the event. And Also Steven Citron-Pousty who setup the OpenShift server for our app.
As part of the British Science Festival 2013 being hosted at Newcastle University, researchers, staff, lecturers and students were invited to contribute to a comic being developed and designed by local comic enthusiasts. The comic was officially targeting children between the ages of 8-13, with a view to promoting STEM subjects and science in general. The proposed content of the comic had, you guessed it, a distinctly scientific theme to it, with organisers interested in hearing from those staff members who could fit their work (or at least make it look like their work fits) in to one of the following themes:
Robots
Explosions and danger
Dinosaurs
Space, time and travel
Very big and very small things
Things we eat, and things that eat us
Codes, ciphers and hidden messages
Heroes and villains
Matters of life and death
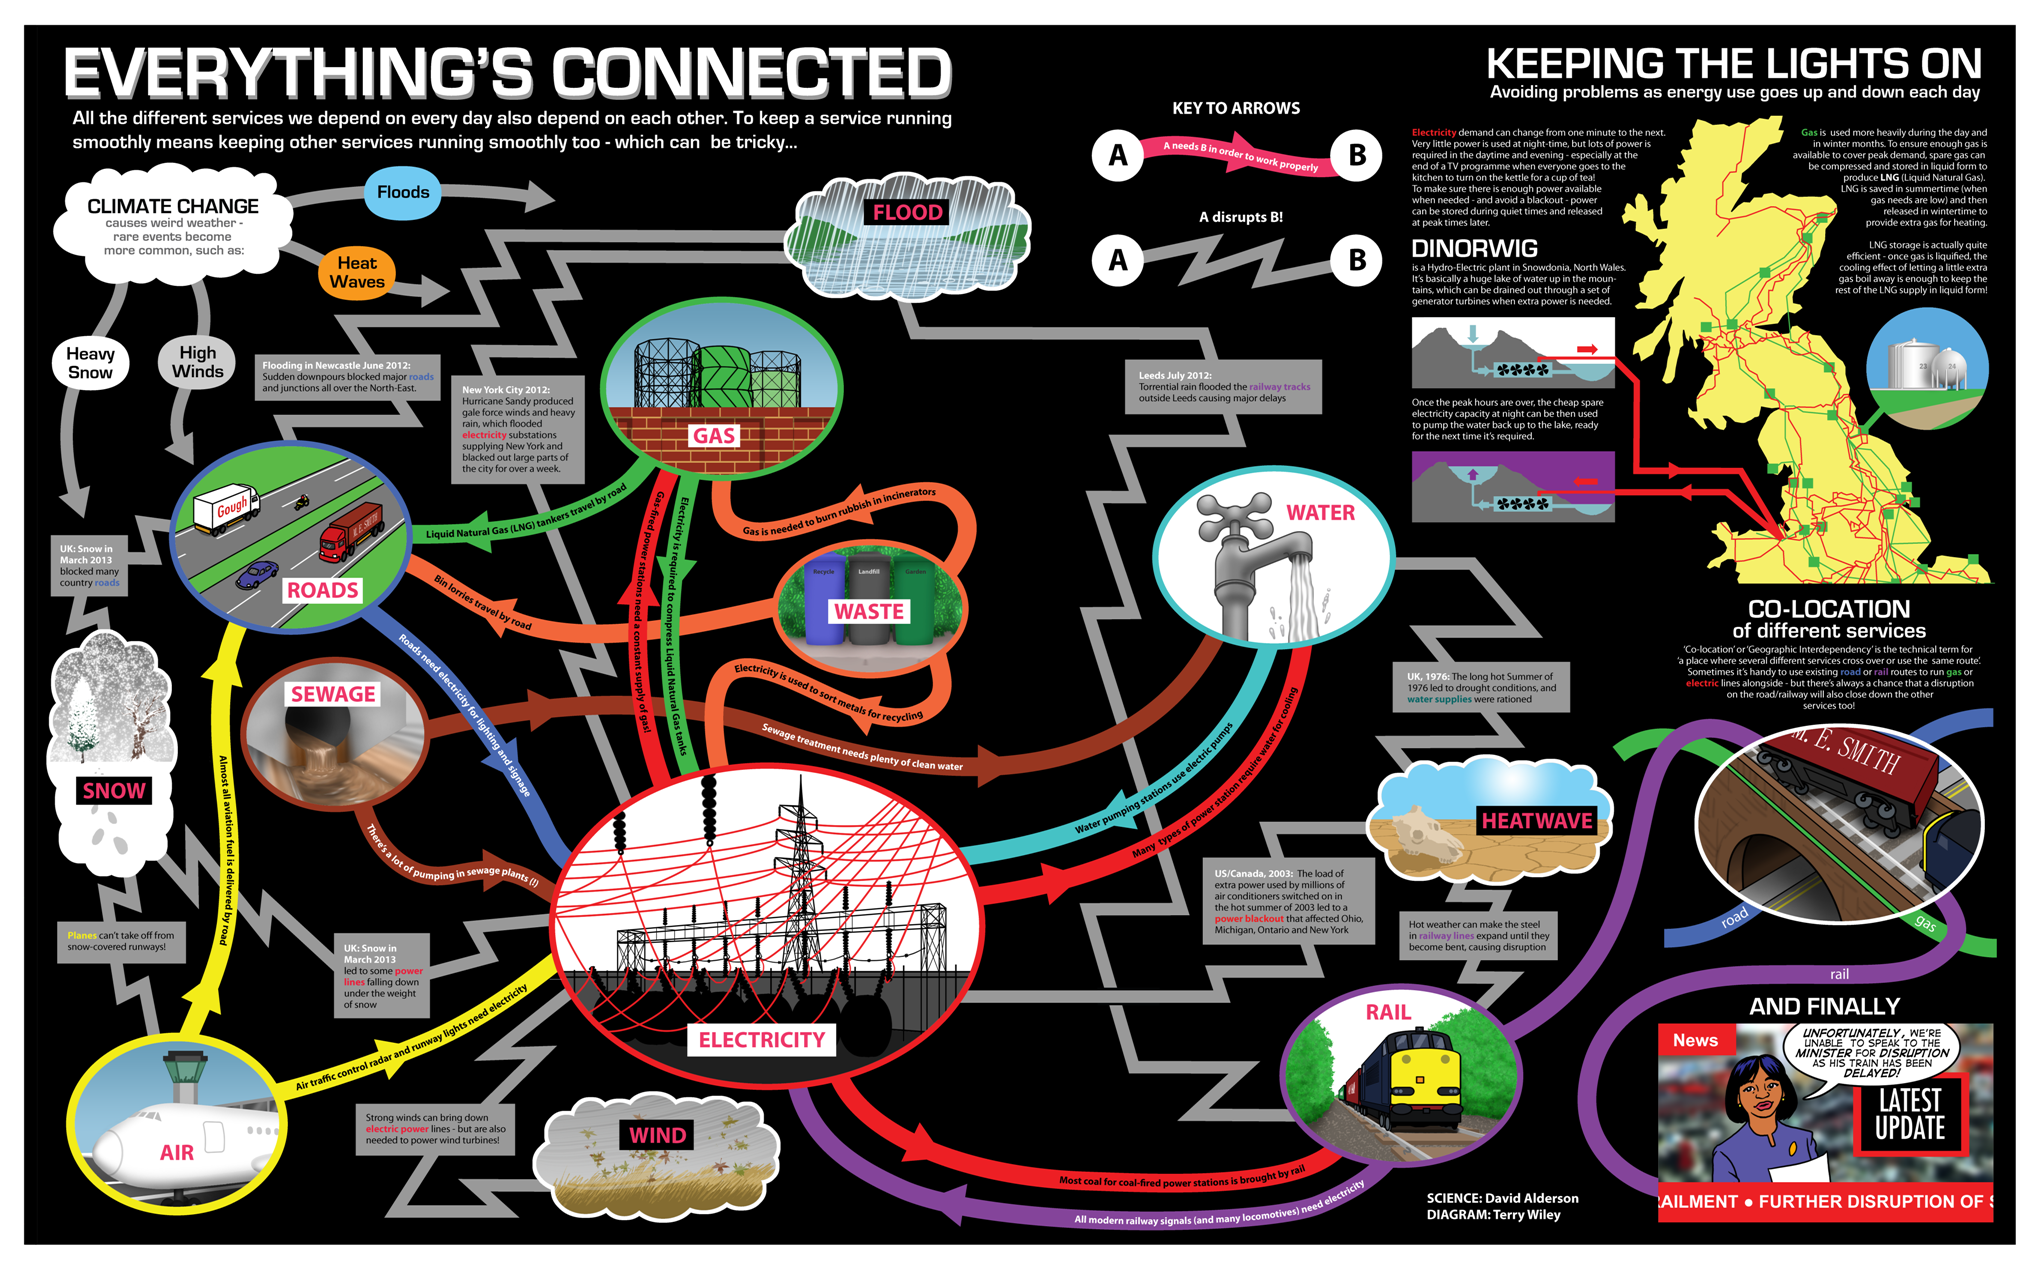
Some of the work related to networks, connectivity and infrastructure that is currently being conducted within the context of the Infrastructure Transitions Research Consortium (ITRC – www.itrc.org.uk) and also within the School of Civil Engineering and Geosciences, seemed like something that kids could be interested in, and the idea of presenting this type of work within a comic context offered an alternative and novel mechanism for communicating our research. Once an expression of interest in contributing to the comic had been lodged, it was simply a case of meeting an artist and writer assigned by the organising committee, and beginning to think about what a comic to represent networks, connectivity and infrastructure should look like! In fact, largely due to the expertise and imagination of the artist I had been assigned (Terry Wiley), the ideas began to come together, and rather than stick to the traditional panel-based approach we decided on more of a spider diagram affair to communicate how different bits of infrastructure are connected together. However I still wish we had managed to get our idea of slightly transparent paper with networks hidden until the page was held up to the light, to fly to communicate the idea of hidden or non-obvious connections! Oh well, maybe next time. For all those interested, the comic, entitled “Asteroid Belter”, in hard copy format was distributed at the British Science Festival 2013 (7th-12th September), but more information about it can be found here.
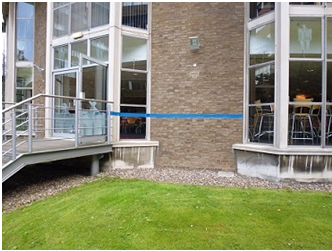
The sessions began with Dr Parkin delivering a brief summary of some of the causes of flooding and extreme flooding, citing many references that relate to flood events experienced in recent years within the UK, including those that occurred in Cumbria in 2005, Tyne and Wear in 2008 and 2012, and many others. However that was just the standard “in-class” part of the activity, and although the seminar generated interest from the students in such topics as the water cycle, climate change, global warming, and the impacts of flooding, the “really” interesting part came when the children were let loose outside on the University campus, to take part in a crowd-sourcing exercise.
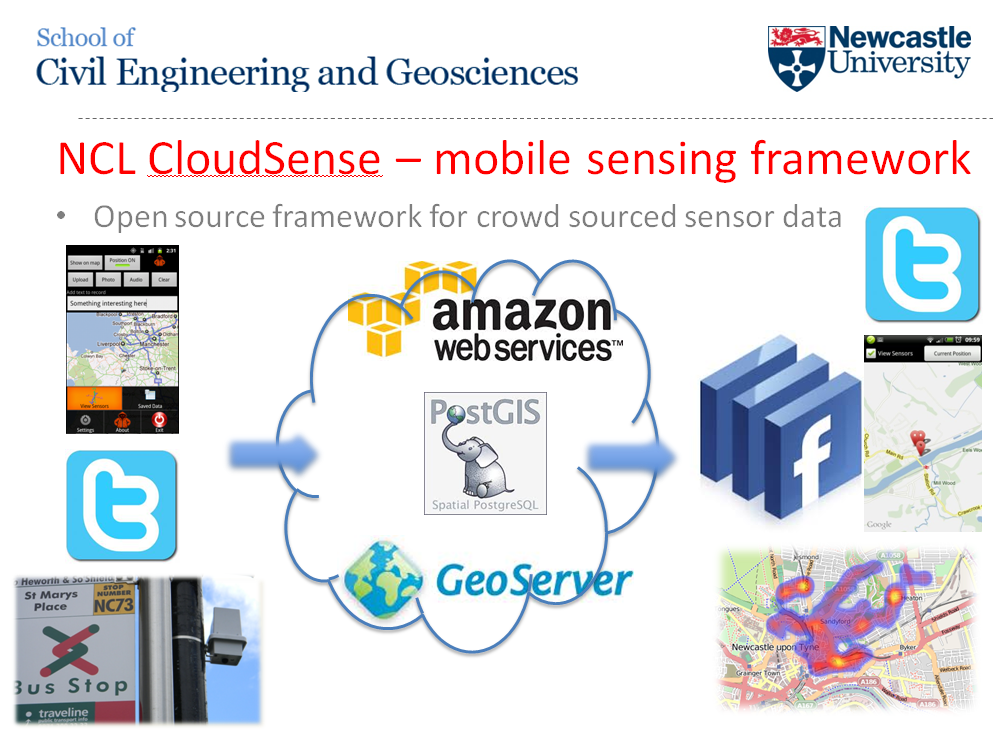
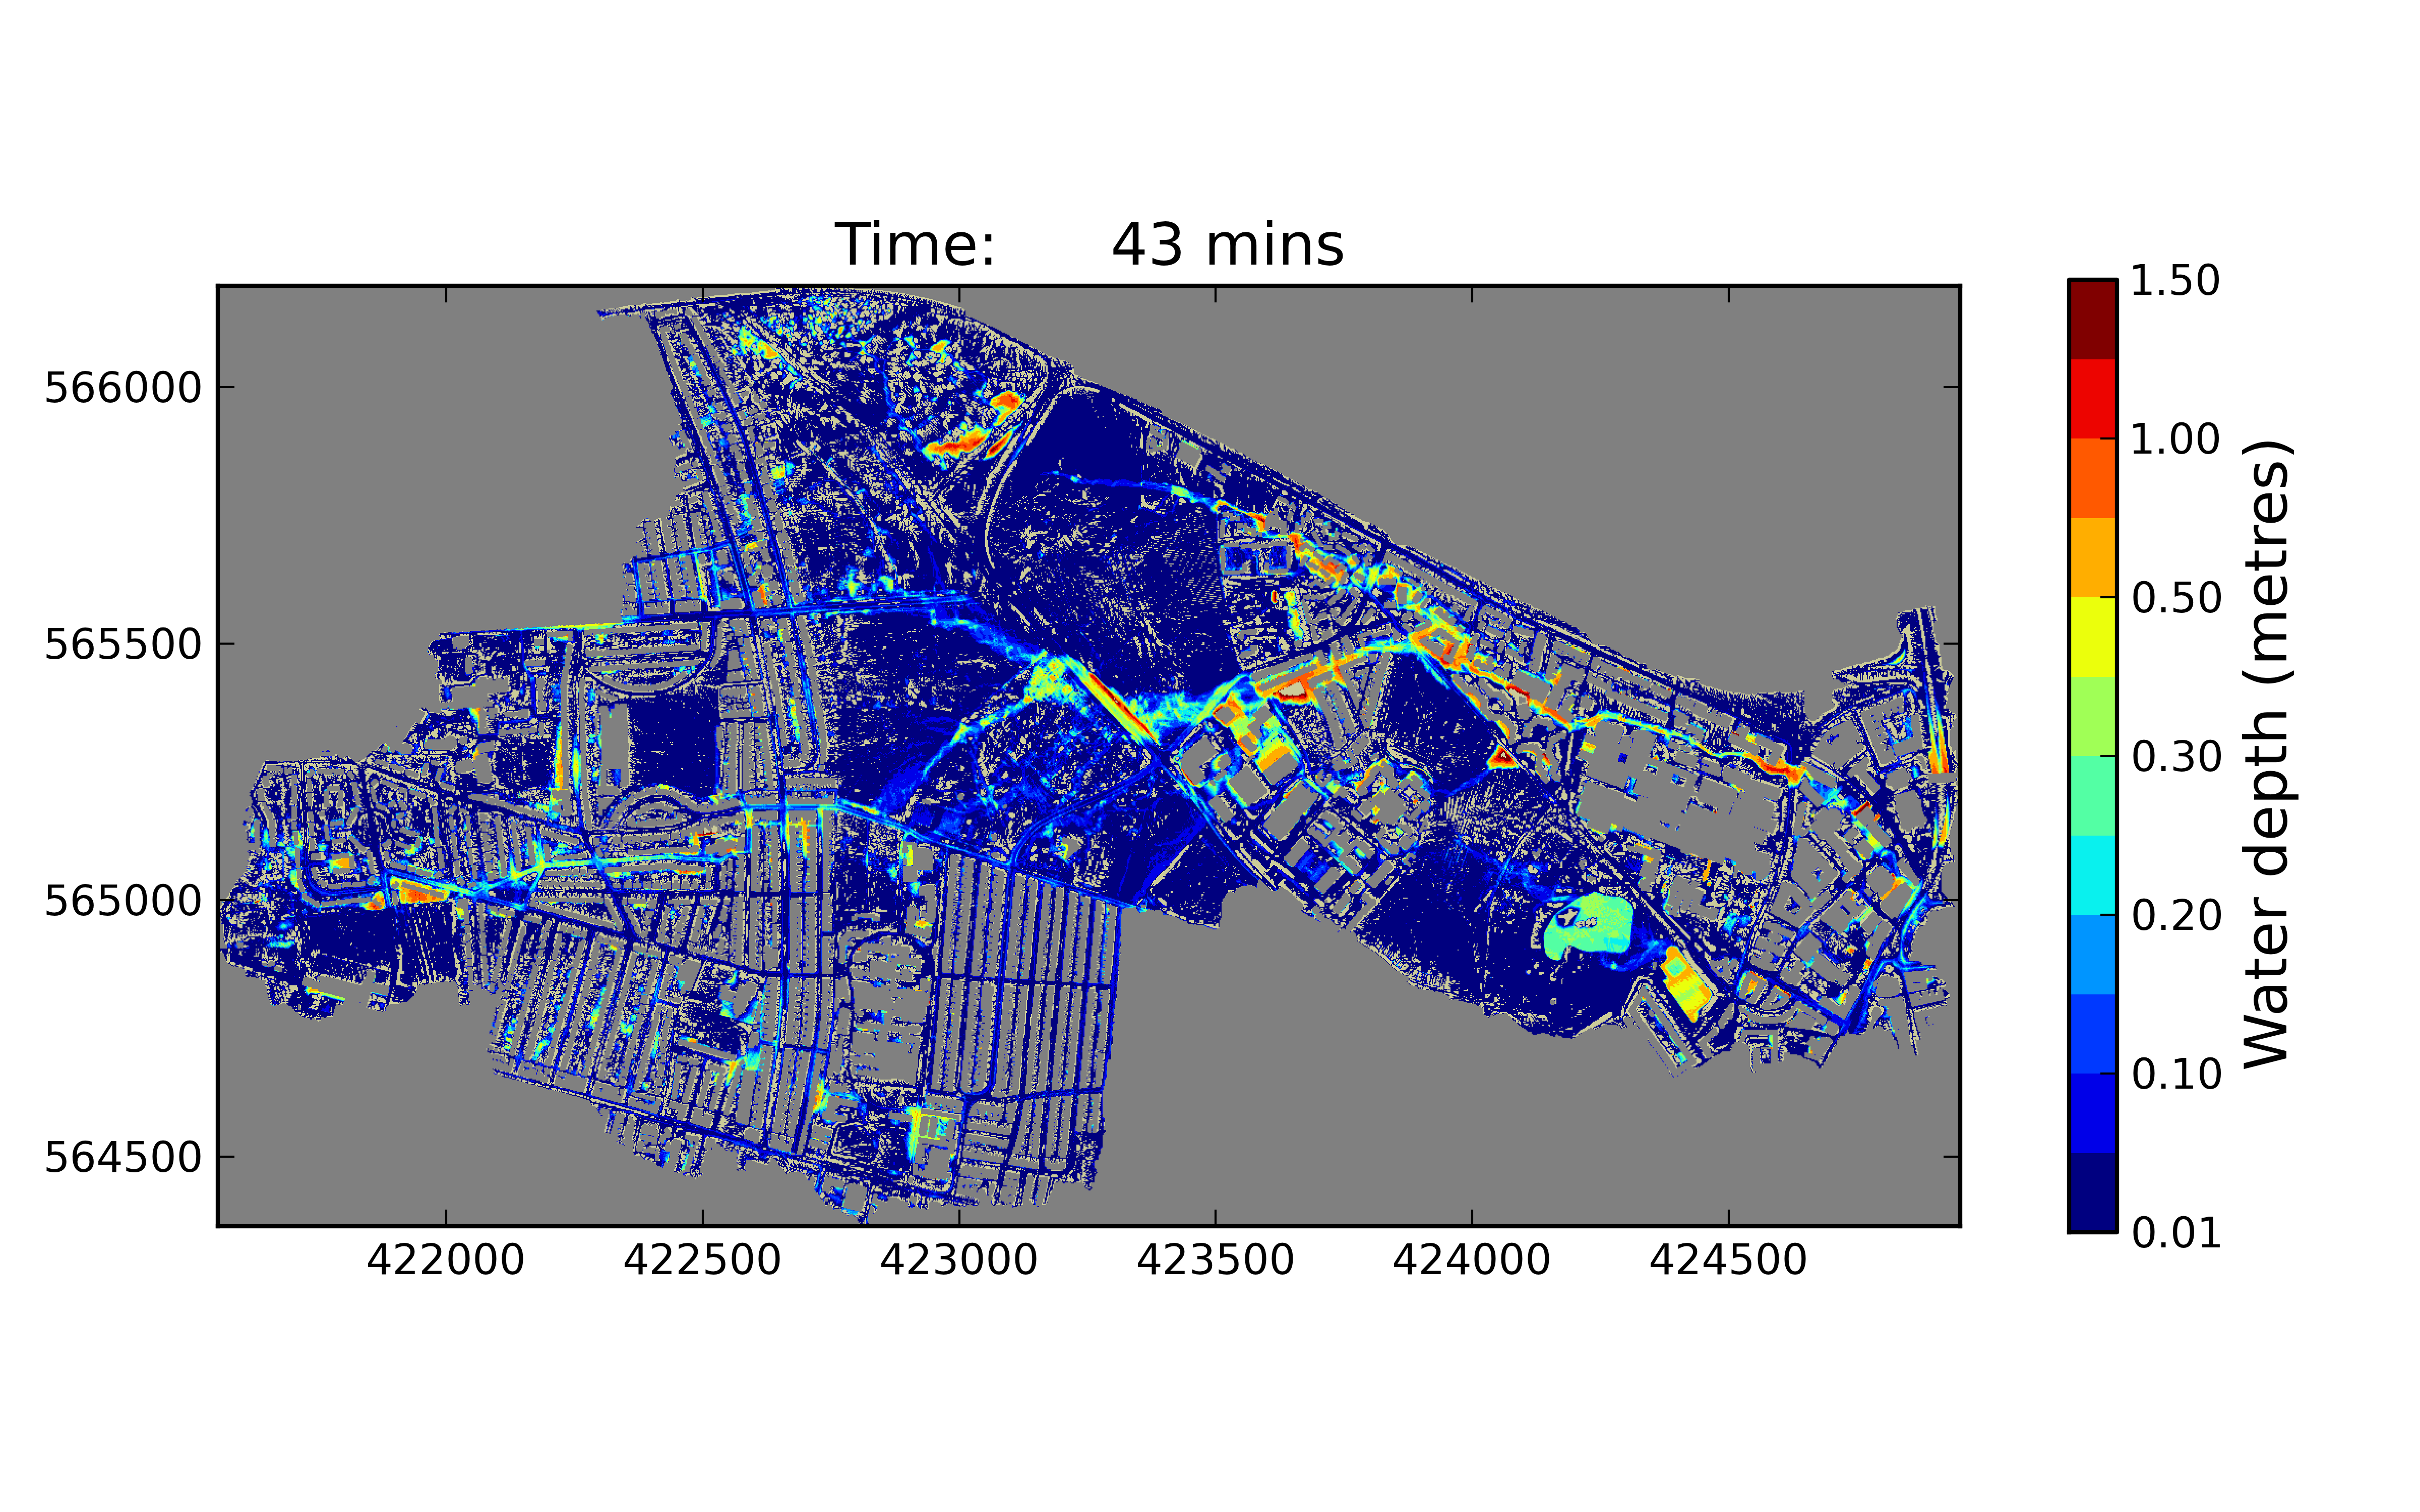
Crowd-sourcing in it’s most simple terms involves members of the public contributing data, information, comments, stories, pictures etc, which are then subsequently used within some form of analysis. Within the School of Civil Engineering and Geosciences, there has been a concerted effort since the flooding in a local market town, Morpeth, in 2008, by water and geomatics researchers and lecturers alike to collect as much crowd-sourced based information about flooding and flood events that occur within the region. The contributions from the general public about the locations and timings of floods, alongside photography giving a reasonable indication of flood depths, levels and wrack lines, can be used to validate computer simulations of flood models, developed within the School. Some of the results of these crowd-sourcing endeavours can be found here.
So the purpose of crowd-sourcing in the context of flooding was explained to the students in attendance at the Blueline event, and how it can be used to help better understand how a flood propagates through different environments. Since the floods in 2008 and 2012, Philip James has developed an Android-compatible “app” that helps to facilitate this process, by allowing a user to use the location technologies within an Android device (tablet, smart phone etc) to locate themselves, and then subsequently use the camera to take a picture. The great thing about the app is that this data can then be sent to a server and published immediately onto a website, giving a near-real time record and subsequent archive of a flood event. As stated, this type of data is invaluable to understanding how a flood arises and then subsides. For more information about the app and the technologies employed to deliver this solution, have a look here.
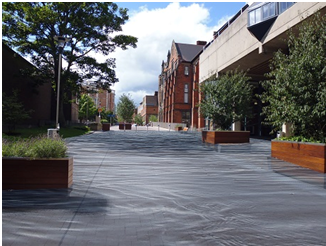
So the school children were escorted outside where a “pretend” flood had been erected around Newcastle University campus (effectively just a line of blue tape indicating a flood level based on a particular amount of rainfall), and asked to use the app and a tape measure to record information about the depth of this “flood”. This seemed to go down a storm (sorry) as it offered them a chance to do all the things that children seemingly would rather be doing i.e. being outside and playing with technology! Each pairing were asked to try to record at least one reading at each point where we stopped around campus. Further to this a series of QR codes had been erected along the blue line that the students were able to scan, subsequently directing them to a site of historical photography of the flooding that occurred on campus in 2012, as well as some “constructed” imagery of the imaginary flood that they were measuring. For more information on this site and the photos, please follow this link.
How will current socio-demographic evolution affect future transport patterns and traffic conditions?
How will urban development and transport policy influence the quality of life of various segments of the local community?
The ‘Shaping the Sydney of Tomorrow’ Project (StSoT) was commissioned by Transport for NSW (Australia) to better understand the interactions between transport and land-use dynamics as experienced by individuals and households over extensive periods of time (15-20 years). Stepping away from traditional optimisation, our model focuses on anticipating short and long-term emergent consequences and feedbacks resulting from interactions between people and their urban environment, through the creation of ‘what-if’ scenarios (risk assessment approach). The innovative design and development of TransMob aims to challenge three traditional but highly limiting modelling assumptions:
•Long-term steady-state equilibrium of the system: in fact, transport services and urban development co-evolve along with socio-demographic changes in highly dynamic ways and out of equilibrium.
•Feed-forward effect of urban development on transport networks: in fact, evidence suggests that there is a strong feedback effect of transport solutions onto land-use changes.
•Homogeneous and utility-based social responses to transport and land-use planning: in fact, there is more to decisions on transport modes or residential locations than pure micro-economic reasoning; most unintended consequences stem from unexpected heterogeneous individual considerations.
TransMob is made of six modelling components: (1) synthetic population, (2) perceived liveability, (3) travel diaries, (4) traffic micro-simulator, (5) transport mode choice and (6) residential location choice. The model is applied to the inner south-east area of Sydney metropolitan area and simulates the evolution of around 110,000 individuals and 50,000 households over 20 years, according to various transport and land use scenarios.
At the end of 2012 Dr Stuart Barr and Alistair Ford from the Geospatial Engineering group paid a visit to the University of Innsbruck for a week of discussions, demonstrations and workshops with the ‘Umwelttechnik‘, or the Unit of Environmental Engineering. The group of Professor Wolfgang Rauch specialises in urban water management through novel modelling approaches which link traditional hydraulic modelling with cutting-edge urban, infrastructure and agent-based models. Since the Geospatial Engineering group is interested in environmental sustainability and climate change, the entire journey from Newcastle to Innsbruck was undertaken by train!
Catching up on some reading...
During the week, the researchers from Innsbruck demonstrated their innovative models of water infrastructure development. These link physical simulations of water supply and sewerage systems with future projections of urban growth, allowing assessments of network performance under climate and socio-economic change. Also demonstrated was the ‘ACHILLES‘ approach (link in German) to network failure assessment, ranking each component according to the impact its failure may have on the whole network. The group are based in the Faculty of Civil Engineering, based on the new technical campus of Innsbruck University. The view from their offices is quite impressive…
A meeting room with a view!
The work of the Newcastle Geospatial Engineering group was also presented to demonstrate alternative techniques for urban development modelling being developed here. Fruitful discussions followed, leading to possible collaboration and crossover activities. The opportunity was also taken to learn about new computing and processing techniques being developed in the Innsbruck group (using GPU processing for hydraulic simulations) and to discuss contrasting open source modelling frameworks being developed by both groups.
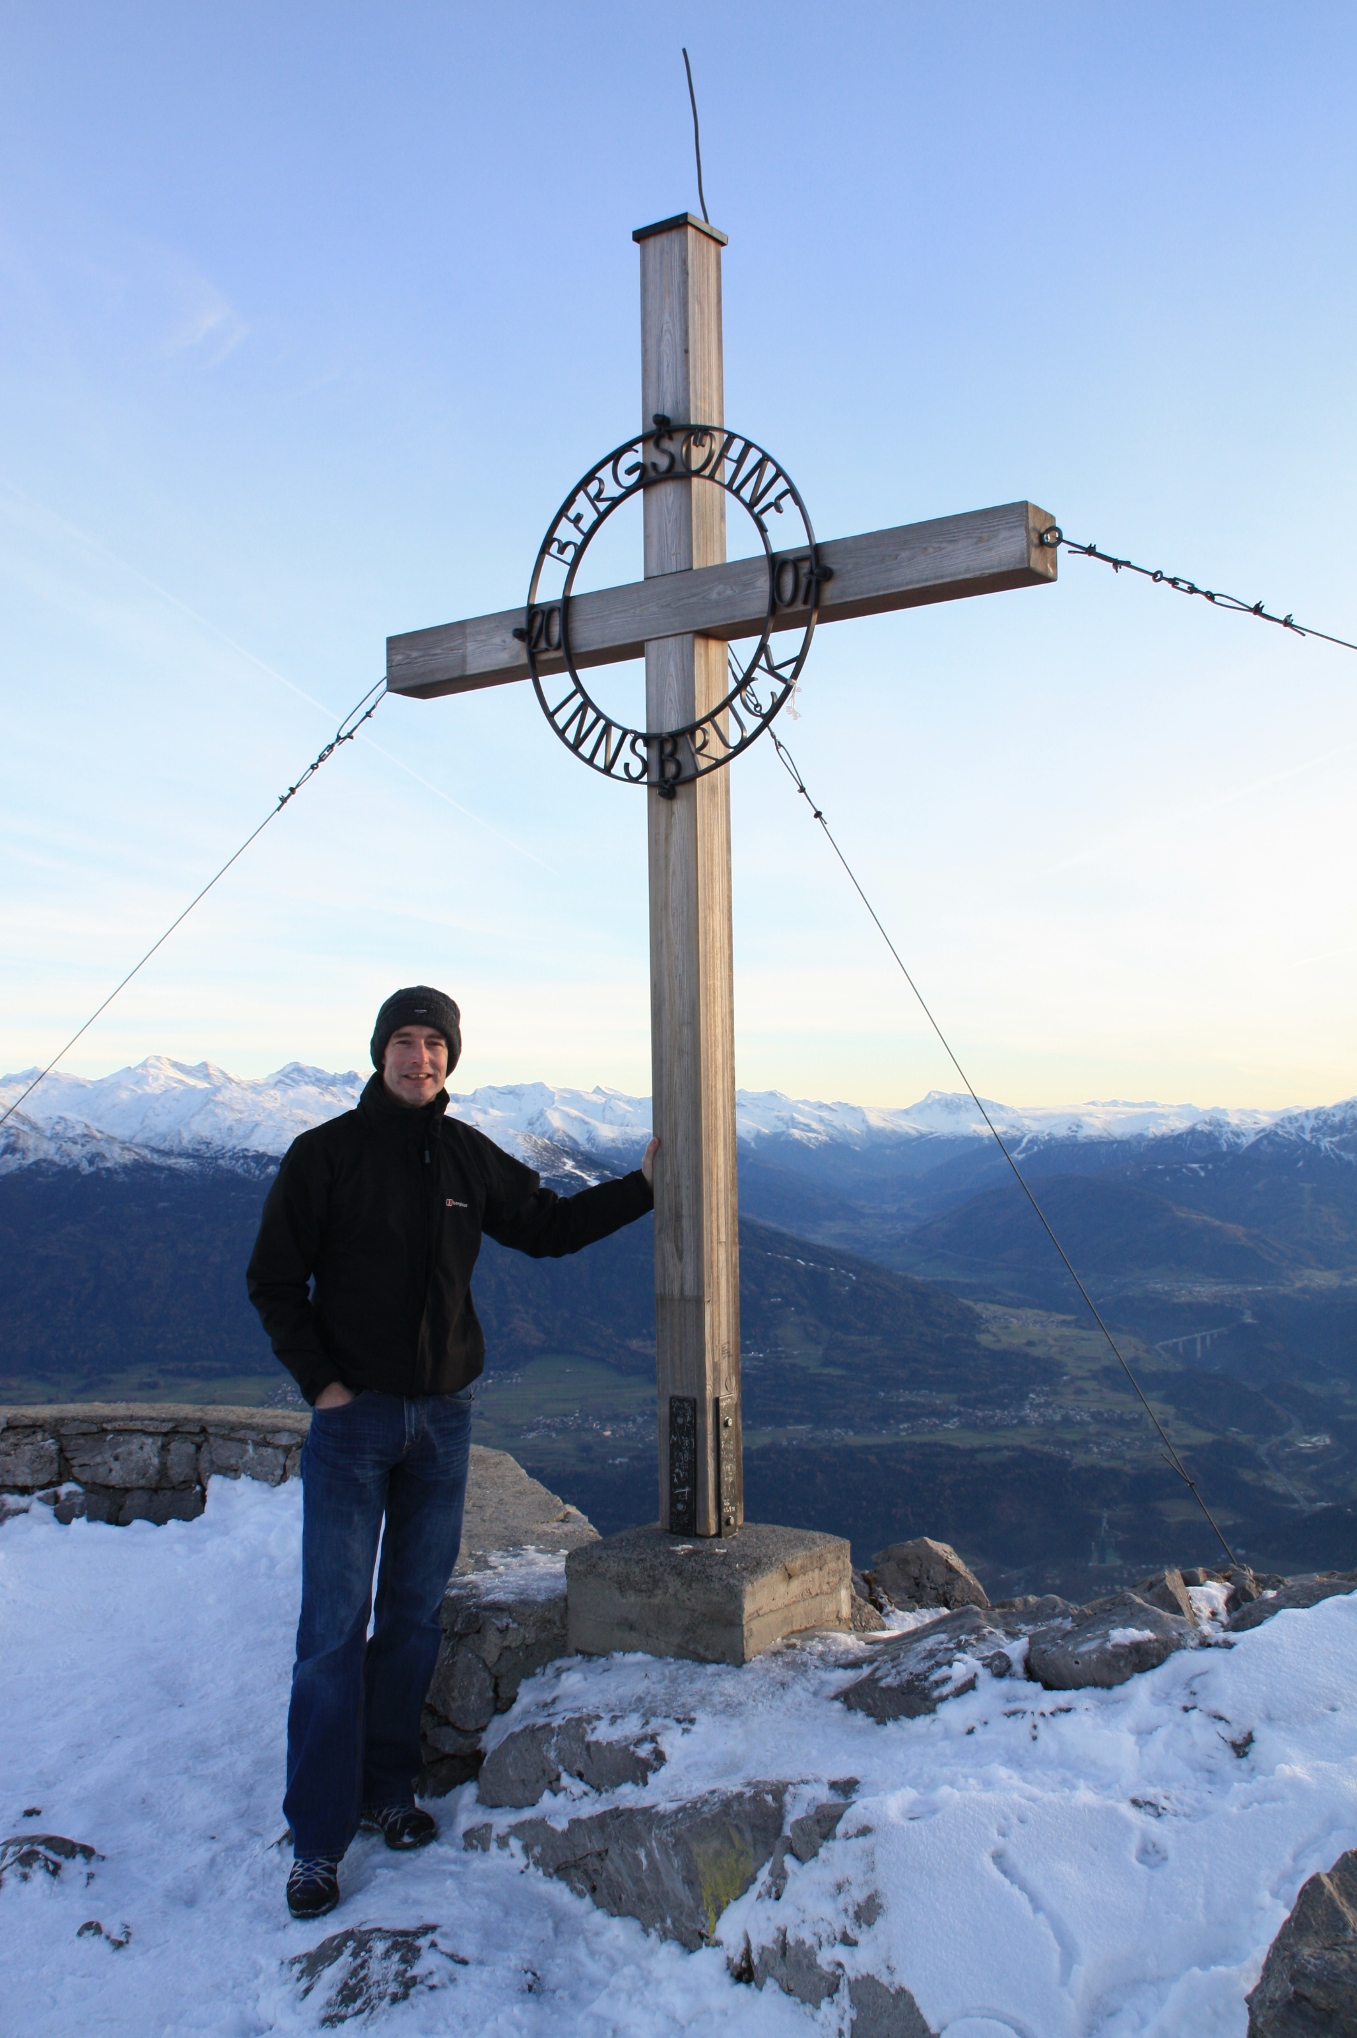
After five days of excellent discussions and collaboration, the Newcastle delegation took some time on the Saturday to see the other sights that Innsbruck had to offer before catching the sleeper train back home.
Dr Barr scales the peak (this time on the cable car instead of on foot!)
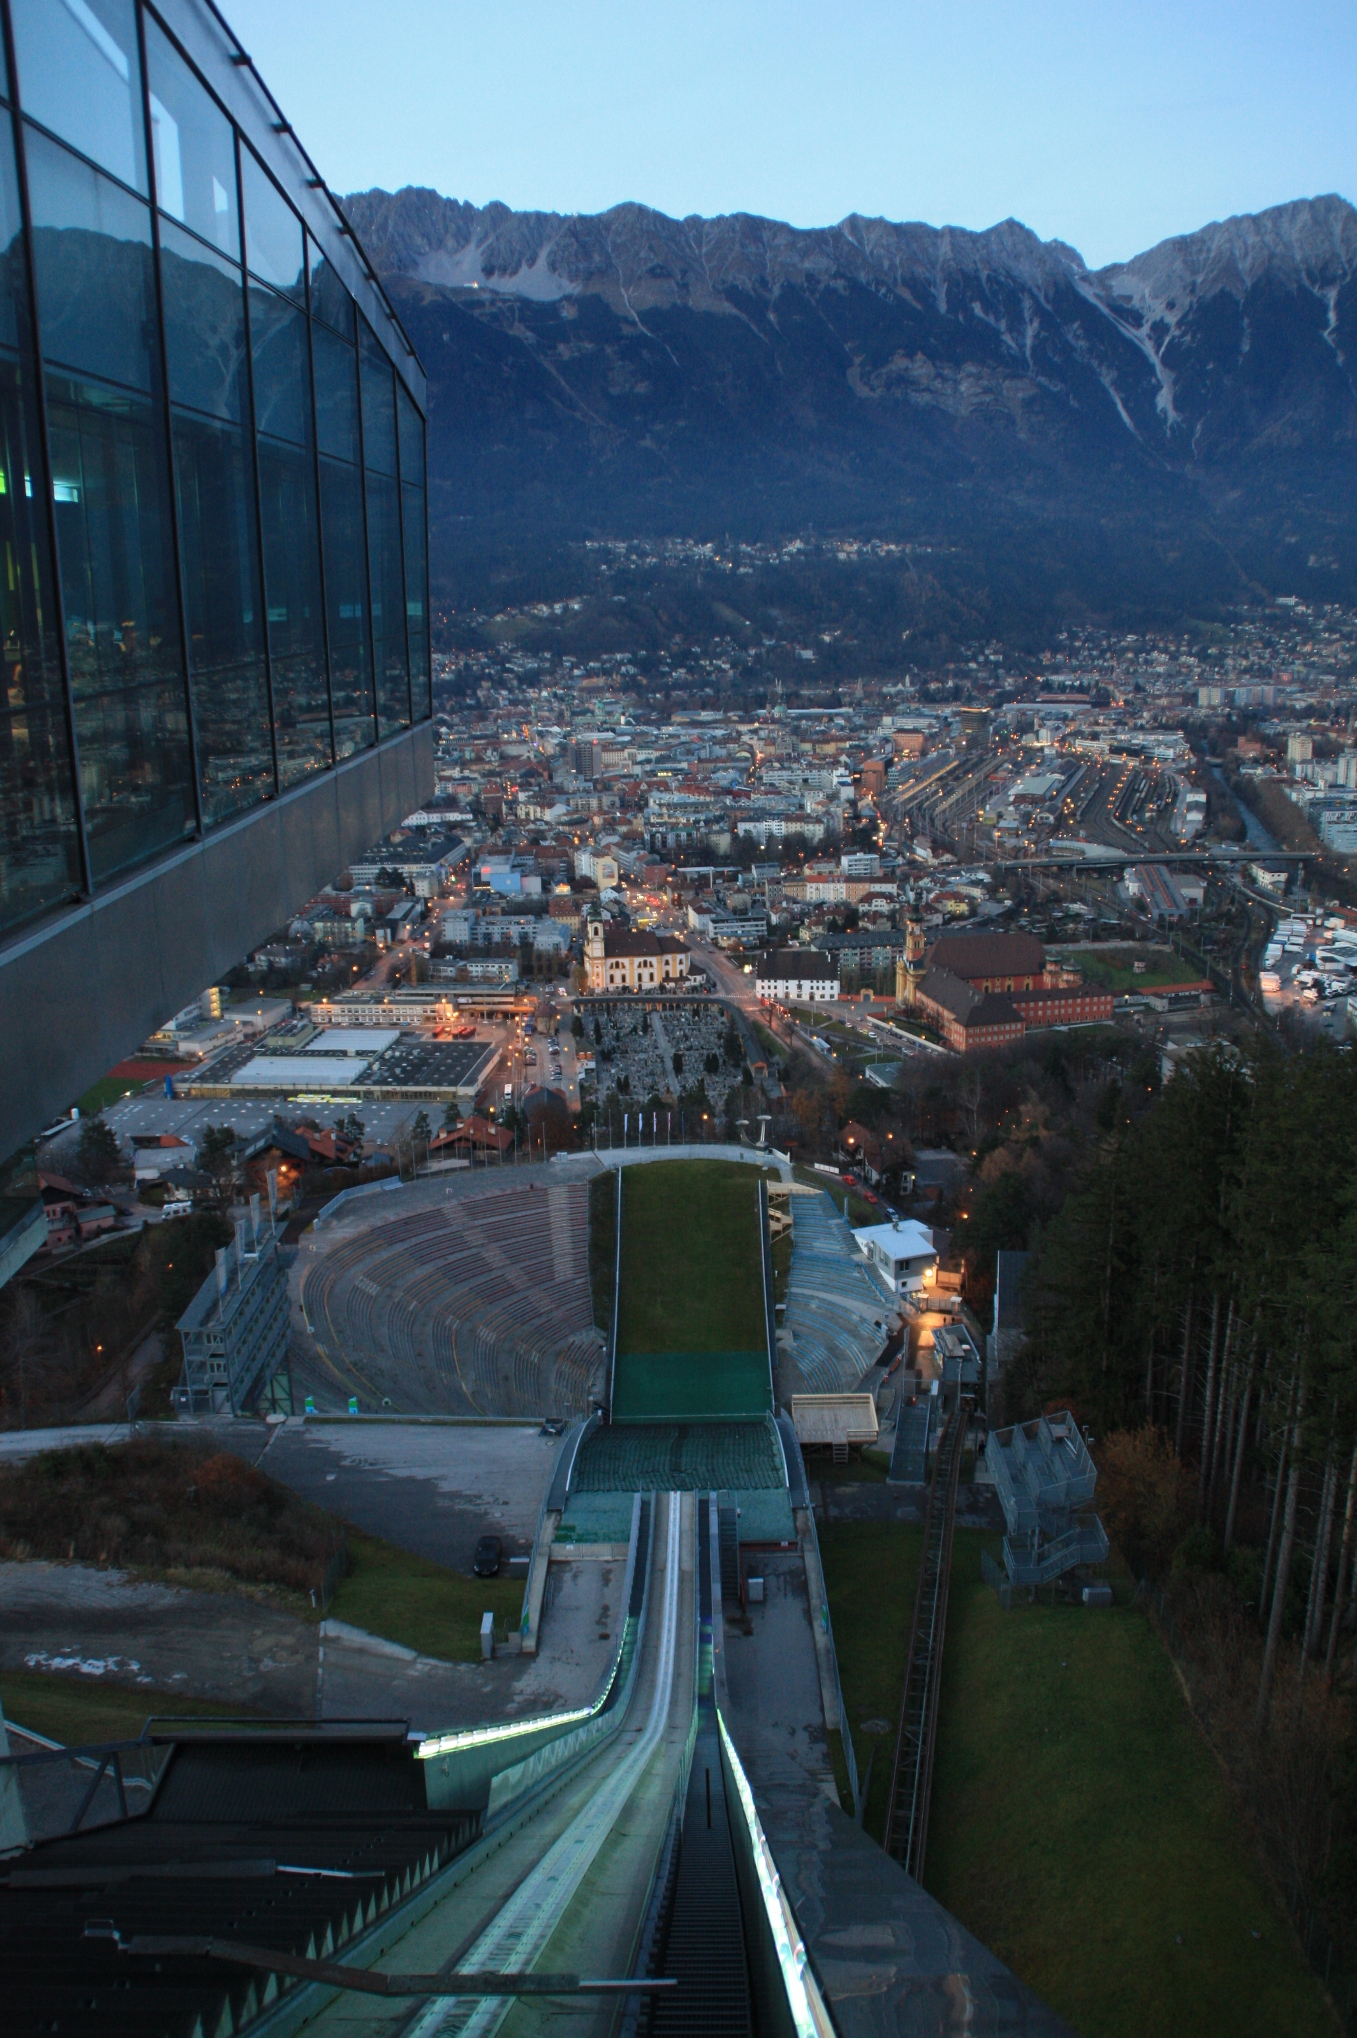
Unfortunately the snow wasn’t quite deep enough for any alpine sports, although I wouldn’t want to try this one anyway:
The view down the Bergisel ski jump, used in the 1976 Winter Olympics. Scary...
Thanks to Wolfgang and his group at Innsbruck for being such excellent hosts, and look out for news of future collaborations between the two groups.
Last week I attended a training course in Cambridge on Image Exploitation using SOCET GXP. The photogrammetric software, developed by BAE Systems, is the latest release and the successor of the SOCET SET software. As this is going to be the intended software I will be using for my 3D modelling of buildings, and with nobody in the Geospatial Engineering department having any experience with SOCET GXP (SOCET SET is currently installed on the computers), I was chosen as a representative from the University. The majority of the attendees had military backgrounds, two from the Swiss and two from the American military. There was a few from industry, including two from a 3D modelling company in London.
The four day course started with a basic introduction to the software and getting to know our way around the windows. SOCET GXP has made several alterations to SOCET SET, most significantly the interface. GXP has two main windows, the Workspace Manager and Multiports. The Workspace Manager is where all the data is managed, and the Multiport is where the data is displayed. Data is loaded from the Workspace Manager into Multiports. Previously, SOCET SET could only load two images at a time. Now with GXP, four images can be loaded, either as a singular view with the imagery in layers, similar to that of ArcGIS, or in a tiled panel. GXP has also adopted the ribbon menu approach, similar to that seen in Microsoft Word, which makes it much easier to find things compared to SET. After drawing and editing the image, various formats can be used as outputs, for example a screenshot can be exported straight into PowerPoint, shapefiles can be created in a geodatabase, and GeoPDFs can be produced.
After the first two days of familiarisation with the software, the final two days looked at the capability of data extraction, in both 2D and 3D using stereo. Tools in the toolbox are segmented into different types depending on their functionality; draw tools, mode tools (which describe how the draw tool operates) and modifier tools. Cue Cards help explain how to use the tool, making them very straightforward to use. One of the main tools in the software which may prove worthwhile in my project is the Automatic Feature Extraction tool, which can depict building outlines and trees based on a set of parameters. Having only used this tool on lidar data, it will be interesting to see what results it yields for aerial imagery. For 3D extraction, several models exist in GXP, such as planar roofs and gabled roofs. These can usually be utilised by defining a ground point and the rooftop points. Although this is an easy option for modelling, it cannot be incorporated into my work-flow due to its heavy reliant on manual interpretation of ground and roof points. The accuracy of the building is therefore dependent on the analyst.
As well as learning about the software a vast amount of ‘networking’ was undertaken over the four days.
The course has given me an insight into the new and existing capabilities of SOCET GXP and how it can potentially be utilised in my research project.
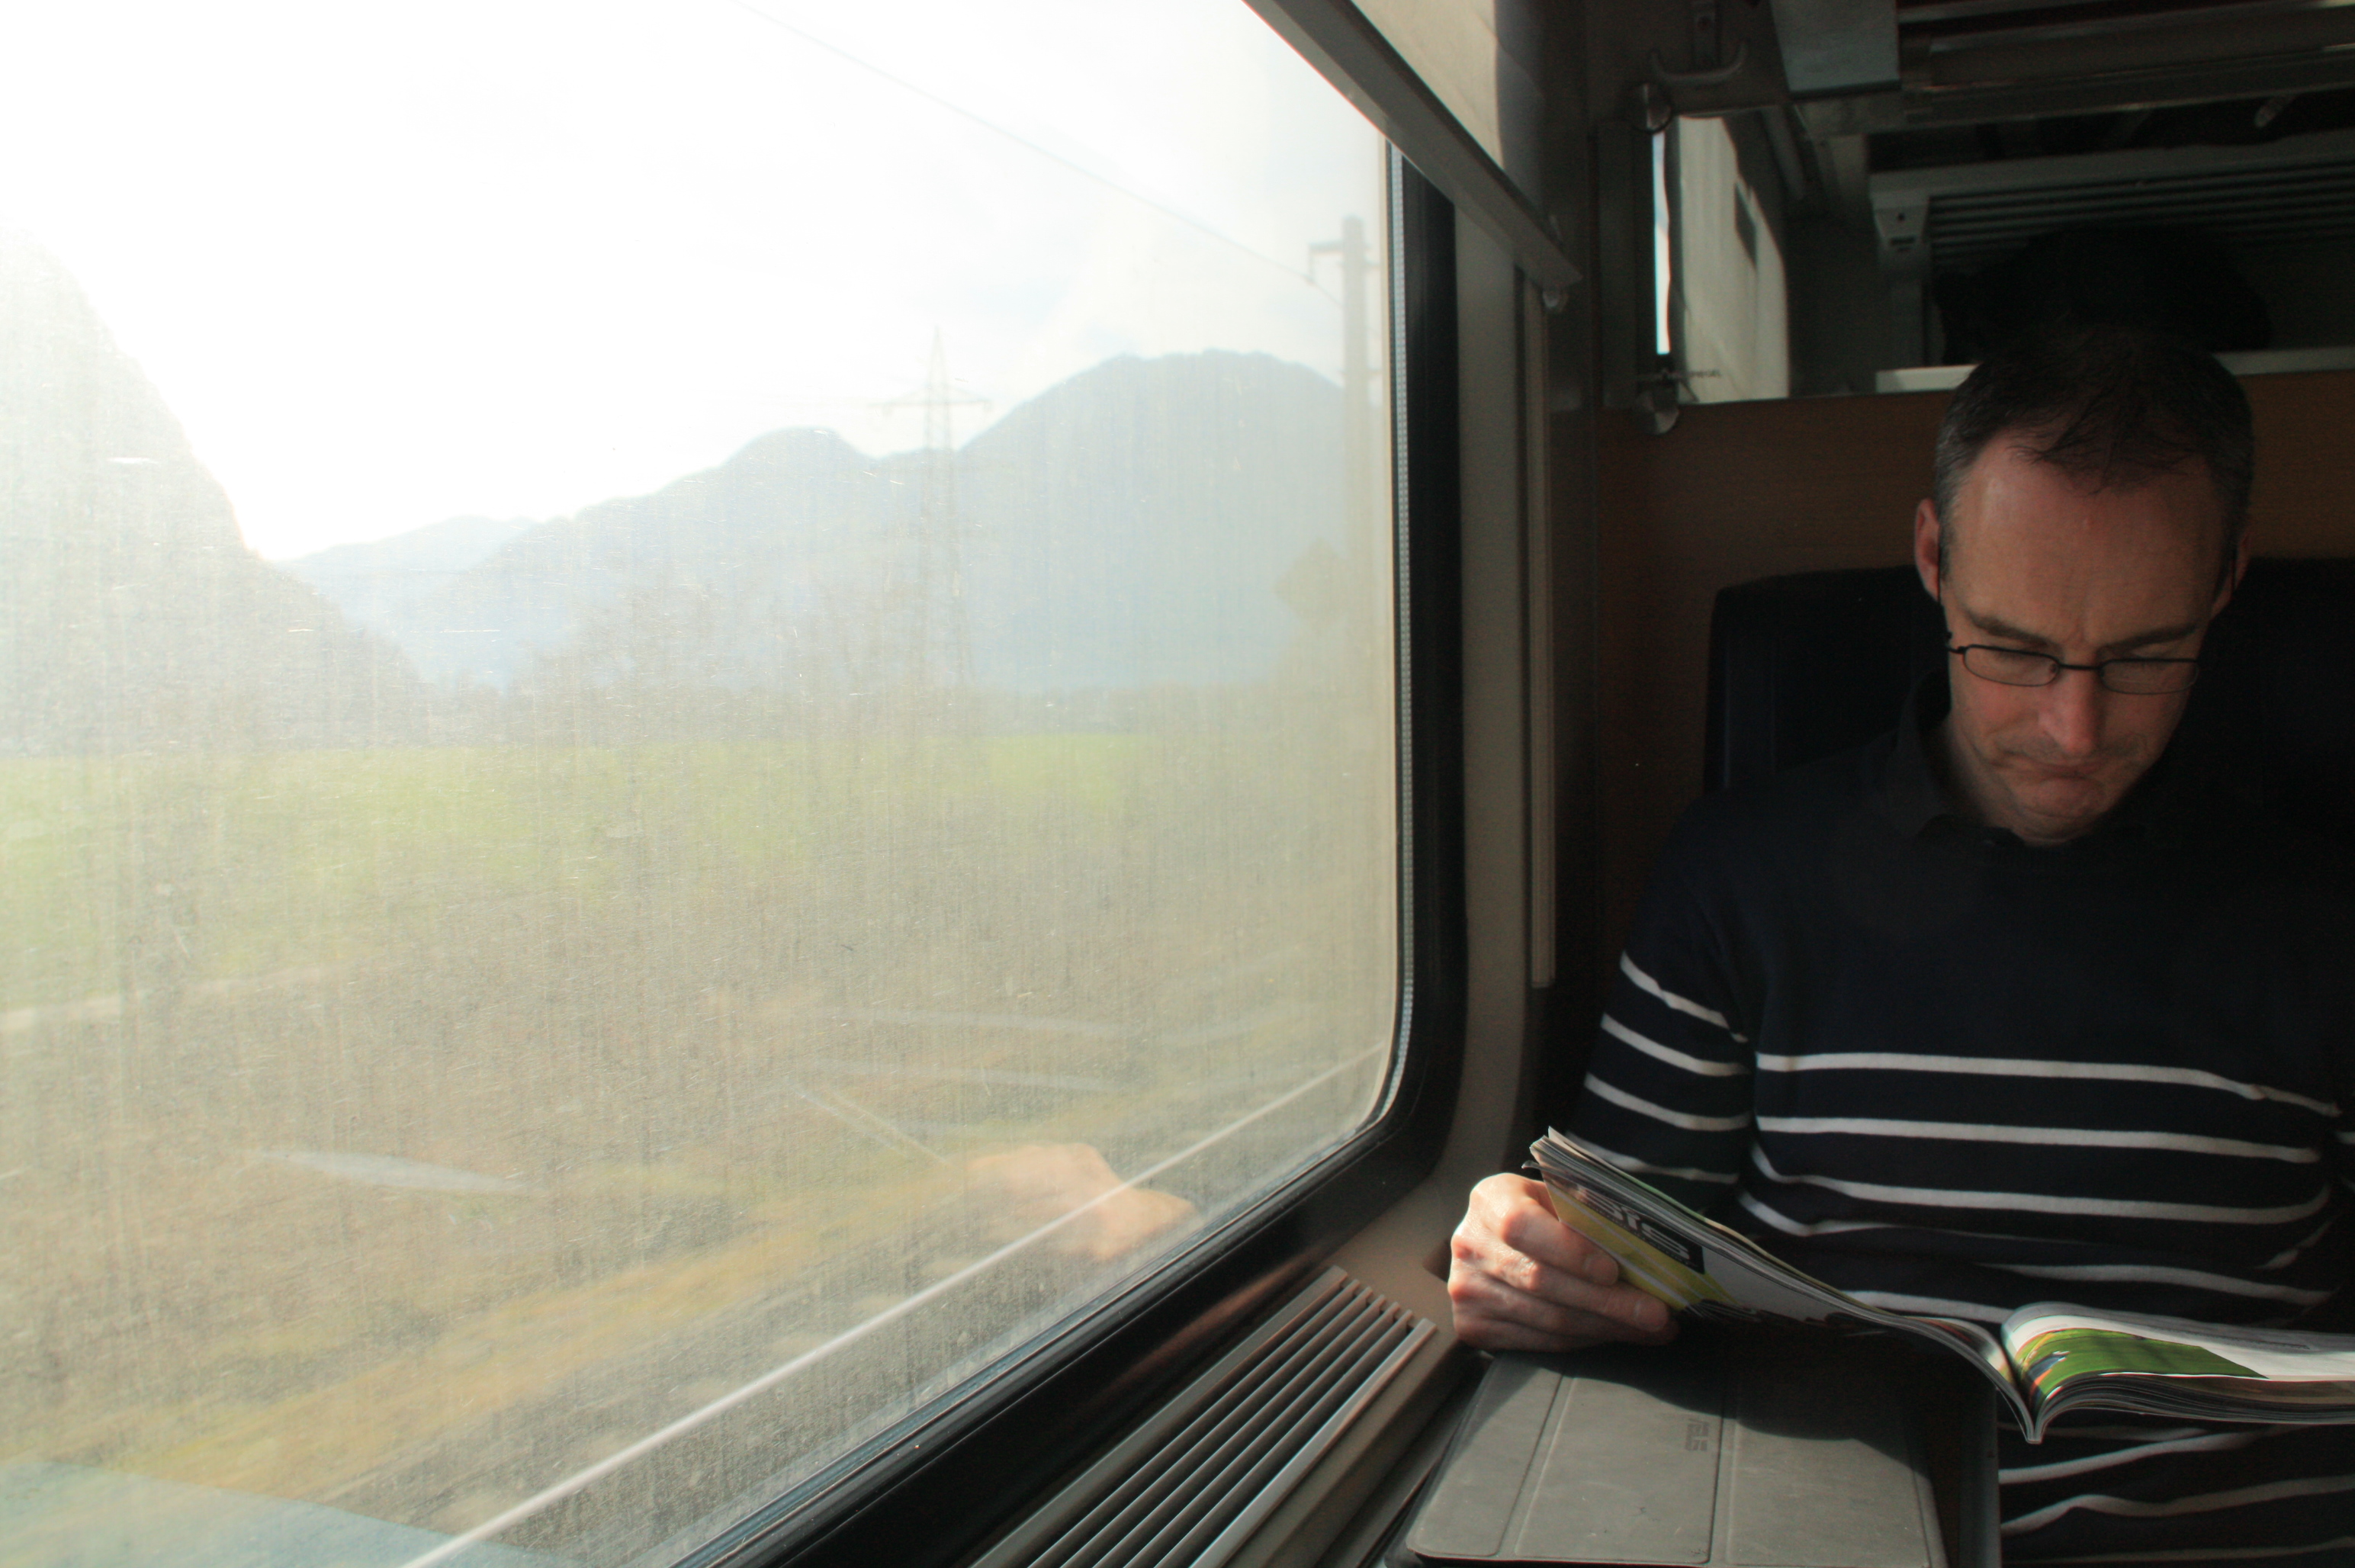
Two members of the Geospatial Engineering team (David Alderson and Craig Robson) were due to present their current infrastructure/network-related research at the recent ITRC Early Career Researcher’s conference, held at Cambridge University on November 27th 2012. As such both embarked on a journey, departing from Newcastle at 0556 on the morning of the 27th, that would end having only reached as far South as Darlington…approximately 6 hours after departing! The cause of being only able to travel a few miles in that time…a flood-related failure of the rail network leading to a loss of power to the train and line between Durham and Darlington. A set of images taken on the day of the failure illustrate the researcher’s plight.


 How will current socio-demographic evolution affect future transport patterns and traffic conditions?