ESRI UK User Conference Tuesday 17 May

This year’s ESRI Annual Conference took place once more in the QEII Conference Centre in the heart of Westminster.  It was good to meet up with several Newcastle graduates, each making their mark on the GI industry.  The major ‘take-away message’ from this year’s conference was the increasing ease by which the traditionally ‘clunky’ ArcGIS desktop can be left behind in favour of developing using ArcGIS Pro and ArcGIS Online, products with regular and frequent update cycles and increasingly comprehensive functionality.

From the perspective of ESRI, David Rix (1976 graduate) and Dominic Stubbins (1995) were amongst the welcoming corporate hosts, contributing to an efficiently-run and informative event, well worth the trip from the north!  Nathan Ward (1993) was manning the Leica stall, one of several associated partners exhibiting in the building.  Laura Hanson (2003 graduate), now with Arup, and Rachel Oldroyd (2011 graduate), now with the University of Leeds, were ex-staff members spotted, along with Meredith Williams (staff 2000-2010).

Joining Dominic from the 1995 cohort was Ian Moodie, whilst from even further even back, Rob Knight and Helen Durham (both 1985) are both thriving.  Clive Surman-Wells (1988) and Andy Hopkins (1996) made their presence known also, along with some 21st century graduates – Bruce Ford (2009), Claire Watkins (2009), Victoria Short and Matt Bowerbank (2010), Matthew Bierton (2014) and Jonathan Hallam (2015).

Next week, the re-unions will continue in London at the GeoBusiness event.  There is a formal Newcastle alumni meeting on Tuesday 24 May at 15:00 hrs.  Come along to the Business Design Centre in Islington, if you are in town …

GIS students present research projects Friday 13 May

This week saw the annual ‘Final Year Conference’, the showcase for the Stage 3 Geomatics students to present their dissertation research in a formal venue to their fellow students and to the staff and postgraduates in the School.  A total of 31 Newcastle Geomatics students delivered talks in two parallel tracks with themed session titles including ‘Built Environment’, Spatial Analysis’ and ‘Geovisualisation’.  The 12 final-year Geographic Information Science students’ topics were as follows:

Nada Alabdulwahed used an impressive range of satellite remote sensing imagery from the past 20 years to track the urban development of the city of Al Khobar in eastern Saudi Arabia.  Standard image analysis and classification techniques along with ground truthing and integration with other data on population and land reclamation allowed for accurate quantification of urban growth.

Ed Drummond-Hay researched house price changes across England and Wales, using millions of records from Land Registry, ONS and commercial sources.  His hypothesis was that house price increases in London ‘rippled’ out from the capital to affect the rest of the country after a time lag.  The dynamic and animated representation of such patterns was an important part of the output from Ed’s research.

Emmanuel Egunyu aimed to create an online website resource to promote tourism in his native Uganda.  Using OpenStreetMap data and open source technologies with PostGIS and Geoserver, he reported on the creation of a map-based information portal for those planning to visit national parks and view wildlife in this country.

Alexia Fenn’s study concentrated on the validity and reliability of observations from GPS receivers worn by athletes.  A variation of sport/athletics course shapes, course distances, and exercise/movement intensities were examined.  Walking, jogging, and sprinting over various distances and in a variety of course configurations were examined, with GPS accuracies determined for each exercise regime.

Will Franklin developed a system to estimate the safety of junctions on the road network in Newcastle.  By calculating a Junction Risk Factor, based on a number of parameters related to road conditions and traffic volumes, he was able to develop a predictive model to determine the optimum location for investment in road network improvements.

Jo Gallagher’s interest in spatially-enabled Twitter data led to a study of the geolocation of football clubs’ fan base.  He found that the ‘bigger’ the club, the more dispersed the distribution of fans – backing up the popular theory that the mean location of a Manchester United fan is some distance from Old Trafford.

Patryck Janicki’s research aimed to develop a geodatabase schema able to hold both CityGML data at Level of Detail 1 and main Industry Foundation Classes (IFC) classes.  The ability of the schema to abide by standards, allow for SQL queries, hold geometry effectively, was to be supplemented by an effective visualisation flowline through export to QGIS.  The outcomes of this project have impact on the integration of BIM with GIS.

This was also the focus of the research of Anthony Morley, who examined current technologies for importing a BIM model into a geospatial environment and assessing interoperability.  This involved using a range of software and data formats, including ArcMap, ArcScene, ESRI City Engine, REVIT, AutoCAD and FME.  The geometric and semantic integrity of the model, and the needs of users were considered.

Amber Kaye-Kenyon chose the analytical capabilities of ArcMap, ArcScene and City Engine (including Buffer, Viewshed and Line of Sight (LOS)) to look at the modelling of an urban sensor network.  In the context of the instrumented city concepts being developed in Newcastle upon Tyne, particularly around the university’s new Science Central campus, ease of use, visualisation and effective monitoring of the sensor network were derived.

Ben Nicholls undertook a very detailed study of some of the rich cartographic generalisation tools in ArcGIS.  Applying these to different types of feature (railways, contours, buildings etc. as represented on large scale Ordnance Survey data), and in different locations (e.g. central urban zones, rural regions), Ben presented an impressive assessment of the data pre-processing, algorithm effectiveness and presentation quality of such procedures.

Josh Watson’s theme was a big data set dealing with cardiac arrests outside hospital.  The spatial and temporal distribution of these events was determined, as a precursor to understanding the nature of the phenomenon and to try to raise low survival rates in the North East.  Clusters of cases were apparent and these were linked to population distribution, to ambulance stations and response times, and to times of day, season and year.

Imogen Weight made a comparative study of several web mapping APIs, assessing data needs, scope of functionality, usability, and final appearance of maps created in Leaflet, Mapbox, and the dedicated Javascript APIs for Google Maps and for ArcGIS.

The remaining students (Surveying and Mapping Science students) pursued research topics in a wide range of other spatial themes, many of which have a GIS ‘flavour’.  Environmental monitoring of coasts, glaciers, urban heat, and floods used GIS tools, as did further investigations of BIM, and further social investigations of education from a GI perspective.

New paper: Reducing the impact of extreme weather on infrastructure networks

Last week our latest paper was published entitled ‘Assessing urban strategies for reducing the impacts of extreme weather on infrastructure networks’ in the Royal Socities Open Science journal. Alistair Ford, Craig Robson and Stuart Barr all contributed to the artical alongside colleagues from civil engineering, Maria Pregnolato (lead authour), Vassilis Glenis and Richard Dawson. A summary is given below.

“A framework for assessing the disruption from flood events to transport systems is presented that couples a high-resolution urban flood model with transport modelling and network analytics to assess the impacts of extreme rainfall events, and to quantify the resilience value of different adaptation options. A case study in Newcastle upon Tyne in the UK is presented and shows that both green roof infrastructure and traditional engineering interventions such as culverts or flood walls can reduce transport disruption from flooding.The magnitude of these benefits depends on the flood event and adaptation strategy, but for the scenarios considered here 3–22% improvements in city-wide travel times are achieved.

Both options should form part of an urban flood risk management strategy, but this method can be used to optimize investment and target limited resources at critical locations, enabling green infrastructure strategies to be gradually implemented over the longer term to provide city-wide benefits. This framework provides a means of prioritizing limited financial resources to improve resilience. By capturing the value to the transport network from flood management interventions, it is possible to create new business models that provide benefits to, and enhance the resilience of, both transport and flood risk management infrastructures.”

Championship Away Fans

The volume of a teams away following is often used as measure for the “size” of a club and is heavily debated amongst football fans. But their are many factors that influence this, not least their proximity to other clubs.

13096253_10156800676615123_3874620268719268683_n
Hartlepool Away Fans making 400-mile trip to Plymouth away to watch their side lose 5-0

With the Football league last week releasing statistics showing the average away attendance for each team playing in the championship (shown below), I looked at whether this was effected by the clubs accessibility to other clubs and how long fans were spending travelling.

Team Away Attendance
Leeds 2807
Middlesbrough 2515
Sheffield Wednesday 2510
Derby 2125
Burnley 1911
Birmingham 1779
Brighton 1658
Preston 1506
Wolves 1470
Nottingham Forest 1443
Hull 1393
Ipswich 1383
Bristol City 1263
QPR 1204
Huddersfield 1128
Blackburn 1106
Brentford 1073
Rotherham 1041
Reading 1040
Fulham 988
Bolton 911
Cardiff 748
Charlton 637
MK Dons 636

With Leeds being located in within fairly close proximity to a number of the northern teams, and Leeds railway station being well connected I wanted to look at the whether this contributed to their loyal away following.

Screenshot_2016-05-16_09-56-56

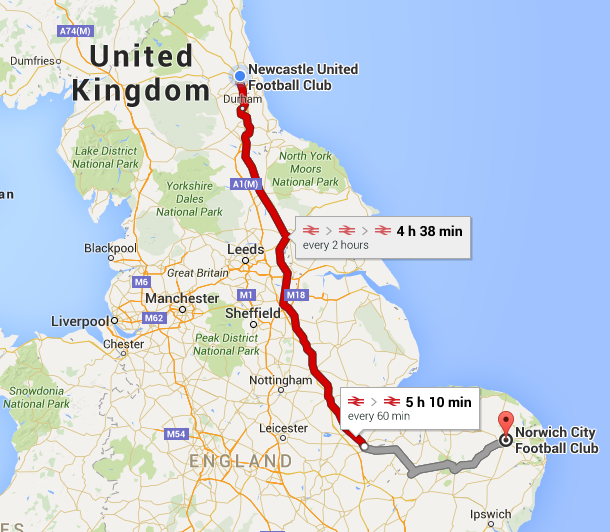
So I used the Google Travel API to look at the total time a football fan would spend travelling if they went on public transport to every away game. The results are below.

Team Time Spent Travelling
Cardiff City 6 Days 3 Hours 44 Minutes 14 Seconds
Brighton and Hove Albion 6 Days 1 Hours 23 Minutes 36 Seconds
Ipswich Town 5 Days 23 Hours 17 Minutes 34 Seconds
Middlesbrough 5 Days 21 Hours 25 Minutes 26 Seconds
Charlton Athletic 5 Days 11 Hours 18 Minutes 10 Seconds
Bristol City 5 Days 10 Hours 22 Minutes 50 Seconds
Hull City 5 Days 2 Hours 57 Minutes 20 Seconds
Fulham 4 Days 22 Hours 6 Minutes 38 Seconds
Burnley 4 Days 20 Hours 5 Minutes 32 Seconds
Reading 4 Days 19 Hours 58 Minutes 32 Seconds
Preston North End 4 Days 19 Hours 52 Minutes 22 Seconds
Queens Park Rangers 4 Days 18 Hours 44 Minutes 38 Seconds
Brentford 4 Days 18 Hours 13 Minutes 12 Seconds
Blackburn Rovers 4 Days 17 Hours 38 Minutes 16 Seconds
Huddersfield Town 4 Days 11 Hours 55 Minutes 58 Seconds
Bolton Wanderers 4 Days 11 Hours 17 Minutes 36 Seconds
Leeds United 4 Days 7 Hours 2 Minutes 12 Seconds
MK Dons 4 Days 5 Hours 1 Minutes 4 Seconds
Sheffield Wednesday 4 Days 4 Hours 30 Minutes 54 Seconds
Wolverhampton Wanderers 4 Days 0 Hours 30 Minutes 48 Seconds
Rotherham United 3 Days 23 Hours 23 Minutes 6 Seconds
Birmingham City 3 Days 19 Hours 59 Minutes 4 Seconds
Nottingham Forest 3 Days 18 Hours 12 Minutes 6 Seconds
Derby County 3 Days 17 Hours 41 Minutes 6 Seconds

Screenshot_2016-05-16_09-46-08

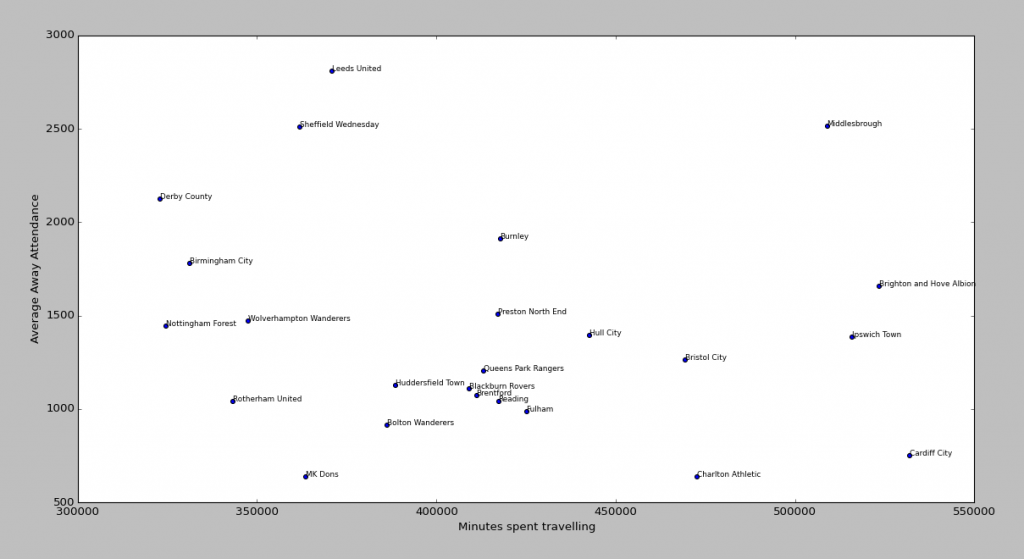
From this it appears that there is very little correlation between the average away attendance and time spent travelling especially with Middlesbrough’s travel time and attendance being so high.

As a final thought I looked at using the travel times for ranking the teams be the number of “fan hours” spent travelling.

Team Fan Hours
Middlesbrough 40 Years 31 Weeks 3 Days 1 Hours 4 Minutes 50 Seconds
Leeds United 33 Years 0 Weeks 5 Days 23 Hours 55 Minutes 24 Seconds
Sheffield Wednesday 28 Years 41 Weeks 5 Days 4 Hours 39 Minutes 0 Seconds
Brighton and Hove Albion 27 Years 27 Weeks 0 Days 6 Hours 8 Minutes 48 Seconds
Burnley 25 Years 16 Weeks 6 Days 20 Hours 14 Minutes 12 Seconds
Ipswich Town 22 Years 32 Weeks 3 Days 5 Hours 54 Minutes 42 Seconds
Derby County 21 Years 39 Weeks 2 Days 20 Hours 37 Minutes 30 Seconds
Preston North End 19 Years 48 Weeks 0 Days 0 Hours 24 Minutes 12 Seconds
Hull City 19 Years 28 Weeks 5 Days 13 Hours 5 Minutes 20 Seconds
Bristol City 18 Years 41 Weeks 4 Days 6 Hours 38 Minutes 30 Seconds
Birmingham City 18 Years 35 Weeks 3 Days 8 Hours 19 Minutes 36 Seconds
Wolverhampton Wanderers 16 Years 10 Weeks 1 Days 10 Hours 36 Minutes 0 Seconds
Queens Park Rangers 15 Years 40 Weeks 1 Days 7 Hours 38 Minutes 32 Seconds
Nottingham Forest 14 Years 44 Weeks 5 Days 9 Hours 0 Minutes 18 Seconds
Blackburn Rovers 14 Years 18 Weeks 0 Days 19 Hours 22 Minutes 56 Seconds
Brentford 13 Years 51 Weeks 4 Days 14 Hours 3 Minutes 36 Seconds
Huddersfield Town 13 Years 46 Weeks 5 Days 20 Hours 10 Minutes 24 Seconds
Reading 13 Years 40 Weeks 0 Days 14 Hours 34 Minutes 40 Seconds
Fulham 13 Years 16 Weeks 5 Days 5 Hours 13 Minutes 44 Seconds
Cardiff City 12 Years 32 Weeks 0 Days 11 Hours 26 Minutes 32 Seconds
Rotherham United 11 Years 17 Weeks 3 Days 7 Hours 47 Minutes 6 Seconds
Bolton Wanderers 11 Years 8 Weeks 1 Days 16 Hours 13 Minutes 36 Seconds
Charlton Athletic 9 Years 28 Weeks 3 Days 23 Hours 52 Minutes 10 Seconds
MK Dons 7 Years 17 Weeks 2 Days 23 Hours 18 Minutes 24 Seconds

Where is Newcastle?

Following on from an early email exchange about how Google defined “Newcastle” it got me thinking about other providers and how they define the city. Twitter for instance provides a bounding box the centre of which is the middle of Nun’s Moor (as does Google but the point location is not the centroid of it). As you can see from the image there is wide variation. Note that a couple (Yahoo/Michelin) place the point location at the point roughly where the centre of the text “Newcastle upon Tyne” appears on certain map products.

The mean centre of the point locations excluding the centroids is shown as well.

Newcastle maps

So I visited a pile of map sites and extracted their default location (and/or bounding box) and plotted them on the map. For twitter I sent a tweet from “Newcastle upon Tyne” and captured the coordinates using the API. Just to be rigorous I installed TOR browser which obfuscates the IP address to ensure that location was not being picked up from the browser and tried different browsers as well. The OS point for Newcastle upon Tyne was collected from the Gazetteer service provided through Digimap.

The vaguely serious point here is that we now routinely use APIs to get data from and its location yet those locations provide spurious precision!

Football Travel Times


Following our blog post looking at the distances of football grounds from their nearest railway station, we had a think about other interesting football-related analysis that we could do. Having previously been a holder of an away season ticket, I thought that one interesting comparison might be to investigate which football fans would spend the longest on public transport to visit away games.

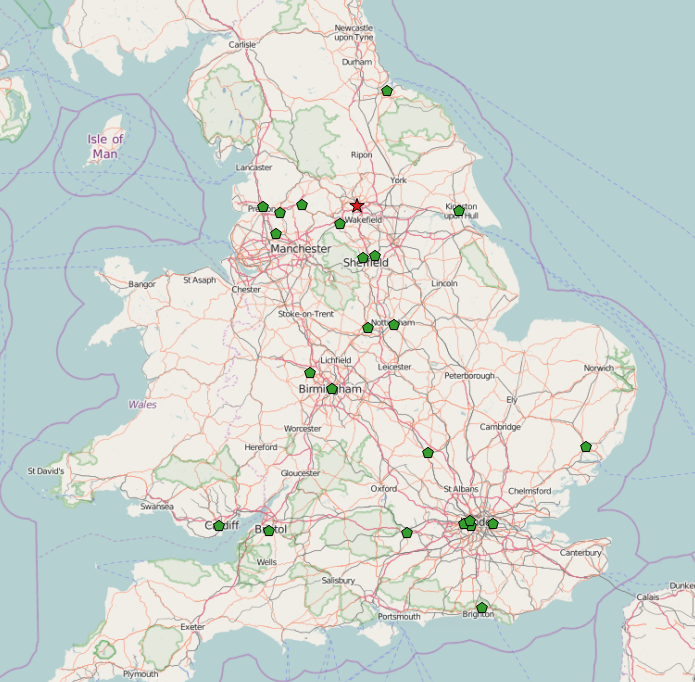
In order to do this analysis we used the Google Maps Distance Matrix API (https://developers.google.com/maps/documentation/distance-matrix/ ) to calculate the time and distance you would have to travel on public transport between each football club, to arrive at 2pm on a Saturday. The locations of the football grounds were used as the start and end points for each journey since we obviously don’t know where supporters actually live!

google_travel_map

Below is a list of the 5 longest away trips between any pair of Football League or Premier League clubs. You could look at this as the nightmare FA Cup draw if you’re committed to going to the game, and the ones you really don’t want to be switched to a Friday night for TV coverage.


team1 team2 duration length
Plymouth Argyle Newcastle United 6 hours 39 mins 657.287Km
Plymouth Argyle Sunderland 6 hours 29 mins 647.920Km
Torquay United Newcastle United 6 hours 22 mins 620.825Km
Plymouth Argyle Hartlepool United 6 hours 13 mins 622.370Km
Carlisle United Plymouth Argyle 6 hours 13 mins 626.729Km

The 5 quickest are below – some of these would likely be quicker to walk!

team1 team2 duration length
Notts County Nottingham Forest 3 mins 1.126Km
Liverpool Everton 4 mins 1.654Km
Fulham Chelsea 11 mins 3.138Km
Walsall West Bromwich Albion 11 mins 9.997Km
Birmingham City Aston Villa 11 mins 5.831Km

In summary, you really don’t want to draw Plymouth away…

Settling a Coffee Break Debate – Football Travel Distance

NEW BLOG POST CORRECTING ERRORS HERE 

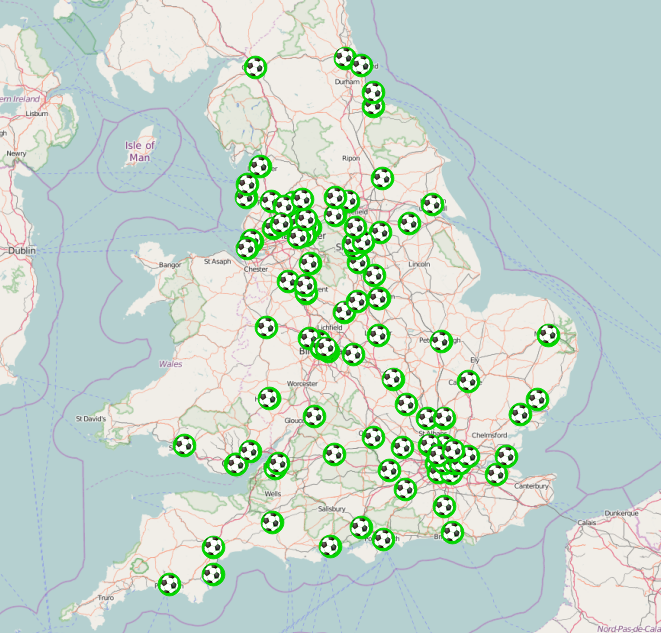
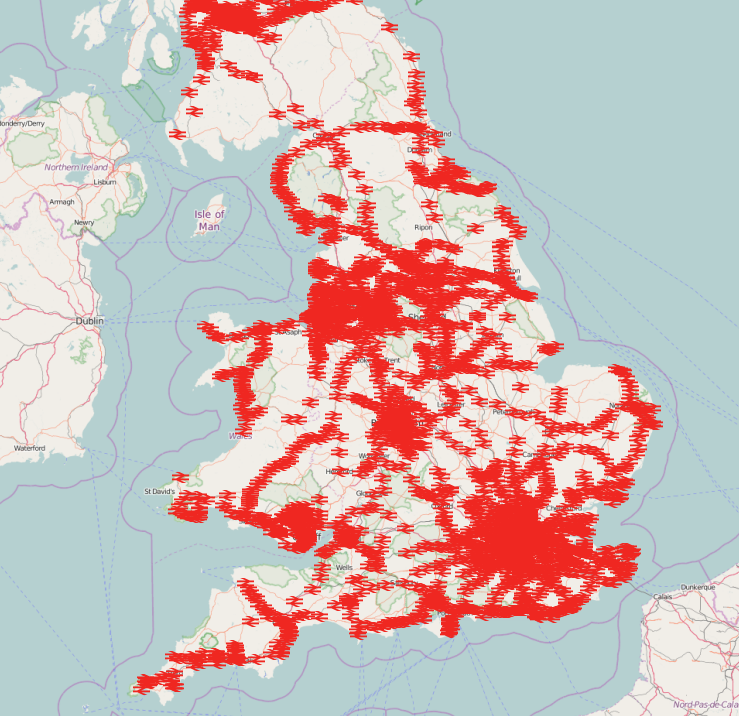
As I imagine happens at many work places the coffee break for the Geospatial group often brings up some lively debates. Whilst today’s debate itself wasn’t exactly lively it did pose an interesting question. Which football ground is the further away from a mainline railway station? The answer put out there Hillsborough. Not content with this guesswork I ran a simple piece of analysis. Luckily we have the football grounds from the work we carries out with the football tweets (previous blog & site) and the the railway stations from work carried out for ITRC (http://www.itrc.org.uk/).

Football League Stadia


Screenshot_2016-04-04_12-44-09
GB Railway Stations

Therefore all i had to do was look at the nearest railway station to each ground and calculate the distance between them. I did this by loading both datasets into PostgreSQL + PostGIS and performing a few simple queries.  The results are below: Whilst Hillsborough wasn’t the furthest it wasn’t far off.

Ideally we’d look at the distance along the UK road network and not straight line distance. But this seems somewhat overkill for answering this question.

Neil


Football Club Stadium Name Railway Station Distance (m)
Fleetwood Town Highbury Stadium Poulton-le-Fylde 7908.11125559371
Bury Gigg Lane Clifton 6660.52530406908
Sheffield Wednesday Hillsborough Sheffield 4531.43899643992
Yeovil Town Huish Park Yeovil Pen Mill 4305.2978740895
Oxford United Kassam Stadium Radley 4089.74370918289
Coventry City Ricoh Arena Bedworth 3965.19467363248
Wycombe Wanderers Adams Park High Wycombe 3796.07635929164
Reading Madjeski Stadium Reading West 3669.95693983928
Cheltenham Town Whaddon Road Cheltenham Spa 2983.6953569951
Dagenham and Redbridge Victoria Road Dagenham Dock 2598.82359490238
Colchester United Weston Homes Community Stadium Colchester 2573.12612621598
Scunthorpe United Glanford Park Althorpe 2568.65402852626
Shrewsbury Town New Meadow Shrewsbury 2532.86554400019
Cambridge United Abbey Stadium Cambridge 2371.65580933094
Preston North End Deepdale Preston 2220.26792889295
Doncaster Rovers Keepmoat Stadium Doncaster 2207.80263428059
Stoke City Britannia Stadium Stoke-on-Trent 2201.7962708601
Rochdale Spotland Stadium Rochdale 2098.43404250318
Burton Albion Pirelli Stadium Burton-on-Trent 2091.47360872247
Queens Park Rangers Loftus Road Kensington Olympia 2050.97406409029
Bristol Rovers Memorial Stadium Montpelier 2015.77067665531
Swansea City Liberty Stadium Swansea 1980.92022136336
West Ham Boleyn Ground Woodgrange Park 1929.54896518672
Macclesfield Town Moss Rose Macclesfield 1901.57512833285
Chesterfield B2net Stadium Chesterfield 1856.0814157692
Port Vale Vale Park Longport 1840.42432657788
Northampton Town Sixfields Stadium Northampton 1821.98141599042
Oldham Athletic Boundary Park Oldham Werneth 1808.16787682106
Liverpool Anfield Kirkdale 1738.52974959448
Leicester City King Power Stadium Leicester 1725.57185592057
Manchester United Old Trafford Trafford Park 1671.87218748047
Torquay United Plainmoor Torre 1667.13531194068
Stevenage Borough The Lamex Stadium Stevenage 1595.47056887281
Fulham Craven Cottage Putney 1586.58592171703
MK Dons Stadiummk Fenny Stratford 1555.74401416301
Crawley Town Broadfield Stadium Crawley 1483.25999132287
Tranmere Rovers Prenton Park Rock Ferry 1461.01057568374
Leeds United Elland Road Cottingley 1460.72706001557
York City Bootham Crescent York 1424.83761465897
Carlisle United Brunton Park Carlisle 1400.33683628771
Accrington Stanley Crown Ground Accrington 1386.80058458418
Hull City KC Stadium Hull 1372.8238336756
Wigan Athletic DW Stadium Wigan Wallgate 1354.71103755325
Barnet Underhill Stadium New Barnet 1331.81735155781
Peterborough United London Road Peterborough 1291.81586333005
Manchester City Etihad Stadium Ashburys 1283.26185362597
Southampton St Mary’s Stadium Woolston 1242.27676803219
Plymouth Argyle Home Park Plymouth 1241.72387816119
Huddersfield Town The Galpharm Stadium Huddersfield 1223.89758310361
Luton Town Kenilworth Road Luton 1207.43855797424
Nottingham Forest The City Ground Nottingham 1190.56463654538
Bristol City Ashton Gate Parson Street 1118.57856017793
Blackburn Rovers Ewood Park Mill Hill (Lancashire) 1118.44597418967
Leyton Orient Brisbane Road Leyton Midland Road 1110.75176145117
Morecambe Globe Arena Bare Lane 1104.26121401745
Burnley Turf Moor Burnley Central 1099.33701322422
Sunderland Stadium of Light Sunderland 1055.4979571639
Sheffield United Bramall Lane Sheffield 1049.19338825299
Swindon Town The County Ground Swindon 1046.99266525118
Middlesbrough Riverside Middlesbrough 1039.53610939064
Derby County Pride Park Derby 1036.0030157922
Everton Goodison Park Kirkdale 1023.2951415739
Bournemouth Seward Stadium Pokesdown 948.719417631076
Bradford City Valley Parade Bradford Forster Square 887.461708978663
Newcastle United St James Park Newcastle 882.06576774756
Notts County Meadow Lane Nottingham 774.620214342908
Wolverhampton Wanderers Molineux Wolverhampton 765.334742248787
Birmingham City St Andrews Bordesley 739.514349756714
Gillingham Priestfield Stadium Gillingham (Kent) 739.141518305716
Portsmouth Fratton Park Fratton 723.641439892184
Watford Vicarage Road Watford High Street 723.345746538908
Newport County Rodney Parade Newport (South Wales) 698.880470762071
Blackpool Bloomfield Road Blackpool South 697.435988426917
Barnsley Oakwell Barnsley 682.917115524344
Crystal Palace Selhurst Park Selhurst 677.760455528003
AFC Wimbledon, Kingstonian Kingsmeadow Berrylands 674.163052791649
Chelsea Stamford Bridge West Brompton 669.65763374968
Southend United Roots Hall Prittlewell 648.744802036577
Hereford United Edgar Street Hereford 641.878247423655
Mansfield Town Field Mill Mansfield 519.745391130574
Brighton and Hove Albion Amex Stadium Falmer 508.088645989644
Norwich City Carrow Road Norwich 502.075507307756
Brentford Griffin Park Brentford 469.248811545038
Ipswich Town Portman Road Ipswich 449.735676979146
Cardiff City Cardiff City Stadium Ninian Park 446.968827575298
England Wembley Wembley Stadium 444.804879003609
Wales Millennium Stadium Cardiff Central 435.803806645578
Hartlepool United Victoria Park Hartlepool 427.446542975968
Aldershot Town Recreation Ground Aldershot 427.090743110385
Rotherham United New York Stadiumn Rotherham Central 423.627007354715
Charlton Athletic The Valley Charlton 417.116709260371
Tottenham Hotspur White Hart Lane White Hart Lane 409.064526485295
West Bromwich Albion The Hawthorns The Hawthorns 394.729198538797
Bolton Wanderers Macron Stadium Horwich Parkway 385.009392892004
Aston Villa Villa Park Witton 337.23715256677
Millwall The Den South Bermondsey 331.809250300019
Walsall Bescot Stadium Bescot Stadium 304.080986833392
Arsenal Emirates Stadium Drayton Park 301.141025758736
Crewe Alexandra Gresty Road Crewe 248.015731120882
Exeter City St James Park, Exeter St James’ Park 140.15324879625

ITRC book published

Last week a book, ‘The Future of National Infrastructure: A Systems-of-Systems Approach’, by reasearchers from the ITRC (Infrastructure Transitions Research Consortium), was released and made available for purchase. The book provides insights into a range of the work undertaken in the ITRC project, from the economic and demographic projections to 2100 for the UK, to the analysis performed with developed national scale models for critical infrastructure systems and the developed underlying database and visualisation tools used. Synopsis:

“The future of national infrastructure: A system-of-systems approach provides practitioners, decision-makers, and academics with the concepts, models and tools needed to identify and test robust, sustainable, and resilient strategies for the provision of national-scale infrastructure. It takes a “system-of-systems” view on the interconnected infrastructure networks – including transport, telecommunications, energy, water, and waste-management – and derives an integrated vision on infrastructure provision required to ensure that nations have an infrastructure system that is fit for the future.”

Our own Stuart Barr, David Alderson and Craig Robson have all been involved in the research behind the book which has been carried out over the past five years, with a single chapter devoted to the work where their time has been focused, though they have also contributed to much of the other work. The chapter, ‘Database, simulation modelling and visualisation for national infrastructure assessment’, documents the tools developed here at Newcastle; the underlying database for the infrastructure models including developed schema’s as well as the visualisation and reporting tools for both the data used for the modelling and for the results from the simulation work and subsequent analysis. This research has involved the development of a national infrastructure database containing a suite of data for many of the critical infrastructures in the UK along with the associated data such as economic and demographic modelling outputs for demand modelling as well as hazard data for modelling the resilience of the infrastructure networks/systems. Along with this, a schema and associated functions for the simulation and modelling of national infrastructures has been developed as well as a PostgreSQL/postgis schema for networks and the wrappers for integration into the python package NetworkX. On top of these, a suite of web based visualisation tools have been developed with facilities to view and interrogate the results from the infrastructure modelling and simulation, tools to view the underlying demographic data, one of the main drivers for the modelling. More details of these outputs are available in the book, and further publications in the form of journal articles are in preparation.

Field work in Iraq

As part of Mustafa Hameed’s PhD research, he spent some time doing fieldwork in communities in his native Iraq. The research is assessing the role of VGI (volunteered geographic information) input in re-building the Iraqi cadastral system after years of chaos. The work done in the town of Al-Hilla (south of Baghdad) during December 2015 and January 2016 concentrated on several aspects: firstly, interviews with land administration professionals yielded an assessment of the current land administration system and opinions regarding the role of VGI; secondly, sample attribute data pertaining to land parcels was collected from professionals, gatekeepers of selected communities, and some owners of parcels in those communities; finally, geometrical data was collected by the owner of parcels who identified their parcel boundaries using three different techniques (GPS app on a smartphone, iPad tablet, and paper-printed satellite image). It was pleasing to see such a large number of local people willing to volunteer their knowledge, time and services to this project.

Fieldwork pictures:

Using printed satellite image to identify parcel boundaries

Above: Using printed satellite image to identify parcel boundaries

Using an iPad with uploaded and georeferenced cadastral maps to identify and edit parcels

Above: Using an iPad with uploaded and georeferenced cadastral maps to identify and edit parcels

Using smartphones to find GPS coordinates on parcel corners

Above: Using smartphones to find GPS coordinates on parcel corners

ITRC @Newcastle – autumn 2015

As a research group a small number of us have been involved in the ITRC project over the past five years, namely Stuart Barr and Dave Alderson. Craig Robson joined the ITRC ranks in January, pausing his PhD work to help complete the final phase of the research required by autumn 2015. ITRC (Infrastructure Transitions Research Consortium) has been investigating the future of the UK’s national scale infrastructure with regards to how it must develop to meet ever changing demands and how climate change amoungst other factors will affect the resilience of those networks we rely on.

Our role in the project has centered around the development of the tools which would allow the five year project to be completed and included, but was not limited to, the development of the central database for all data for the project, and the support tools which would enable the analysis to be undertaken and results reported. It is on this later point where most of the past 6 months have been spent; developing a reporting tool for the presentation of the results from the long-term infrastructure planning aspect of the project.

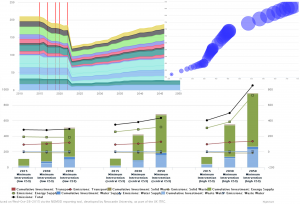
The developed reporting tool allows users to view results from the each infrastructure sector (e.g. transport or waster supply), or view cross sector results, a set of similar metrics computed for each sector allowing for direct comparisons between them on there performance. For each sector a range of model outputs can be viewed from the level of emissions produced, to the running costs per year to the cumulative capital investment required. Results are shown not only at the regional level, but where possible at the sub-national level through the government office regions for example where the models output data at this granularity. This allows the tool to show data not just in charts, but also through maps, allowing new insights to be learned which may not be identified through non-spatial results. More detail on the tool, along with images and the like will be provided in a specific post at a later date, but for now a small selection of images below exemplify the tool.

Drawing1

With the end of the project looming near an event was organised at the ICE in London on the 15th October where the key results and impacts from the project could be disseminated to a wider audience with those key members behind the research all being present to answer questions and discuss their work. At the event we were available to demo the reporting tool and discuss the complexities behind the database for those interested, while a set of slides were used to give a overview of our work. More generally two videos (below) were produced giving an overview of the project and the one on the resilience of the UK’s national infrastructure.