
As we move into the new academic year this is a question that many colleagues may have.
With an increased amount of online teaching and non-synchronous learning activities, ensuring that students are effectively engaging with their studies will be particularly important in 2020-21.
Many of the ways in which you gauge whether groups of students, or individuals, are engaging in the teaching on your module will remain the same, some will need tweaking for different teaching formats, and others tools and information are new for this year.
This blog post gives a whistle stop tour through some of the approaches that colleagues may be using in 2020-21 to look at students’ engagement in their modules and identify those needing additional support or guidance.
Reading the (Zoom) room
Whether the session is on campus in present-in-person format, or an online synchronous teaching session, as educators you will still glean much from observing your students as they participate in their small group teaching.
This can be as simple as keeping an eye on attendance. If a student doesn’t attend a session or multiple sessions without cause or notice, follow up with them and potentially escalate this to their personal tutor if required.
Tip: To find a student’s Personal Tutor search for them in NUStudentSearch
For those that are attending, are they participating? Are they contributing to discussions, working with other students on the learning activities you set, asking questions in or outside of the session?
Does the informal check in in teaching week 3, as detailed in the Student Voice schedule, highlight individuals or groups of students who are struggling to engage in the module? Perhaps it helps you to identify content or topics that need revisiting or a need for further support on how students should approach their learning? There are many ways you can approach this informal check in which provide you with feedback on students’ engagement.
What does your Canvas show?
Our new VLE Canvas, has an in-built tool which provides a wealth of information about students’ engagement with the teaching materials and activities in your module.
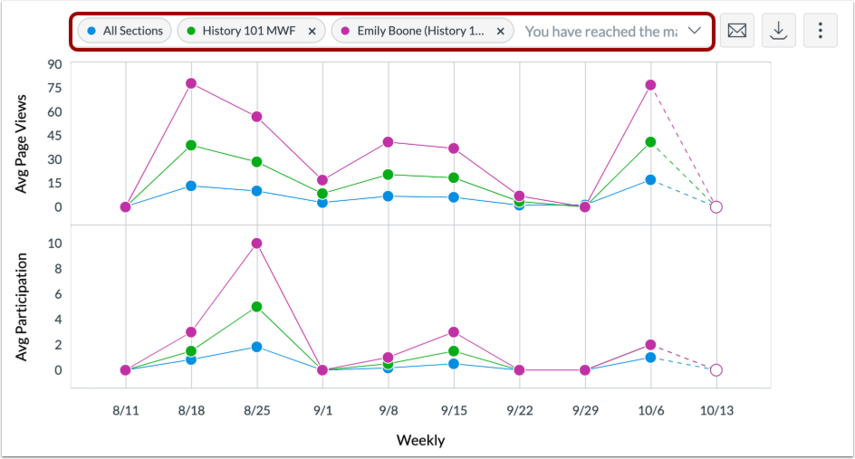
The New Analytics tool in Canvas provides a daily updated set of information to colleagues on the module at the level of the whole cohort, and down to individual students.
This tool allows you to get a quick overview of the module, providing useful real-time insights as the module progresses including:
- marks and averages for both formative and summative assessments
- data on student participation with structured learning activities – including collaborating in Canvas, posting in online discussions, responding to announcements and other forms of student activity
- weekly page views data showing the sections of the module and resources being accessed
Its flexibility means you can also look at the level of all students, smaller groups or individual students to identify those in need of support and to inform conversations with your students.
You can also easily directly contact specific students based on their activity through the tool, a way of highlighting additional resources on a particular topic to those whose quiz scores suggest they would benefit from this, for example.
For more information on the tool and how to access it see the staff guides on the Digital Learning website.
What about attendance monitoring?
The Attendance Monitoring Policy has been adapted to the new academic year, to allow schools to take a more flexible approach of considering a combination of attendance and engagement information.
- Present-in-person teaching sessions will continue to record student attendance via room scanners for those students who attend in Newcastle, with reports accessible in SAMS through the usual processes.
- Where colleagues wish to take attendance, but the teaching session is not held in a space with a scanner, they can choose to make manual attendance lists which can be input into SAP.
- As some students will be studying remotely, and the SAMS data will therefore only provide a partial picture, a new report in Canvas can be accessed alongside this data. The Zero Activity Report will show any students who are enrolled on the course but have not accessed Canvas in the period specified when the report is run.
It is recommended that colleagues in schools look at the SAMS data and Zero Activity report in conjunction as part of their monthly attendance reporting.
The Zero Activity report can be run more regularly, and colleagues are recommended to run this a few weeks into term to identify any students who have not accessed the VLE or participated in their learning across their programme of study.
It can also provide additional information to Personal Tutors or Senior Tutors when identifying a need for, and providing additional pastoral support to, individual students.