Researchers and academics from the EPSRC National Centre for Energy Systems Integration (CESI) and the Supergen Energy Networks Hub, Dr Hamid Hosseini, Dr Adib Allahham, Dr Sara Walker and Prof Phil Taylor recently published their paper ‘Uncertainty Analysis of The Impact of Increasing Levels of Gas and Electricity Network Integration and Storage on Techno-Economic-Environmental Performance’ in the international, multi-disciplinary journal Energy.
About the author: Dr Hamid Hosseini

Hamid joined Newcastle University in 2017 as a postdoctoral research associate to the EPSRC National Centre for Energy Systems Integration (CESI). Since joining the team, Hamid has been actively involved in research looking at planning, optimisation and operational analysis of integrated multi-vector energy networks. He also collaborated with a multi-disciplinary team on the UKRI Research and Innovation Infrastructure (RII) roadmap project, advising UKRI on the current landscape and future roadmap of Energy RIIs. He has supported and collaborated with several CESI Flex Fund projects to investigate further various aspects of Energy Systems Integration (ESI). Moreover, he is working with the Executive Board of Northern Gas Networks to identify the potential energy systems challenges that could be investigated at the Customer Energy Village of the Integrated Transport Electricity Gas Research Laboratory (InTEGReL), through collaboration with a multi-disciplinary team of energy experts in industry and academia. Hamid is author of several papers published in prestigious journals and conferences on the review and techno-economic-environmental operational analysis of integrated multi-vector energy networks.
Contact email: hamid.hosseini@newcastle.ac.uk
Profile details
Like many Governments, the UK has committed to significantly reduce Greenhouse Gas (GHG) emissions, setting a target of ‘Net Zero’ by 2050 [1]. In many regions, the focus has been on the electrification of heat to ensure these targets are achieved. There is a growing interest in exploring and quantifying the impact of integrating energy systems to decarbonise them. This includes the integration of the gas and electric networks and increased use of renewables and energy storage [2], [3], [4].
However, there is great uncertainty associated with forecasted loads, generation of renewables, energy prices and other operational costs, as well as the emissions associated with future networks and energy conversion technologies. To provide a basis for making well-informed and risk-based design choices towards the GHG emission targets, it is essential to consider the impact of different sources of uncertainty on the Techno-Economic-Environmental (TEE) performance of Integrated Energy Networks (IENs). In addition to these uncertainties, the TEE impact of different Energy Storage Systems (ESSs) and different levels of integration of the networks [5] need to be investigated in detail.
In this paper, we present a framework to assess the Techno-Economic-Environmental (TEE) impact of Integrated Gas and Electricity Networks (IGENs). We look at how different levels of networks’ integration and storage devices affect the performance of IGENs. Using Monte Carlo Simulation, we sampled probabilistic distributions to model the sources of uncertainty including loads, RESs, economic and environmental factors. More detailed information of the inputs and outputs of the TEE framework is shown in Figure 1.
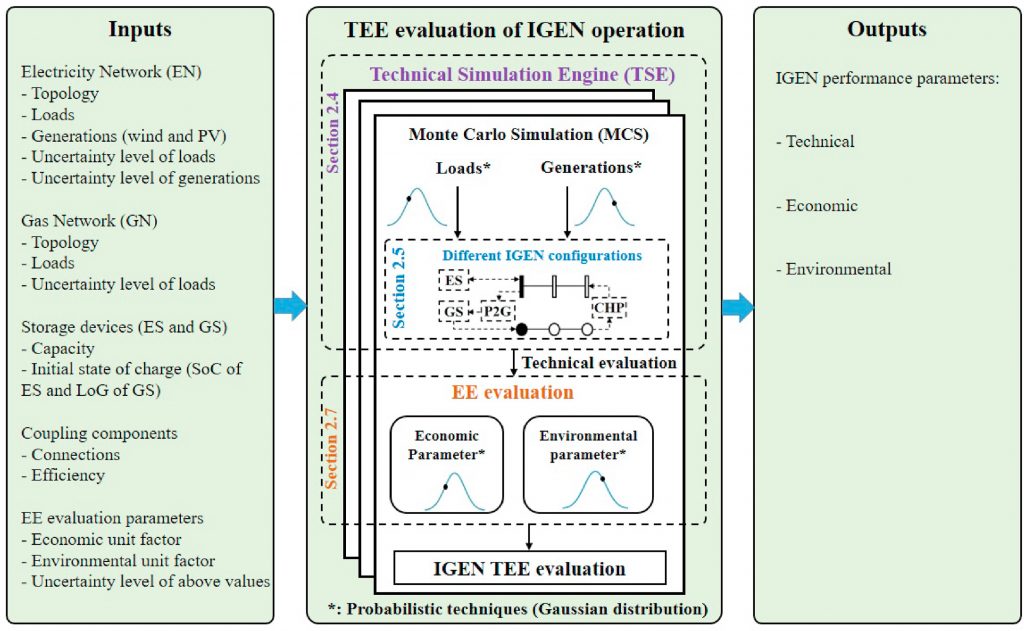
The framework carries out a TEE operational analysis of IGENs for possible future energy scenarios to calculate the energy imported from upstream networks, operational costs, and emissions. As the framework considers uncertainties in this analysis, it helps robust decision making in designing an energy system to meet 2050 carbon targets.
In the paper, we give a comprehensive analysis of the results when the framework is applied to a real-world case study.
The key findings of this analysis include:
- Efforts to improve the efficiency of coupling components by equipment manufacturers are very important goals in pursuit of lower TEE performance parameters in future integrated networks.
- Given that demand reduction and decarbonisation of electricity and gas networks is a priority, the coupled configurations are likely to become more attractive between now and 2050.
These findings hold true for all the values considered in the uncertainty analysis.
The full paper will appear in the Elsevier Journal, Energy, and is available to view online [6].
References
[1] Committee on Climate Change. Net Zero – The UK’s contribution to stopping global warming, 2019. Google Scholar
[2] P. Rachakonda, V. Ramnath, V.S. Pandey. Uncertainty evaluation by monte carlo method, MAPAN, 34 (3) (2019), pp. 295-298. CrossRef View Record in Scopus Google Scholar
[3] Han Jie, Chen Huaiyan, and Cao Yun. Uncertainty evaluation using monte carlo method with matlab. In IEEE 2011 10th International Conference on Electronic Measurement & Instruments, volume 2, pages 282–286. IEEE, 2011. Google Scholar
[4] Seyed Hamid Reza Hosseini, Adib Allahham, Sara Louise Walker, Phil Taylor. Optimal planning and operation of multi-vector energy networks: A systematic review. Renewable and Sustainable Energy Reviews, 133 (2020), 110216. Google Scholar
[5] Seyed Hamid Reza Hosseini, Adib Allahham, and Phil Taylor. “Techno-economic-environmental analysis of integrated operation of gas and electricity networks.” In 2018 IEEE International Symposium on Circuits and Systems (ISCAS), pp. 1-5. IEEE, 2018. https://doi.org/10.1109/ISCAS.2018.8351704
[6] Seyed Hamid Reza Hosseini, Adib Allahham, Sara Louise Walker, Phil Taylor. Uncertainty Analysis of The Impact of Increasing Levels of Gas and Electricity Network Integration and Storage on Techno-Economic-Environmental Performance, Energy, 2021, 119968, ISSN 0360-5442. https://doi.org/10.1016/j.energy.2021.119968
 Dr Mike Simpson is a Research Associate working part-time with CESI. His background is in programming, game development and visualisation, and he is currently working as a Research Software Developer in the Digital Institute at Newcastle University.