Category Archives: energy bills

Can nuclear power play a large part in getting to net-zero? – Professor Gordon MacKerron

In late 2020, there was a flurry of announcements about climate change and energy – first a ten-point plan for a ‘Green Industrial Revolution’[i] followed a few weeks later by a much–delayed energy White Paper[ii].  Nuclear power figures prominently in both narratives, with three possible ways forward. In this CESI Blog post, Professor MacKerron, CESI Associate Director and Professor of Science and Technology Policy at the Science Policy and Research Unit (SPRU) at the University of Sussex discusses these routes.

About the Author

This image has an empty alt attribute; its file name is image-3.png
Professor Gordon MacKerron

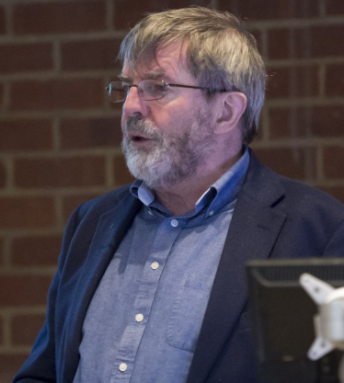
Gordon is Professor of Science and Technology Policy at the Science Policy and Research Unit (SPRU). He specialises in the economics and policy issues of electricity, especially nuclear power, and more broadly in energy security questions. He currently chairs the Research Committee of UKERC and was deputy director of the Strategy Unit, Cabinet office team that wrote the ‘Energy Review’ in 2003.

He is currently overall PI in the Horizon 2020 project TRANSrisk, a collaboration of 11 partner institutes engaged in assessing the risks attaching to different policy pathways consistent with achievement of European 2050 climate change commitments.

Gordon works on a number of CESI Work Packages and is lead for Work Package 1: Commercial, Regulatory & Policy Aspects

Three possible ways forward.

First, there is a long-term hope that a UK-only commercial fusion design will be ready by 2040.  This is frankly wishful thinking and, even if it could be achieved, involves a new type of compact design that would have no impact on 2050 zero-carbon objectives.  This is because it would be a small prototype 100MW machine with a current price tag of £2bn[iii] – three times more expensive per unit of output than the already very expensive twin reactors being built at Hinkley C.  £400m has been ‘already committed’ to this endeavour by Government,[iv] a sum that could have been spent instead on projects that could genuinely contribute to net zero. 

The second possibility is a push (‘aim’) to have one more large nuclear plant brought to final investment decision by 2024, following the almost-decade-late Hinkley C.  As Government makes clear, achieving this will depend on a radically new funding structure.[v]  This could be a regulated asset base model, in which consumers would take on most construction risk, allowing investors a more or less guaranteed rate of return, and/or  Government putting up some taxpayer cash.  Since the White Paper, it has become clear that developments at two of the only three plausible big-reactor sites – Wylfa (abandoned by Hitachi) and Bradwell (paused for a year by EDF/China General Nuclear) – are now effectively no longer in contention.  Only a further Hinkley replica at Sizewell seems at all possible, and large institutional investors have recently made clear they will not put up any of their own money for this.  Significantly, and credibly, Government makes no mention of any further ventures along the large-nuclear path.

What’s wrong with option 1 or 2?

The problems in these two nuclear avenues inevitably throw a lot of weight on to the third strand, the development of so-called modular reactors, both ‘small’ (SMRs) and ‘advanced’ (AMRs).  The relatively near-term part of this involves Government spending up to £215m to help develop a domestic SMR design by the early 2030s.[vi]  The attraction of SMRs is that they could offer the possibility of relatively rapid factory manufacture of components, followed by fairly simple on-site construction. Their main drawback is that they will be based on cut-down versions of existing light water reactor designs, in the process losing the economies of large-scale current nuclear plants. In practice the only credible SMR involves a consortium already built up over several years by Rolls Royce, using its technical know-how as designer and manufacturer of small reactors for UK nuclear-powered submarines. To be at all competitive many SMRs would need to be built, thus achieving economies scale in production to offset the loss of economies of large reactor size. In this pursuit, Rolls Royce want to build up to 16 of these SMRs at a cost currently estimated by them[vii] (and therefore probably optimistic) of just short of £29bn.  This is a highly inflexible proposition, risking very large sums of public money.

Rolls Royce have also suggested that such reactors might generate at around £60/MWh initially, falling to £40/MWh for later plants.[viii]  By contrast, in terms of real projects, as opposed to very early and potentially optimistic expectations, offshore wind is already committing to deliver in the near-term at auction prices of around £40/MWh.[ix]  According to the White Paper, the global market for modular and advanced reactors might (as ‘estimated by some’ – actually the National Nuclear Laboratory) be worth £250bn to £400bn by 2035.  This is at best heroic, given that the current global market is zero. In any case, the idea that the UK might win a large share of such a market (if it did exist) is made hopelessly implausible by the fact that the UK is well behind several other countries’ SMR development. These include Russia, the USA, Japan and China, with the Rolls Royce planned design only one among over 70 SMR designs currently being pursued around the world.[x]

The second leg of the modular reactor story involves ‘Advanced’ reactors.  The ambition here is to have a demonstrator ready by the early 2030s ‘at the latest’.  For this, the Government may be willing to spend a further £170 m.  Here we are in highly speculative territory.  As the White Paper very briefly explains, AMRs would be reactors that use ’novel cooling systems or fuels and may offer new functionalities (such as industrial process heat).’[xi] Such designs would most likely involve high temperature gas cooling; many such designs have been developed in the past 50 years, none of them proving commercially viable.  It is not clear why work in these challenging technological areas can be expected to do much better in the future.  Even if such technologies eventually prove more commercially tractable, having a demonstrator built by the early 2030s is extremely hopeful. 

Optimism?

The optimism displayed in these plans includes the up-front claim that ‘the UK continues to be a leader in the development of nuclear technologies’[xii] – a proposition, when applied to commercial reactors, that has no basis in fact whatever.  However, Government does qualify its enthusiasm by making clear that its plans, including expenditure, remain conditional. For a large reactor, bringing a project to fruition depends on ‘clear value for money for both consumers and taxpayers’[xiii] and the £385 m apparently to be spent on SMRs and AMRs reactors is ‘subject to future HMT [Treasury] Spending Reviews’.[xiv]  But even if all nuclear plans worked out as the White Paper hopes – in terms of developing new low-carbon capacity on the predicted time-scale – it is far from clear that this would be achieved at anywhere near competitive cost.  Even if nuclear power does well, large reactors will play, at best, a very small part in the move to net zero carbon by 2050. While modular reactors could do more, there is huge uncertainty, probable extended timelines and no guarantee of any kind of success.


[i] HM Government (2020) The Ten Point Plan for a Green Industrial Revolution November

[ii]  HM Government (2020) The Energy White Paper. Powering our Net Zero Future December CP337

[iii]  ‘UK takes step towards world’s first nuclear fusion power station’ New Scientist, 2 December 2020.  Numbers are quoted from the UKAEA, the fusion R&D proponent

[iv]  The Energy White Paper, p. 51.

[v]  Ibid., p. 49

[vi] ibid. p. 50

[vii] World Nuclear News ‘Rolls Royce on track for 2030 delivery of UK SMR’ 11 February 2021

[viii]  ibid.

[ix]  https://www.greentechmedia.com/articles/read/prices-tumble-as-u-k-awards-5-5gw-of-offshore-wind

[x] IAEA Advances in SMR technology development 2020 September 2020, in which 72 designs are listed

[xi] The Energy White Paper, p. 51

[xii] ibid. P.50

[xiii] ibid. p.49.

[xiv] ibid. p.50

Getting it done? The UK 2020 Budget and the support for a net-zero transition in the energy sector.


About the authors:

Dr Sara Walker is Reader in Energy at Newcastle University and Director of Newcastle University Centre for Energy.

Professor David Flynn is Professor of Smart Systems at Heriot Watt University

Both Sara and David are Associate Directors of the EPSRC National Centre for Energy Systems Integration, a £20m collaborative research programme with industry and government investigating the social, ecconomic and technical value in energy systems integration.


March 2020 Budget

On 11th March 2020, the Chancellor Rishi Sunak presented to Parliament the Government budget¹. This was an opportunity for the UK Government to clearly signal its commitment to deliver on the net-zero greenhouse gas emissions target for 2050 and to also lay the groundwork for COP26 as the host nation.

Albeit the language of the previous administration associated with “industrial strategy” was dropped, the Government retained a reference to the Grand Challenges, indicating that there is likely to be continued investment into energy innovation and climate change mitigation. A key indication of this is the commitment to at least double investment in the Energy Innovation Programme.

Firstly

The first mention of issues related to energy in the Chancellor’s speech came with an announcement to continue the freeze on fuel duty. For comment on this, and other transport initiatives in the Budget, we refer you to DecarboN8’s review². In a separate announcement, Business Secretary Alok Sharma previously confirmed a £36.7 million investment to design, test and manufacture electric machines. £30 million will be used to create a national network cutting-edge centers led from Newcastle University – based in Newport, Nottingham, Strathclyde, and Sunderland – to research and develop green electric machines including planes, ships, and cars. This represents the “demonstrator” element of the Industrial Strategy Challenge Fund Driving the Electric Revolution Challenge.

And then …

The second mention of energy came in an announcement, as part of the Research and Development (R&D) spend, of £900m funding for nuclear fusion, space, and electric vehicles. As employees of research organizations, we welcome the announcement of £22bn per year by 2024-25, in research and development. However, the role of new nuclear in the Committee on Climate Change Net Zero technical report³ is relatively minor.
On housing, the Budget refers to £12.2bn for the Affordable Homes Programme over 5 years, a push for 300,000 new homes per year, and reforms to planning to accelerate development. No commitment is made to the standard of new homesª, or retrofit of existing homes, which is inconsistent with the Committee on Climate Change Net Zero report, which found that high levels of energy efficiency are needed to get close to the zero targets.

What does this mean for energy sector? 

There is a clear need to improve the quality of UK homes, in a way that reduces energy use and moves us towards heating systems that use lower-carbon fuels. We need to make urgent changes in this area, from research to improve the performance of individual technology like heat pumps, to understanding possible future housing performance and the energy needs associated with that. The EPSRC National Centre for Energy Systems Integration (CESI) is looking at these types of research challenges.

The meat of the Budget from an energy perspective is in the Budget report section on “Growing a greener economy”. There is an announcement to double the size of the Energy Innovation Programme as mentioned previously, although some of this money is for R&D and therefore likely to be included in the figures above. A further £800m was announced by the Chancellor for the development of two Carbon Capture and Storage (CCS) sites through the creation of a CCS Infrastructure Fund. CCS support was removed by previous administrations but is integral to many scenarios within the Committee on Climate Change Net Zero report.

No figures are mentioned, but the Budget report includes a new support scheme for biomethane funded by a Green Gas Levy, and a Low Carbon Heat Support Scheme to enable the installation of biomass boilers and heat pumps. £270m is promised to enable new and existing heat networks to adopt low carbon heat sources, to follow on from funding of £97m for the final year of the Heat Networks Investment Project (HNIP). There is a rise in the Climate Change Levy on gas (for 2022-23 and 2023-24). The Renewable Heat Incentive is extended to 31st March 2022. Furthermore, £10m in 2020-21 is to support the design and delivery of net zero policies and programs. Heat networks are an area of research for the EPSRC National Centre for Energy Systems Integration (CESI), and we also expect to investigate more scenarios with hydrogen and CCS now that the goal for the UK has changed from 80% to a net-zero target.

And Finally

Given the critical interdependencies of our energy infrastructure to other vital services e.g. water, transport, services from public buildings, we also see opportunities to accelerate and distribute the efforts in decarbonisation by utilising the opportunities of the Making the most of Government knowledge assets initiative. The public sector holds around £150 billion of knowledge assets (intellectual property, tech, data, etc.), which is vital in shaping the operation and planning of decarbonised services. However, the absence of any Budget support for solar, wind, and storage – elements seen as vital with renewable generation four times current levels in some Committee on Climate Change scenarios – is of great concern. As is the lack of investment to decarbonise the building stock.

Getting it done isn’t the same as getting it right. And for the UK energy sector, there is very little in the budget which gives confidence that we are doing enough, let alone doing it well.

References

  1. https://www.gov.uk/government/speeches/budget-speech-2020
  2. https://decarbon8.org.uk/budget-2020-transport-we-cant-build-our-way-out-of-the-climate-challenge/ with for example: £403m for the Plug-In Car Grant; £129.5m to extend the scheme to vans, taxis and motorcycles; Vehicle Excise Duty exemption; £500m over 5 years to roll out rapid charging; removing red diesel tax relief; £304m for NOx reduction; freeze of fuel duty; £20m midlands rail hub; £5bn for new buses and cycling; £500m pothole fund; all dwarfed by the £27bn between 2020 and 2025 for road investment. Aviation is also mentioned with regards regional connectivity.
  3. https://www.theccc.org.uk/wp-content/uploads/2019/05/Net-Zero-Technical-report-CCC.pdf

ªhttps://assets.publishing.service.gov.uk/government/uploads/system/uploads/attachment_data/file/871799/Budget_2020_Web_Accessible_Complete.pdf “2.95 Future Homes Standard – The government is committed to reducing emissions from homes and to helping keep household energy costs low now and in the future. In due course, the government will announce plans to improve the standards of new built homes.”

How concerned should I be about my smart meter security? – Dr Zoya Pourmirza

With Smart Grids comes data and communication infrastructure and the associated unease of how we keep this data and infrastructure safe.  This article aims to raise awareness, by sharing knowledge about cyber-security considerations behind the UK smart metering infrastructure and it’s rollout.


About the Author

dsc01229

Dr Zoya Pourmirza, is a postdoctoral research associate at Newcastle University within the School of Electrical and Electronic Engineering. She was awarded her PhD in The Information and Communication Technology (ICT) Architecture in the Smart Grid from University of Manchester. Her research expertise includes Smart Grids ICT networks, cyber-security, communication energy efficiency, and data compression.

Zoya carries out a wide range of research for CESI in the area of cyber-security on energy systems.

Contact:- Zoya.Pourmirza@newcastle.ac.uk


Smart Grids comprise a number of different networks that offer communication infrastructure at the various levels within the power grid. For example:

  • Supervisory control and data acquisition (SCADA)
  • Advanced Metering Infrastructure (AMI)
  • Customer Energy Management Systems

Amongst these communication networks, the AMI system has received significant concerns. These disquiets are mostly around security and privacy of consumers. Most of these concerns could be the result of negative media coverage or lack of knowledge of the AMI system operating as a whole system, while its components are interacting together.

A peace of mind for the Smart Grid customers

It is worth noting that the smart metering infrastructure is not a single component or function, but it is a whole system. This implies that looking into the cyber-security issues of a single component such as a smart meter, individually, would probably give invalid results.

Accordingly, the Department of Energy & Climate Change (DECC) and GCHQ designed the AMI system in such a way that no single compromise would offer a significant impact. The DECC/GCHQ security team developed practical cyber-security control by using the “trust modelling” and “threat modelling” approaches. The former model refers to understanding how different players in the AMI system interact, and where trust needs to be managed. The latter model considers a set of hypothetical intentional/unintentional attack model that could cause an impact. Therefore, cyber-security should not be viewed as a hindrance to the GB smart meter roll out.

Components of the Advanced Metering Infrastructure (AMI)

Organisations involved in the design of the whole smart metering system are:

  • Gas and electricity meters, and related equipment
  • Distributed Network Operators (DNOs)
  • Data Communication Company (DCC)
  • Communication Service Provider (CSP)
  • Third parties (e.g. price comparison websites)
How to curtail the impact of vulnerabilities in a Meter

Although it is not possible to build a 100% secure system, but the best practice is to minimise the impact of the vulnerabilities by providing a balance between security, affordability, and business needs, while meeting the policy and national security objectives.

The following chart visualises security concerns, potential attacks, and countermeasures in the AMI system through a number of phases where an attacker tries to gain access to the smart meter to create a negative impact on the power grid.


This article, however, does not suggest that it is impossible to compromise the AMI system, but it discusses it would be a relatively arduous process to cause severe impact on the power grid, and customers are not as vulnerable as what they think they are. Therefore, while researchers should take the security and data privacy into consideration, we can focus our energy and resources on cyber-securing other segments of the Smart Grid, which can cause greater negative impacts on the power grid infrastructure and customers.

 Reference:

Gov.uk. (2014). Smart Metering Implementation Programme: Great Britain Companion Specification version 0.8 – GOV.UK. [online] Available at: https://www.gov.uk/government/consultations/smart-metering-implementation-programme-great-britain-companion-specification-version-08.

Exploring Smart Meter Data using Microsoft Power BI – Dr Mike Simpson

With the huge explosion in data volumes that the smart energy era brings, here at the National Centre for Energy Systems Integration our Computing Science researchers are utilising world-leading innovative techniques in data analytics. In this weeks blog, Dr Mike Simpson explains how the interactive visualizations and analysis capabilities of Microsoft’s Power-BI software can make light work of smart meter data.


Dr Mike Simpson is a Research Associate working part-time with CESI. His background is in programming, game development and visualisation, and he is currently working as a Research Software Developer in the Digital Institute at Newcastle University.
Contact details: mike.simpson@ncl.ac.uk  – Profile Details


Exploring Smart Meter Data using Microsoft Power BI

As data scientists, we are often asked to help our colleagues to process the data that they have collected. Often, they will have a set of research questions that they want to attempt to answer, and, in that case, there are plenty of tools that we can use to analyse the data and visualise the results. But what if you don’t know exactly what questions you want to ask? What if you have a dataset that you suspect might hold some additional value, but you’re not sure how to extract that value? These are not uncommon problems, and I’ve been looking at one potential solution.

Microsoft Power BI is a suite of analytics tools that can be used to produce a number of different visualisations by aggregating and filtering data in different ways. It includes a desktop application that can connect to a wide variety of data sources and an online platform that allows the results to be shared with collaborators or embedded on other websites. However, as well as simply displaying the data using static graphs and charts, it can also create dynamic, interactive reports, like the one shown in the screenshot below.

Here, we have taken some sector customer average electricity smart meter data from the Customer-led Network Revolution (CLNR) and produced a visualisation of the data from the participating Small Business Enterprise customers. The first graph shows the average daily energy usage profile for each Sector (the average across the whole week). But what if you want to ‘drill down’ deeper and explore the data in more detail? Well, in this example you can use the ‘Slicer’ – the checklist to the side of the graph – to select individual days within the study, which will adjust the graph to display the filtered data for that day only. Alternatively, you could use the slicer to select other time ranges within the data. In the example below, one graph shows only the data for Monday to Friday and the other graph shows only the data for Saturday and Sunday.

Now it is possible to see the distinct difference in usage patterns between the different sectors during weekdays and at weekends. You can see that, for example, Industrial usage is lower at weekends, as you would expect, while agricultural usage is fairly similar.

We’ve done something similar with the graphs below, which are part of the same report and show the average daily usage for each day of the week, as well as the average for weekdays/weekends.

As before, we can drill down into the data by using the Slicer to select different months and sectors, which filters the visualisation accordingly. This allows us to study how usage changes for each sector over the course of the year.

These are fairly simple examples, but they show how Power BI can be used to create visualisations that not only display your data, but are also interactive and also allow you to explore the data by filtering it in different ways. A Power BI report can include a number of different visualisations, including Scatter Graphs, Pie Charts, and even Maps, in addition to the Line and Bar Graphs shown in the examples above.

Using Power BI in this way allows you to explore the data that you have collected to look for unexpected patterns, and may help to reveal new Research Questions that you can answer, or may help you discover new ways to extract value from the dataset.

An IET debate on the role of smart meters – Dr David Greenwood

CESI researcher, Dr. David Greenwood, recently participated in an IET debate event discussing the rollout of smart meters in the UK. In this week’s blog, he talks us through the highlights of that debate.


About the Author

David Greenwood

Dr David Greenwood is a researcher with the National Centre for Energy Systems Integration (CESI) and is based at Newcastle University. His research focuses on taking advantage of flexibility within energy systems and understanding sources of uncertainty and variability such as customer demand and intermittent generation. He believes that Smart Metering can play a crucial role in both of these areas, but that the approach currently being followed the UK will deliver neither the flexibility nor the understanding that we need to ensure a reliable, sustainable, and affordable energy supply.

Contact Details:- david.greenwood@ncl.ac.uk    Profile Details 


I recently traveled to Guildford represent the National Centre for Energy Systems Integration (CESI) in a panel discussion around Smart Meters, arranged by IET Surrey. The event took place at the University of Surrey, and attendance was over 150.

Along with my fellow panelists –  Craig Lucas from the UK Government’s Department for Business, Energy and Industrial Strategy, and Andrew Jones from EDF Energy – I answered a variety of questions from the audience around the technical, commercial, and social aspects of Smart Metering. The audience was often combative, particularly when discussing issues around the GB Smart Meter roll-out, which has received substantial negative media coverage. There were concerns around the cost of the rollout, whether the supply companies were going to complete it within the mandated timeframe, and data privacy, along with significant doubts around what the benefit would be to an individual customer, and to society at large.

While the other panellists focussed on the technical aspects of the rollout, I used my answers to describe the place of smart metering in an integrated energy system, on the need for more customer flexibility in a future energy system, and on the trade-off between data privacy and a more reliable, affordable, and sustainable energy system. I tried to get the audience on side by drawing an analogy between Smart Metering and the Google Maps traffic system; this system uses personal speed and location data from smartphone users to identify areas of heavy traffic, and in doing so provides a benefit to all of its users. Smart Meters have the potential to deliver similar benefits to electricity and gas customers by identifying when and where energy is being used and allowing network and system operators to make better-informed decisions as a result.

The event was thought-provoking for me, the audience was certainly engaged with the topic, and it was enlightening to be speaking alongside the other panelists who brought different perspectives and expertise from my own. Whilst I know we didn’t persuade everyone in the audience, I still think Smart Metering can and will deliver substantial benefits to our energy system, but many other enablers – including innovative tariffs and charging structures, better user education, and more smart home devices – are necessary for the rollout to fulfill its potential. Traditional metering will soon – as I told one audience member who was determined not to be upgraded – belong in a museum.

The IET panel 

Saving on Domestic Energy Bills – How to compare domestic energy bill tariffs


As part of a series of posts focussing on consumer energy consumption reduction in the UK, this post highlights some advice in understanding a domestic consumer energy bill based on advice from Ofgem,  the government regulator for gas and electricity markets in Great Britain

ofgem_icons


Saving on Domestic Energy Bills by finding a cheaper supplier 

In the UK, the energy regulator Ofgem, has encouraged domestic energy consumers to reduce their annual energy bills by switching to alternative tariffs with their supplier or switching supplier altogether. Tariffs are the prices that Energy Companies change per unit of energy used.

To help the consumer navigate the complex world of energy tariffs, Ofgem regulated that Energy Supply Companies must provide a “Tariff Comparison Rate” for all the energy tariffs that they bring to market.

Tariff Comparison Rate1

The Tariff Comparison Rate  (TCR) is there to act as a price comparison guide for all energy customers. It breaks down the cost of an energy tariff by combining everything from the unit rates, standing charges, VAT and discounts into one amount and then dividing it by the average annual consumption figures published by Ofgem – the energy regulator.

The idea is to allow all tariffs to be compared against one another, by giving you a single price per kilowatt hour for the energy you use.

This is how it is calculated:- 

  • multiple the unit cost by ofgem’s average energy consumption figures 
  • Add a year’s standing charge (this is a daily charge and can vary significantly between tariffs)
  • Take away any discounts that might be applicable
  • Add the VAT
  • Finally, divide this figure by Ofgem’s average consumption figures
  • This gives you the TCR in pence per kWh (kilowatt hour)

Common Energy Tariffs2

There are two main types of energy tariff – fixed or variable rate. Dual fuel and online options are an opportunity for further cost saving.

  • Fixed– this is a tariff with a fixed end date
  • Variable– the prices of this tariff aren’t fixed, so your supplier can change them as long as they give you advance notice.
  • Duel Fuel– based on a supply of energy for both your gas and electricity from one supplier – sometimes more economical
  • Online– specifically operated online, meaning paperless bills etc. so may be slightly cheaper than other tariffs

Does this save energy?

Switching supplier or finding a cheaper tariff will not reduce energy consumption – it will only reduce the amount the consumer pays for their energy. Look out for our next blog which provides some easy ideas on how to save energy within the home.

1https://www.ovoenergy.com/blog/ovo-news/tariff-comparison-rates.html

2http://www.goenergyshopping.co.uk/energy-tariffs-and-deals/common-tariffs