Monthly Archives: October 2017

Exploring Smart Meter Data using Microsoft Power BI – Dr Mike Simpson

With the huge explosion in data volumes that the smart energy era brings, here at the National Centre for Energy Systems Integration our Computing Science researchers are utilising world-leading innovative techniques in data analytics. In this weeks blog, Dr Mike Simpson explains how the interactive visualizations and analysis capabilities of Microsoft’s Power-BI software can make light work of smart meter data.


Dr Mike Simpson is a Research Associate working part-time with CESI. His background is in programming, game development and visualisation, and he is currently working as a Research Software Developer in the Digital Institute at Newcastle University.
Contact details: mike.simpson@ncl.ac.uk  – Profile Details


Exploring Smart Meter Data using Microsoft Power BI

As data scientists, we are often asked to help our colleagues to process the data that they have collected. Often, they will have a set of research questions that they want to attempt to answer, and, in that case, there are plenty of tools that we can use to analyse the data and visualise the results. But what if you don’t know exactly what questions you want to ask? What if you have a dataset that you suspect might hold some additional value, but you’re not sure how to extract that value? These are not uncommon problems, and I’ve been looking at one potential solution.

Microsoft Power BI is a suite of analytics tools that can be used to produce a number of different visualisations by aggregating and filtering data in different ways. It includes a desktop application that can connect to a wide variety of data sources and an online platform that allows the results to be shared with collaborators or embedded on other websites. However, as well as simply displaying the data using static graphs and charts, it can also create dynamic, interactive reports, like the one shown in the screenshot below.

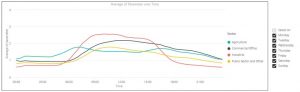
Here, we have taken some sector customer average electricity smart meter data from the Customer-led Network Revolution (CLNR) and produced a visualisation of the data from the participating Small Business Enterprise customers. The first graph shows the average daily energy usage profile for each Sector (the average across the whole week). But what if you want to ‘drill down’ deeper and explore the data in more detail? Well, in this example you can use the ‘Slicer’ – the checklist to the side of the graph – to select individual days within the study, which will adjust the graph to display the filtered data for that day only. Alternatively, you could use the slicer to select other time ranges within the data. In the example below, one graph shows only the data for Monday to Friday and the other graph shows only the data for Saturday and Sunday.

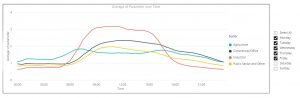
Now it is possible to see the distinct difference in usage patterns between the different sectors during weekdays and at weekends. You can see that, for example, Industrial usage is lower at weekends, as you would expect, while agricultural usage is fairly similar.

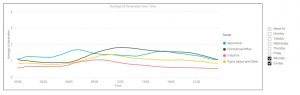
We’ve done something similar with the graphs below, which are part of the same report and show the average daily usage for each day of the week, as well as the average for weekdays/weekends.

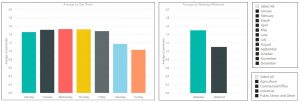
As before, we can drill down into the data by using the Slicer to select different months and sectors, which filters the visualisation accordingly. This allows us to study how usage changes for each sector over the course of the year.

These are fairly simple examples, but they show how Power BI can be used to create visualisations that not only display your data, but are also interactive and also allow you to explore the data by filtering it in different ways. A Power BI report can include a number of different visualisations, including Scatter Graphs, Pie Charts, and even Maps, in addition to the Line and Bar Graphs shown in the examples above.

Using Power BI in this way allows you to explore the data that you have collected to look for unexpected patterns, and may help to reveal new Research Questions that you can answer, or may help you discover new ways to extract value from the dataset.

The role of the building engineer within the development of energy systems – Dr David Jenkins

National Centre for Energy Systems Integration (CESI) Co-Investigator, Dr. David Jenkins, is a research specialist in sustainable buildings.  In this week’s blog, he discusses how buildings can be considered in future energy systems and how his CESI research is shaping this consideration.


About the Author

Dr David Jenkins is an Associate Professor in the Institute of Sustainable Building Design at Heriot-Watt University. He has over 70 publications in the area of low- energy buildings, energy policy, and climate change adaptation. He has worked on a number of EPSRC projects concerned with the energy use of the built environment, such as Tarbase,  Low Carbon Futures, ARIES and CESI and has contributed to a number of reports in these areas for UK and Scottish Governments. He is currently PI of the CEDRI project, looking to apply community energy analyses to case studies in India.

Contact details:- d.p.jenkins@hw.ac.uk  Profile Details


The built environment has always been of great importance in any discussion of carbon saving targets in the UK. 13% of UK carbon emissions emanate from heating/cooking in residential buildings alone[1]. 29% of emissions are linked to “energy supply” (including electricity supply to the built environment), with other sectors (e.g. “business” at 17% and “industrial processes” at 3%) also having energy consumption that is heavily linked to the built environment. Therefore, as we map out our future energy systems (gas/electricity grids and other energy pathways) we must have an understanding of the evolving energy demand characteristics of the diverse range of buildings that we occupy.

A practitioner with a particularly good understanding of this detail, the building engineer, often has their professional boundaries drawn around the building itself. Therefore, the sizing of a boiler, assessment of general building performance, and choices related to low-carbon design are not always placed in the context of other important factors within the energy supply chain.

Whilst this focus is to some extent defendable – the challenges of low-carbon building design are, in themselves, considerable – it does run the risk that crucial knowledge of building performance is not reflected in energy system modelling. This is particularly true when we investigate the steep vectors of change facing our energy systems in the coming decades. Coincident changes in climate, technologies, fuels, and operation, provide a landscape of uncertainty that must be consistently reflected in projections of every aspect of our energy system: supply, infrastructure/distribution, storage, and demand. For example, a future projection assuming the continued existence of an established mains gas grid for heating homes is not necessarily consistent with the installation of several million heat pumps for residential heating. The latter change should, therefore, be accompanied by an assumption on the supply-side that the gas grid will either be reduced in scale or used for something else. Policy in these different areas must also be similarly synergistic.

The building modeller is crucial to our understanding of energy demand but, with energy systems (e.g. National Grid) involving multiple actors from different disciplines, a key challenge is to provide guidance and future projections that are translated into different discipline-specific vernaculars. Integration across the disciplines must be reflected in modelling approaches, policy-making frameworks, and outputs. The CESI project, where novel modelling techniques are being used to explore the effect of future buildings on national energy systems, sees this as a key challenge in producing actionable guidance to a range of practitioners.

Another issue that often dissuades the traditional building modeller/engineer from interacting with wider energy system analysis is “scale”. Modelling a building is quite different to modelling buildings. Capturing the energy demand characteristics of a community of buildings (e.g. such as might be served by a substation) requires an understanding of the diversity of energy use. A “spikey” electrical demand profile of a single dwelling (showing kettle’s boiling and toasters toasting) is quite different to that of a 200-dwelling profile, where different behaviours and activities are summated together in a smoother profile. Likewise, asking a building engineer to consider the aggregated demand profile of, say, 200 gas boilers working at slightly different schedules is a step change from a detailed hourly profile of a single boiler. Yet this level of detail is particularly valuable when we consider what might happen to energy demand at specific times in the future. Will electric heat pumps create national electrical demand profiles that are more difficult to meet for energy suppliers? Or are such changes perfectly manageable providing storage and management solutions are utilised at the correct point in the network? And what happens if millions of people wish to home-charge their electric vehicles at similar times in the evening? What does a new residential electrical demand profile now look like for the UK? This, therefore, does not just require an understanding of scale, but also that of temporal resolution; daily averages of energy use will not indicate where and when such problems might be manifest, and what their solutions might be.

The future building engineer will be required to build on existing core skills to reflect the above context. Changes to energy supply (such as carbon intensity) will, ultimately, alter our assumptions of “good” and “bad” technologies for the built environment. Conversely, technological and behavioural change in the built environment will change our assumptions on how to supply that energy efficiently. This co-evolution of change across sectors is central to CESI and encapsulates the challenge to, but also the value of, multi-disciplinary energy system modeling.

[1] 2015 UK GREENHOUSE GAS EMISSIONS, FINAL FIGURES, 7th Feb 2017 https://www.gov.uk/government/uploads/system/uploads/attachment_data/file/604350/2015_Final_Emissions_statistics.pdf

An IET debate on the role of smart meters – Dr David Greenwood

CESI researcher, Dr. David Greenwood, recently participated in an IET debate event discussing the rollout of smart meters in the UK. In this week’s blog, he talks us through the highlights of that debate.


About the Author

David Greenwood

Dr David Greenwood is a researcher with the National Centre for Energy Systems Integration (CESI) and is based at Newcastle University. His research focuses on taking advantage of flexibility within energy systems and understanding sources of uncertainty and variability such as customer demand and intermittent generation. He believes that Smart Metering can play a crucial role in both of these areas, but that the approach currently being followed the UK will deliver neither the flexibility nor the understanding that we need to ensure a reliable, sustainable, and affordable energy supply.

Contact Details:- david.greenwood@ncl.ac.uk    Profile Details 


I recently traveled to Guildford represent the National Centre for Energy Systems Integration (CESI) in a panel discussion around Smart Meters, arranged by IET Surrey. The event took place at the University of Surrey, and attendance was over 150.

Along with my fellow panelists –  Craig Lucas from the UK Government’s Department for Business, Energy and Industrial Strategy, and Andrew Jones from EDF Energy – I answered a variety of questions from the audience around the technical, commercial, and social aspects of Smart Metering. The audience was often combative, particularly when discussing issues around the GB Smart Meter roll-out, which has received substantial negative media coverage. There were concerns around the cost of the rollout, whether the supply companies were going to complete it within the mandated timeframe, and data privacy, along with significant doubts around what the benefit would be to an individual customer, and to society at large.

While the other panellists focussed on the technical aspects of the rollout, I used my answers to describe the place of smart metering in an integrated energy system, on the need for more customer flexibility in a future energy system, and on the trade-off between data privacy and a more reliable, affordable, and sustainable energy system. I tried to get the audience on side by drawing an analogy between Smart Metering and the Google Maps traffic system; this system uses personal speed and location data from smartphone users to identify areas of heavy traffic, and in doing so provides a benefit to all of its users. Smart Meters have the potential to deliver similar benefits to electricity and gas customers by identifying when and where energy is being used and allowing network and system operators to make better-informed decisions as a result.

The event was thought-provoking for me, the audience was certainly engaged with the topic, and it was enlightening to be speaking alongside the other panelists who brought different perspectives and expertise from my own. Whilst I know we didn’t persuade everyone in the audience, I still think Smart Metering can and will deliver substantial benefits to our energy system, but many other enablers – including innovative tariffs and charging structures, better user education, and more smart home devices – are necessary for the rollout to fulfill its potential. Traditional metering will soon – as I told one audience member who was determined not to be upgraded – belong in a museum.

The IET panel