User test: Peter Macdonald
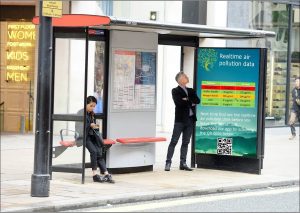
Presentation of the bus stop:
Concerning the Bus stop display, Peter is liked the concept and the design but found there was too much data on some of the screens when looking at them. He suggested to put more consequences of pollution on health on the display, like on the screen have the “data” related of asthma (This is the impact of this level of pollution). The data on the impacts can be found on the website of SPACE for Gosforth, exactly in the blue house link.
He said he can provide us with some catchy phrases for us concerning the impact of air pollution.
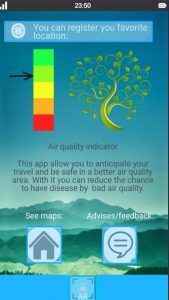
Test of the application:
Concerning the app, Peter found all of our pages without difficulties. He navigated easily in the app, find what he wanted to show us and ask questions. He liked the app, but there is a text in the part for people by foot which it maybe too much “violent” or “hard”. He asked us to send to him this picture to ask to other people.
After the test he put forward the proposition of app user having a profile to have a more personalised app, to record the history or the users location. After one month, six month, twelve month for example, put the effect of the real pollution on the health corresponding of the historic of locations because the pollution on health is a long term effect.
User test: Peter Smith
Presentation of the bus stop:
Peter also like the design and concepts of the bus stop display and found it easy to understand what was being shown to him. However during the test we found that what was being displayed on the bus stop display was not enough to concern him with air pollution. Like the other Peter he would of liked the health impacts of air pollution to be shown.
Test of the application:
When using the app Peter was able to navigate to all the pages and functions with relative ease. He liked the concept of the map but said it would not deter him from going to the high street at times of high air pollution as he has to buy food for himself and others.
Additional Information:
After the test he expressed concerns about the inclusion of the elderly population in what we are proposing. He said despite being in that demographic others were not as tech-savvy as himself. He then suggested having something like leaflet for people houses in a similar design detailing what is being done and recent air pollution data. This was an interesting proposition as Duncan Young suggested something very similar back at the user interviews stage.