We had an interview with Peter McDonald and got a lot of background information about Gosforth high street and the air quality concerns. The main thing Peter wanted to change is increasing the public awareness of air quality and community activity. The council and people who live there have already taken some actions to improve the air quality, a local council plan was implemented called The Air Quality Action Plan carried out in 2011, However, Peter believes it is not effective as nothing has really changed in the area. There are still 96 bus routes on the high street which is one of the main causes of air pollution and are still not controlled. Ten air quality monitors are situated along the high street and they gather useful data but the data is not easy to access and understand and is therefore largely ignored by the local community. Peter hopes that less people will drive their cars everywhere and walk their children to school if the data is made easily interruptible for the users. They have a Facebook account and people can leave their comments. It is good for them to know what the residents think about but there are not enough people passionate about their community air pollution levels, therefore peter believes a behavioral change needs to be implemented with the local community to increase user activity. Display boards are the best idea for them because it is easily accessible for everyone who passes along the street and easy to understand for children, adults and the old. To some degree, the goal is to make more people realize the importance of air quality activism.
Duncan Young Interview Reflection
1. What is your Role within Gosforth high street?
Duncan stated that as well as being a business owner he was also a resident on the high street and a member of the trader’s association
He also discussed the existence of the trader’s association but said it was limited by the fact that only the independent business got involved.
2. What challenges do you feel Gosforth high street faces?
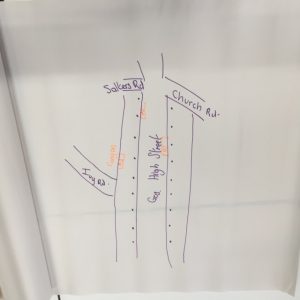
He said congestion was a huge problem on the high street especially at peak times. He wasn’t really sure on how to solve this personally but one idea he thought of was to divert the limited stop X bus routes via Cowgate instead of the high street. I personally felt this was a bit of nimbyism as the bus would just be blighting the residents of Cowgate instead. He also showed us the local council’s red route plan that local shops fought off despite it potentially reducing congestion on the high street as it would have stopped customers/delivery’s stopping on the high street.
3. Do you know how most of customers currently travel to the Gosforth high st?
He stated that most of his own customers drove to Gosforth High St, he then showed us a survey from 2011 of high street users.
The majority of respondents arrived by car:
66% car
16% bus
6% cycle
29% foot
This was particularly useful as really demonstrated how local shops are dependent on the traffic.
4. How do local shops on the high street feel about the Air pollution?
He said that local shops are concerned but are stuck with the problem that they need the traffic as well. He also said the larger chain shops were not allowed to get involved due to head office therefore their feeling is not known.
5. Do the businesses have an existing plan concerning the high street in general?
They did not have a plan.
6. Are you aware of the Urban observatory data available online at http://uoweb1.ncl.ac.uk/ that shows real time data from the 10 air pollution sensors on Gosforth high street?
He said he was aware there was some pollution sensors but was not aware there was 10 of them and that the data was available online. I found this interesting as you’d of thought somebody based on the high street would be aware of theses sensors.
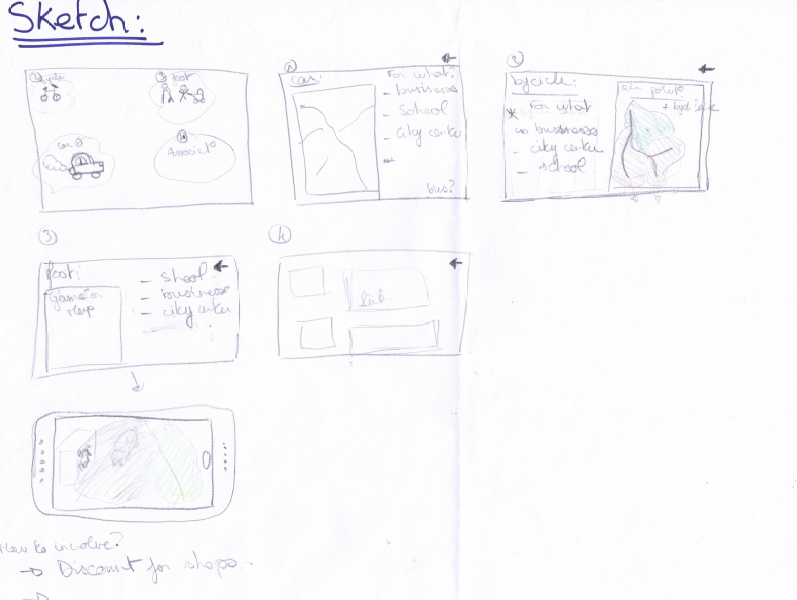
7. Given the choice of a Smartphone App, Interactive Display on the high street, Emails, Website, Newspaper or any ideas of your own. Which would most likely engage you with air pollution is Gosforth High St.
He said something as simple a leaflet to inform his would work. He then said big token acts are very good but if the resident’s/shop owners don’t know what there about then there pointless. I took away from this statement that whatever we propose must be simple to engage people and be well-advertised so people know what it actually is.
He then ended the interview by saying the problem for business is they need to save the high street without killing it.
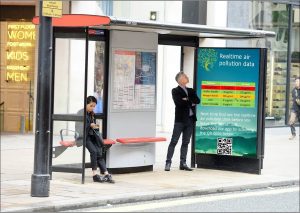
 A Newcastle university urban planning focused bottom up campaign initiative to increase user and community awareness of air quality control centered on Gosforth high street. Working with the users on easy and effective forms of interpreting the data supplied by the air quality monitors situated along the high street, making the data accessible to everybody with the goal of increasing community awareness and support for self-managed air quality control through community projects.
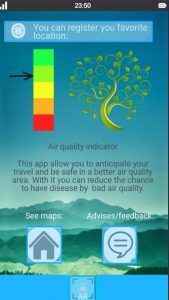
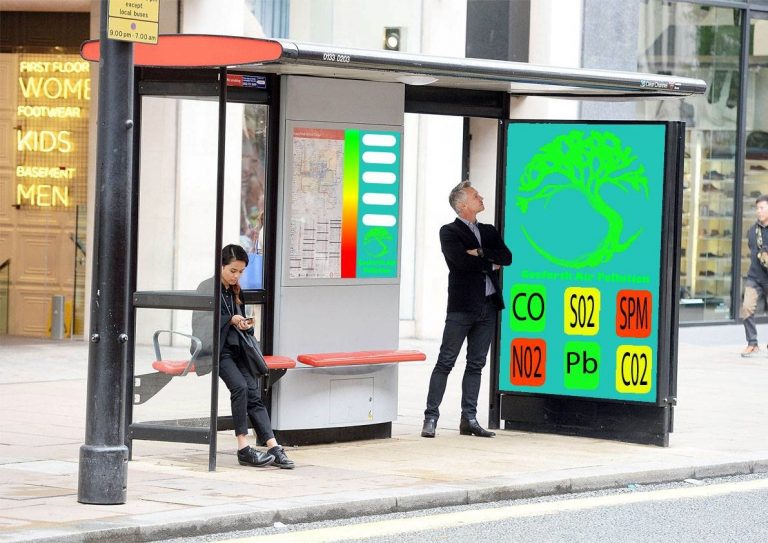
 Besides, there are a lot of data available on a few websites but they are unusable. We think because it’s difficult to understand the data if you are not an expert. For example, for the level of the pollution in air there are only numbers with abbreviations of products. Therefore, to have a better use of data, they need to be more imagery with colours and map for the localisation.