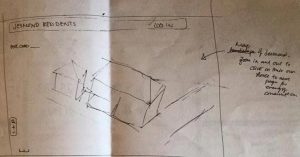
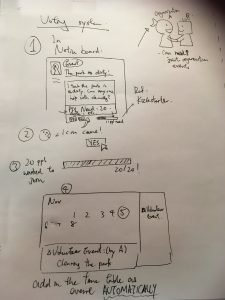
Before we jumped straight ahead into prototyping, the team had reservations about the number of potential conflicting concepts we had. Therefore, we approached the means of storyboarding to set the design in context , which would help us to visualise the app itself and clarify the key function we would like to include for our prototype.
Plot
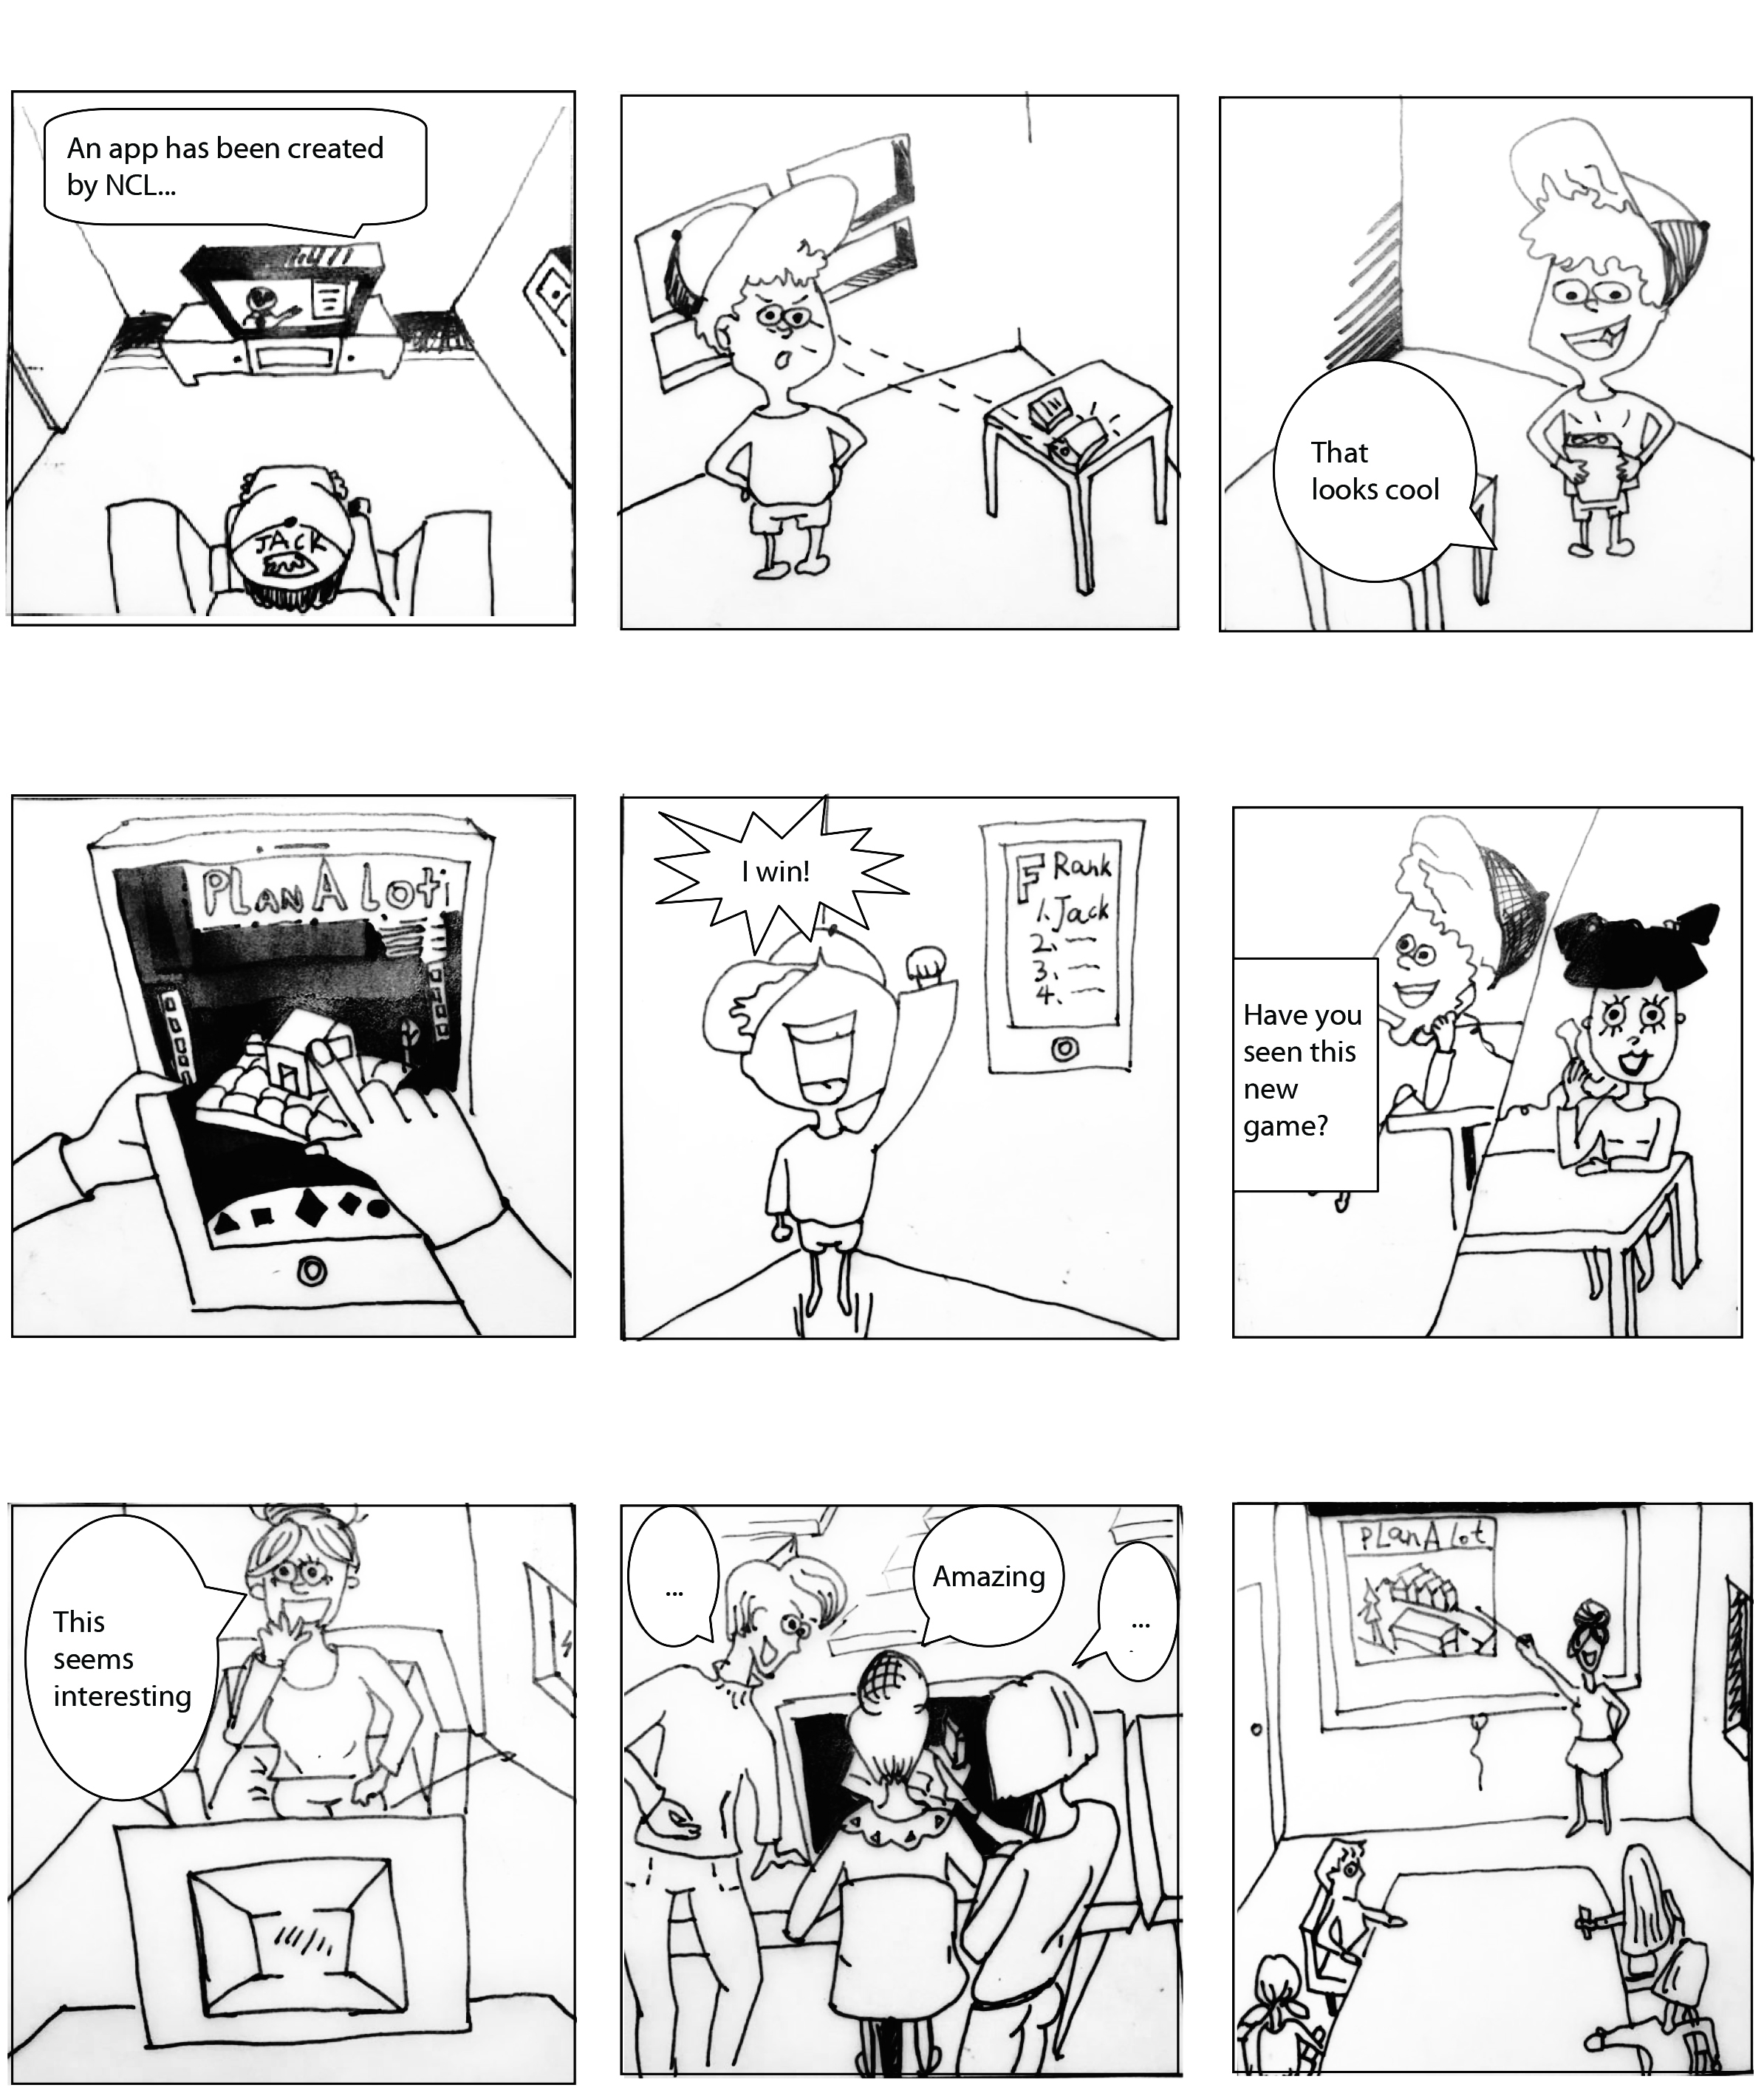
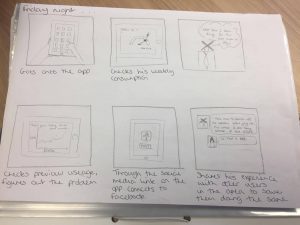
Set: Friday night
After a long working week, our main character, Mr. X went back home and planned to have a chill out night. He then took out his iPad, went on Facebook and starting to browse his wall.
Suddenly, a notification from Jesmond Community Energy Dashboard pops up, saying ‘your estimated monthly bill for the end of the month: £124’. Mr. X was shocked, he didn’t expect to pay that much, since he normally pays £50-70 for a month.
He then went on the app, checked on the energy usage and found out the main source of energy usage was the radiator in the living room, which he always forget to turn it off when he doesn’t need it.
He’d like to share this experience with his family and friends, warning them not to leave any electric applicant on when not using it.
Luckily, there is a share button in the app, making it a convenient way for Mr. X to share it to his friends and family.
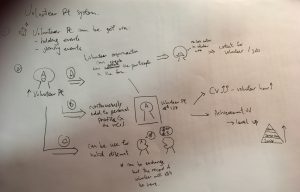
Unfortunately, this was the storyboard specifically for the app only. There will be some alteration so that there’s an influence to install a solar panel for their house, aiming specifically to the Jesmond Community. However, we’ve managed to determine that there are several key aspects that we would like to include in our dashboard prototype.
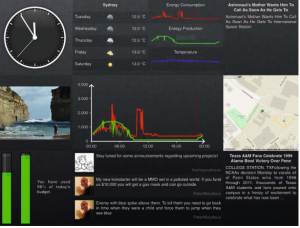
- Monthly Energy Consumption (i.e. the graph that shows how much energy used for the month)
- Estimated Monthly Bill (what all users care about the most)
- Energy Consumption Pattern of user
- Graph that shows the amount of energy used for the past months (Archives)
- Push Notification (smartphones and tablets specifically)
- Social Media Buttons for easy shares
- Of course, some extra minor widgets to add a little spice to the app.
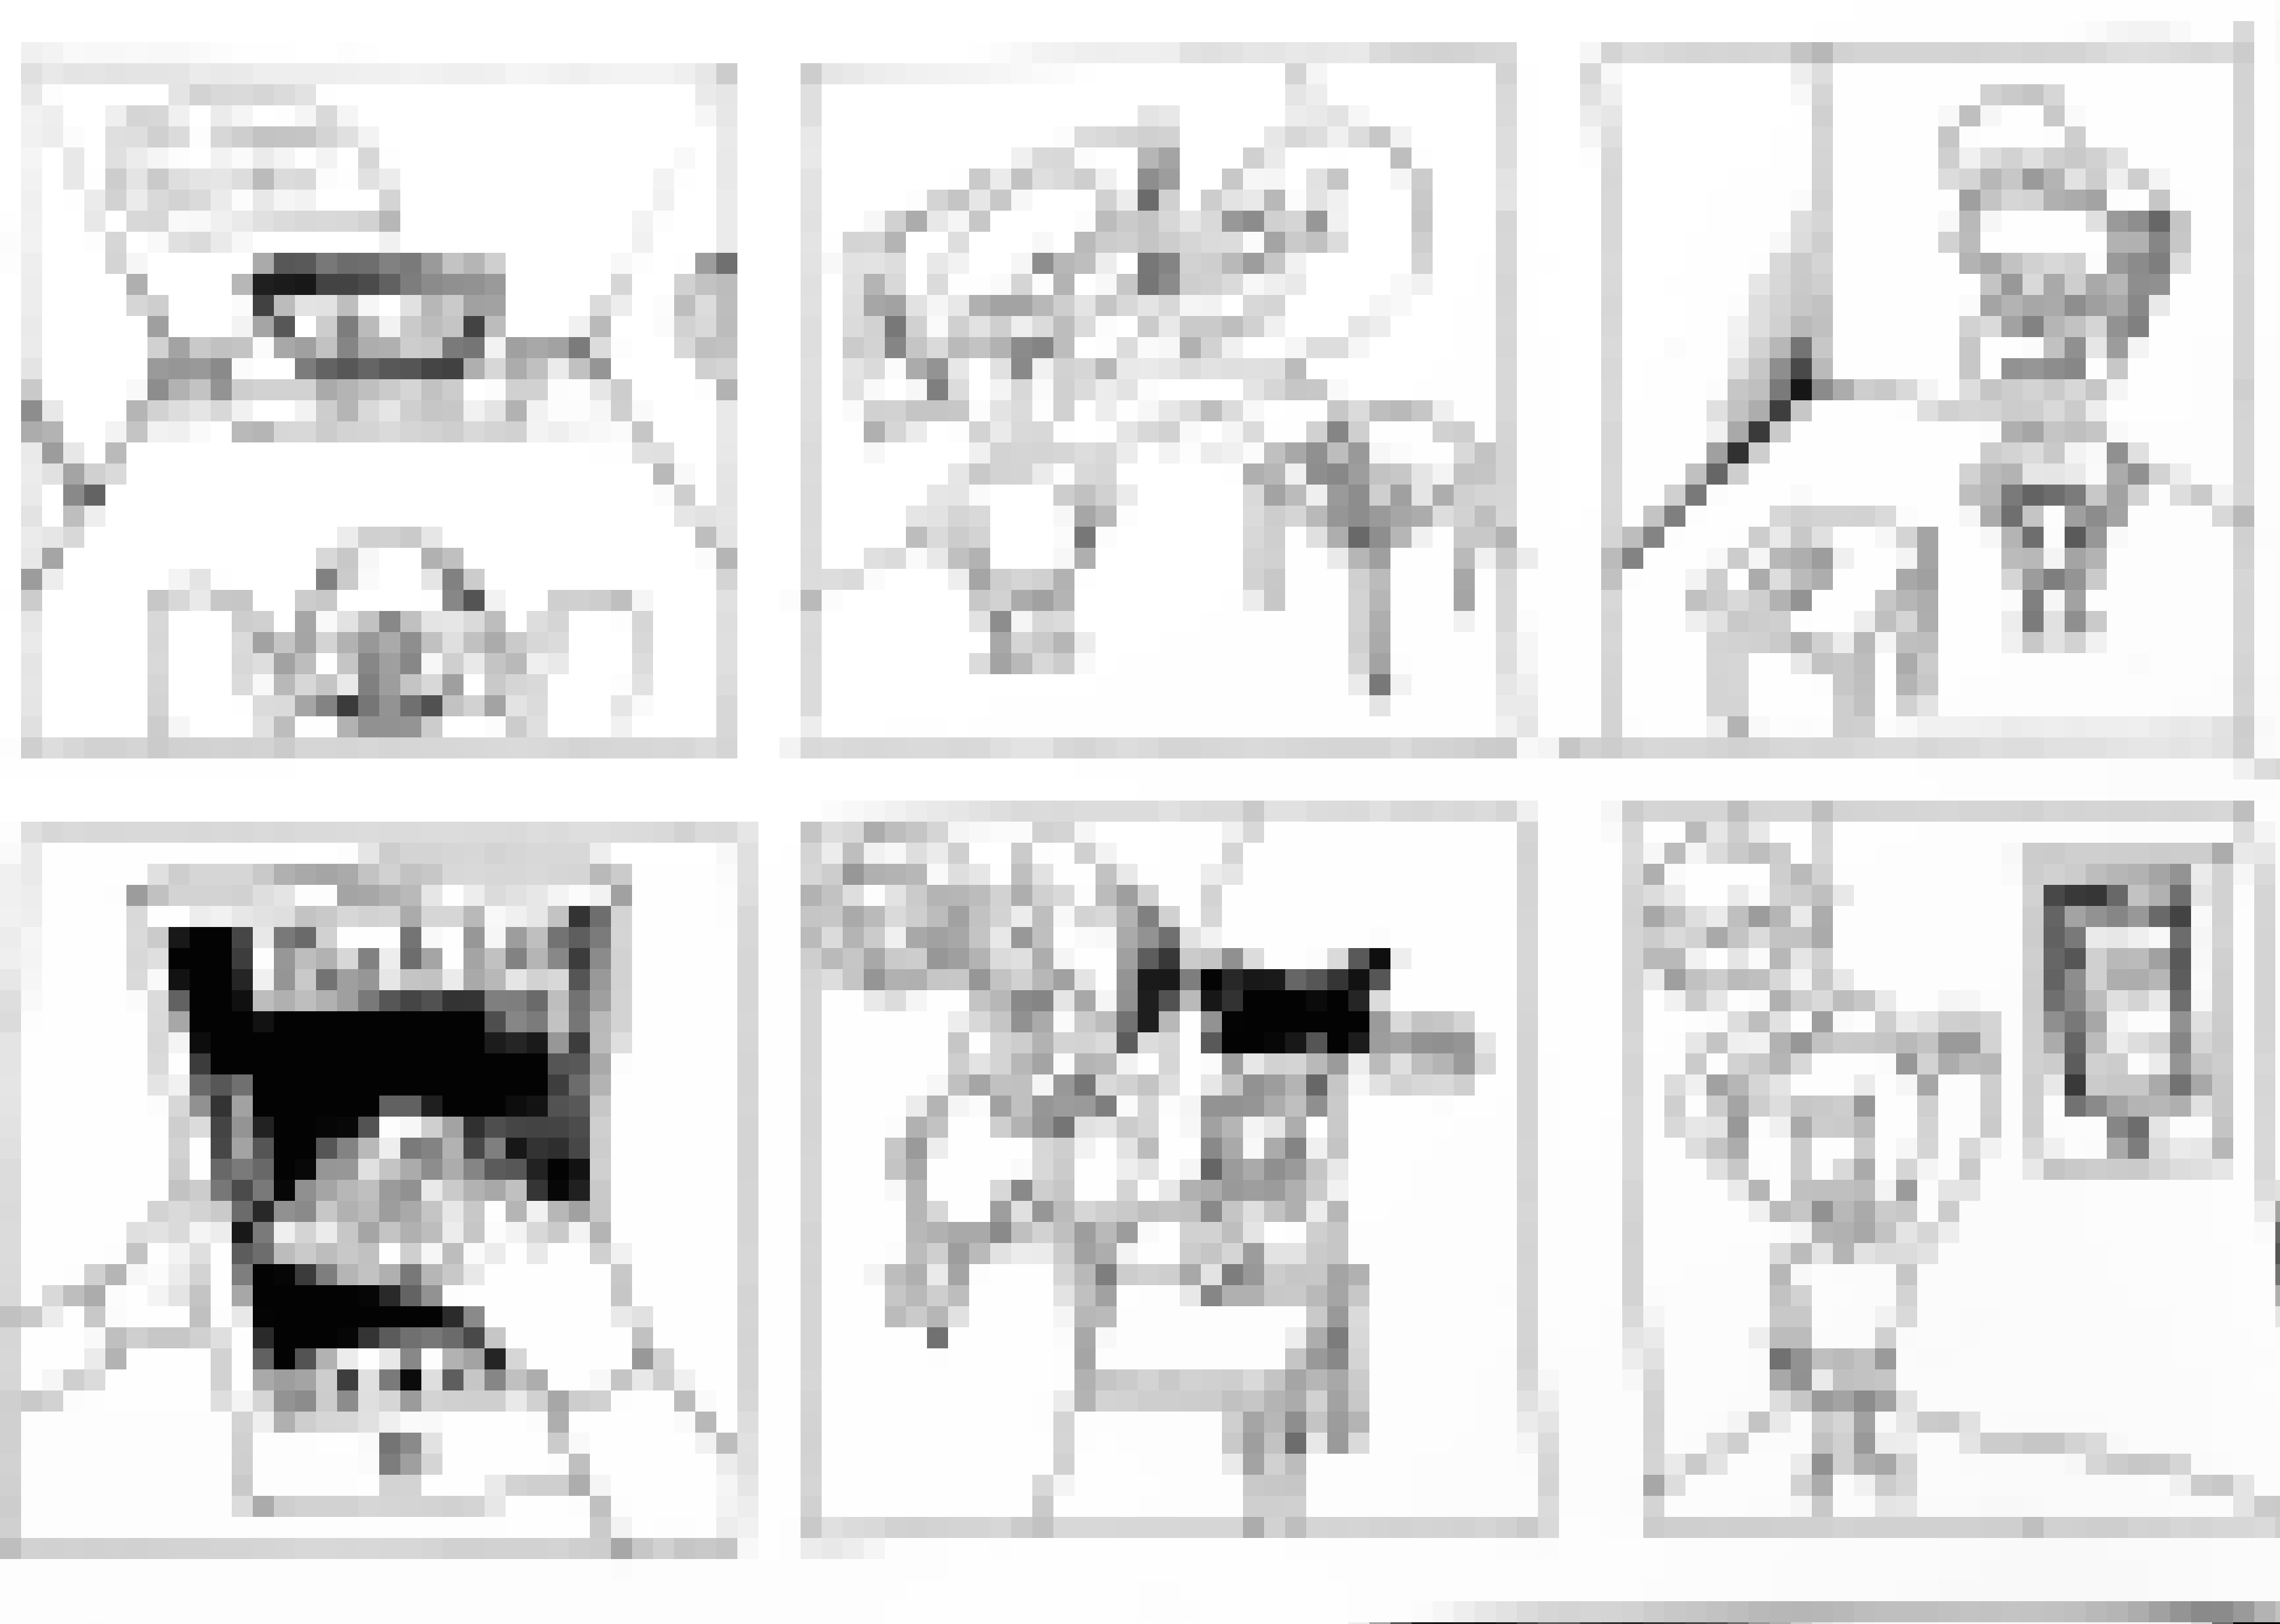
However, after feedback on our first storyboard we as a group decided to alter our storyboard and we now have a new story based on the most important feature of our project which is renewable energy.
The concept is very much the same as previous just slight alterations.
They are as follow:
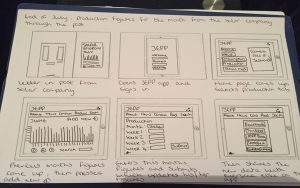
Setting is now end of July and the new production figures have come through from the company, so he/she goes signs into the app, goes onto the production page where last month’s figures for June are present, they then select the add new button which then takes them onto another page where they can enter the new data, once that has been done they can then submit the new data which updates on their production stats. Then finally they share their monthly figures with everyone on the JEPP app to show how much energy they’ve made for the month.
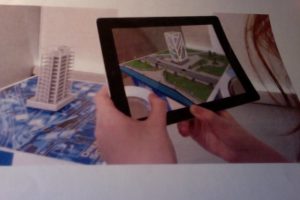
We have now finished with the storyboarding and are now moving on to start thinking about making the prototype, watch this space!