This week we have over 20 NERC sponsored PhD students from across the country studying on a NERC sponsored Advanced Training Course. The students who come cover the whole gamut of NERC sponsored research are looking at how they can use GIS in their research. The course covers spatial analysis, spatial statistics, network analysis, terrain analysis, modelling tools and Python scripting. As well as working hard during the day the students are soaking up the famous Newcastle night life and making life long contacts. Hopefully, following the success of this course we will be able to provide future courses. Watch this space. This course is just one of the portfolio of GIS CPD and training courses that we offer see http://www.ncl.ac.uk/cegs.cpd/ for details.
Category: News
Any news from the group
Geospatial Engineering in the News!

During my recent trip to the 2014 AGU Fall Meeting in San Francisco – see separate post (6th January 2015), myself and colleague Lucy Clarke (of British Antarctic Survey/University of Gloucestershire) were contacted by the BBC Science correspondent Jonathan Amos, who expressed interest in our Antarctic glaciers research. This subsequently led to the publication of an article on the BBC News website which reports on the project and some of work presented at AGU: http://www.bbc.co.uk/news/science-environment-30471542
This NERC-funded project, ‘The spatial and temporal distribution of 20th Century Antarctic Peninsula glacier mass change and its drivers (GCAP20C)’ is being undertaken in collaboration with colleagues at the British Antarctic Survey (BAS), with myself and Prof Jon Mills involved in the Newcastle component. The research is exploiting a unique archive of >30,000 aerial images of the Antarctic Peninsula which date back to the 1940s, enabling assessment of multi-decadal glacier change at around 50 benchmark glacier sites. This is providing insights into the spatial distribution of historical glacial mass balance changes across the Peninsula, which in turn will provide data for BAS ice sheet modelers to better calibrate simulations of future mass balance changes across the AP, and enhance understanding of changes to sea level, and other climate drivers.
The article was one of a number which stemmed from research presented at the AGU Fall Meeting, and even appeared as third lead article on the front page of the BBC website for a period! This reflects the fascinating nature of the research and the human story surrounding the determined, highly efficient and thoroughly professional team involved in the Falkland Islands and Dependencies Aerial Survey Expedition (FIDASE), led by Peter Mott of the former Hunting Aerosurveys. These survey professionals, and accompanying specialised team members, ventured forth into the unknowns of Antarctica over two field seasons between 1955-57. Not only did they undertake extensive and risky airborne missions to capture the photogrammetric imagery which provides much of the foundation for the GCAP20C project, but much of their focus was dedicated to field-based survey and triangulation in and around the South Shetland Islands and the adjacent west coast of the Peninsula. This involved painstaking optical observations by theodolite over extended distances and under extreme weather conditions, with teams often snowed in for days or even weeks at a time. It is this incredible and invaluable legacy from 60 years ago, which allows us to undertake the scientific analysis we do today as part of GCAP20C, and which will enable scientists to better understand the future response and impacts of this region in relation to climate change.
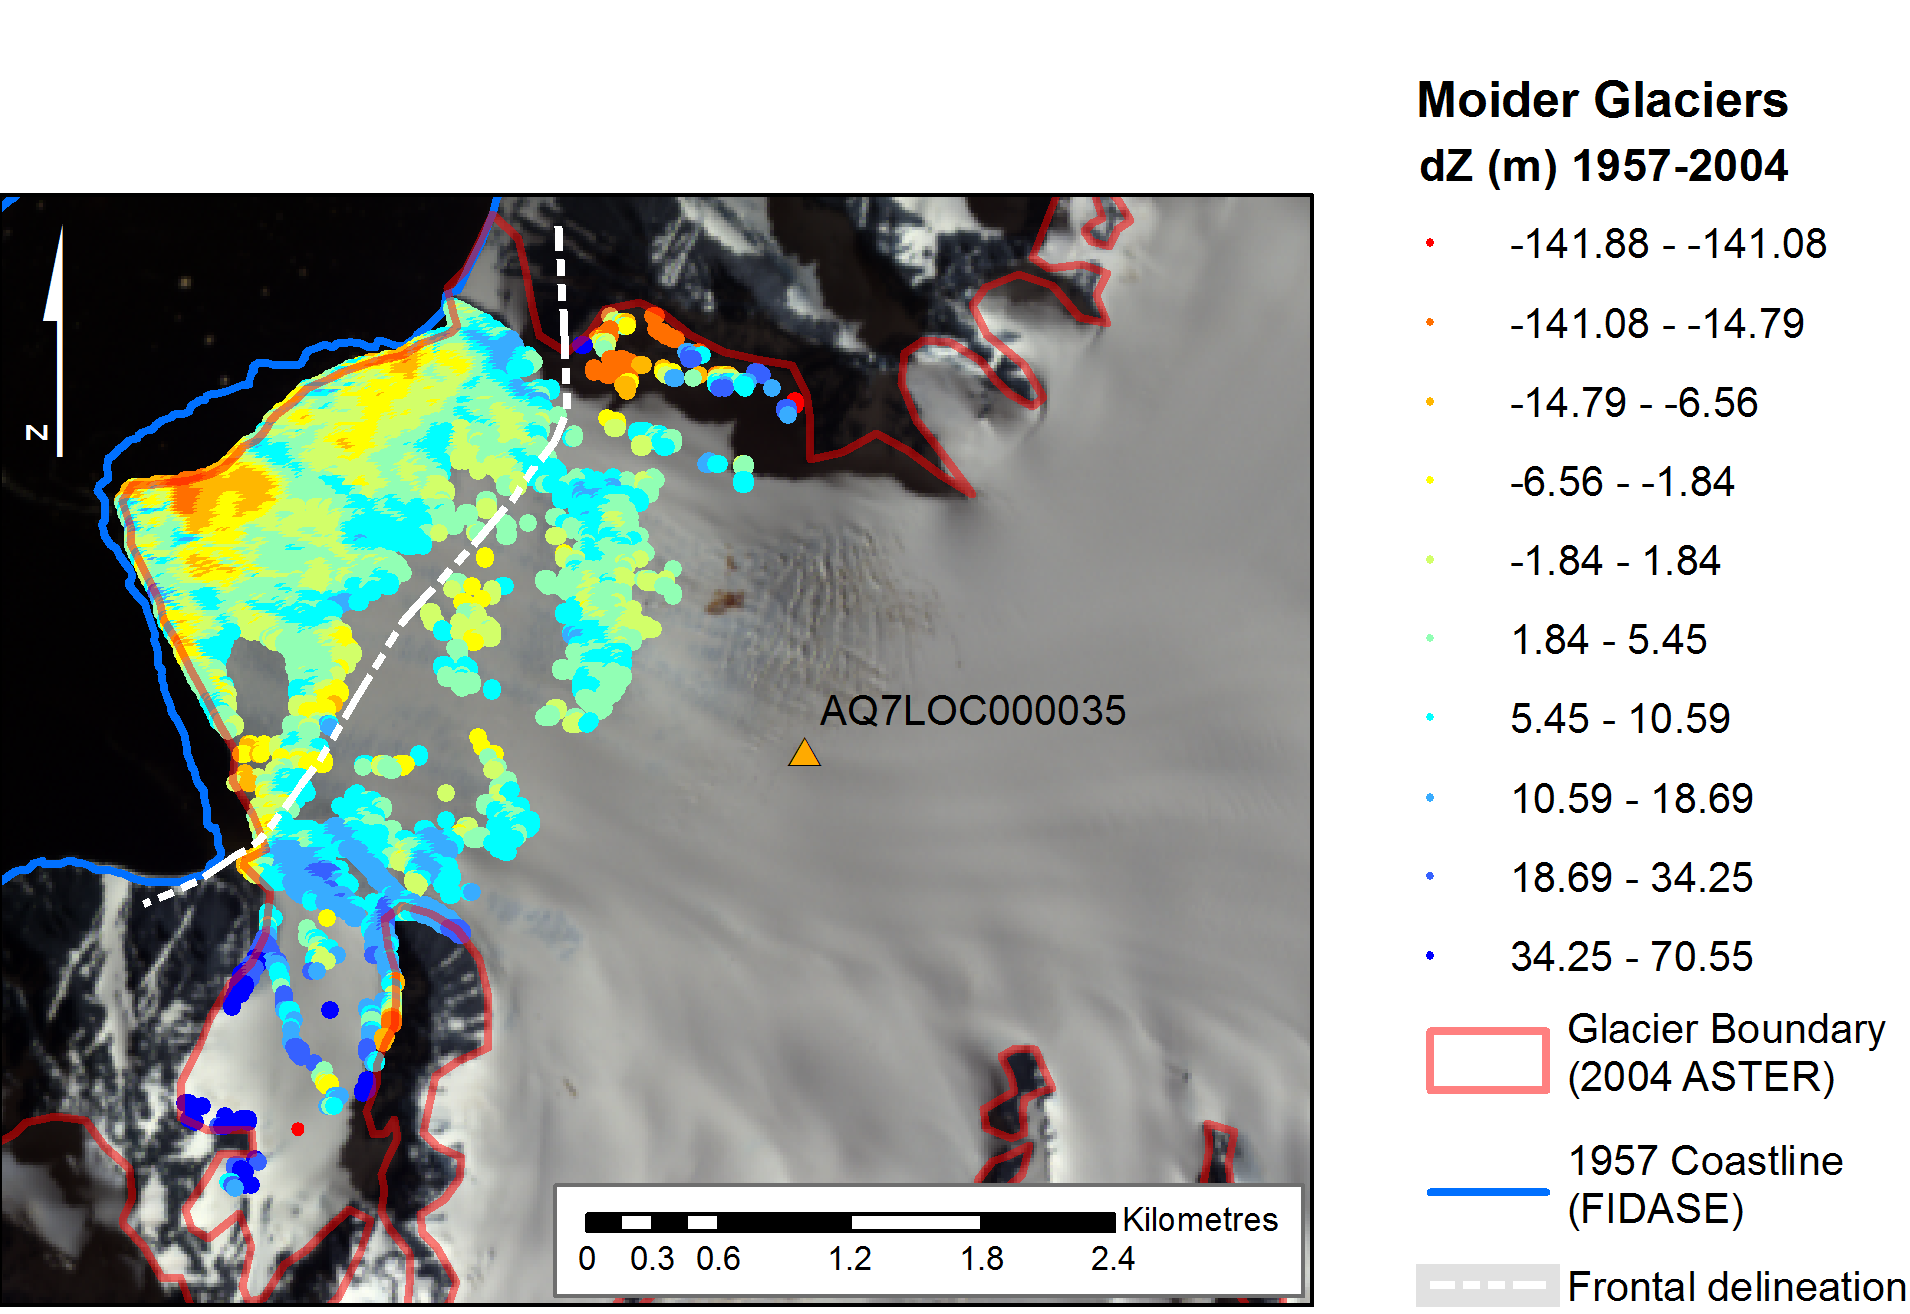
AGU 2014 – San Francisco in December
Immediately prior to Christmas, I was fortunate enough to attend the 2014 Fall Meeting of the American Geophysical Union (AGU) which ran from 15th – 19th December in San Francisco, California. The AGU Fall Meeting is a truly unique experience – the largest earth science gathering on the planet, with 25,000 delegates and a multitude of parallel sessions on an enormous range of topics, from deep ocean science to planetary geology; enormous, hangar-like poster halls with an ever-changing collage of scientific outputs, each one the culmination of months or years of hard analysis (in theory anyway!). Totally engaging, overwhelming, exhausting and inspiring. I was lucky enough to have been awarded an oral slot, and on the Thursday morning delivered a presentation on the results of our ongoing NERC-funded project, ‘The spatial and temporal distribution of 20th Century Antarctic Peninsula glacier mass change and its drivers’ – otherwise known as GCAP20C. Our colleague from the British Antarctic Survey/University of Gloucestershire, Lucy Clarke, was also attending and presented orally on her related work on GCAP20C. Both presentations were well received, and I presented to a sizeable audience in a session dedicated to glacier monitoring using remote sensing techniques. The Newcastle component of the research is quantifying multi-decadal mass changes to a benchmark set of 50 glaciers distributed across the Antarctic Peninsula (AP), exploiting a completely untapped resource of >30,000 archival aerial images of the AP dating back to the 1940s. By comparing DEMs derived from this archival imagery to present-day ASTER DEMs we are able to quantify mass balance, and gain a clearer understanding of the spatial distribution of historical glacial change across the Peninsula. Alongside a more refined multi-temporal sub-sample of glaciers being analysed by Lucy and BAS, this information is crucially important to allow better calibration of models which predict mass changes into the future, and simulate how this would impact on processes such as sea level change.
Over the week I caught up with a few former Newcastle colleagues, including Liz Petrie (now a lecturer at Glasgow University, having moved in September 2014), and my good friend Shih-Yuan Lin (also known as Eric) who studied alongside me when we were undertaking our PhDs at Newcastle – pictured below. It was good to see both, and especially Eric, as our last face-to-face get together was a full 6 years ago now, at the ISPRS Congress in 2008.
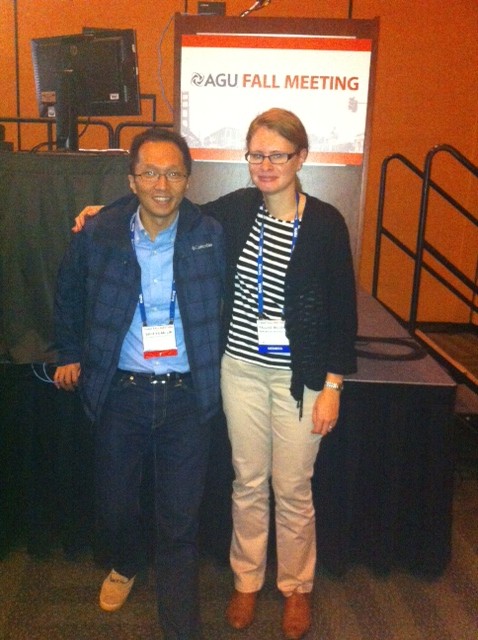
- Pauline and Eric at AGU 2014
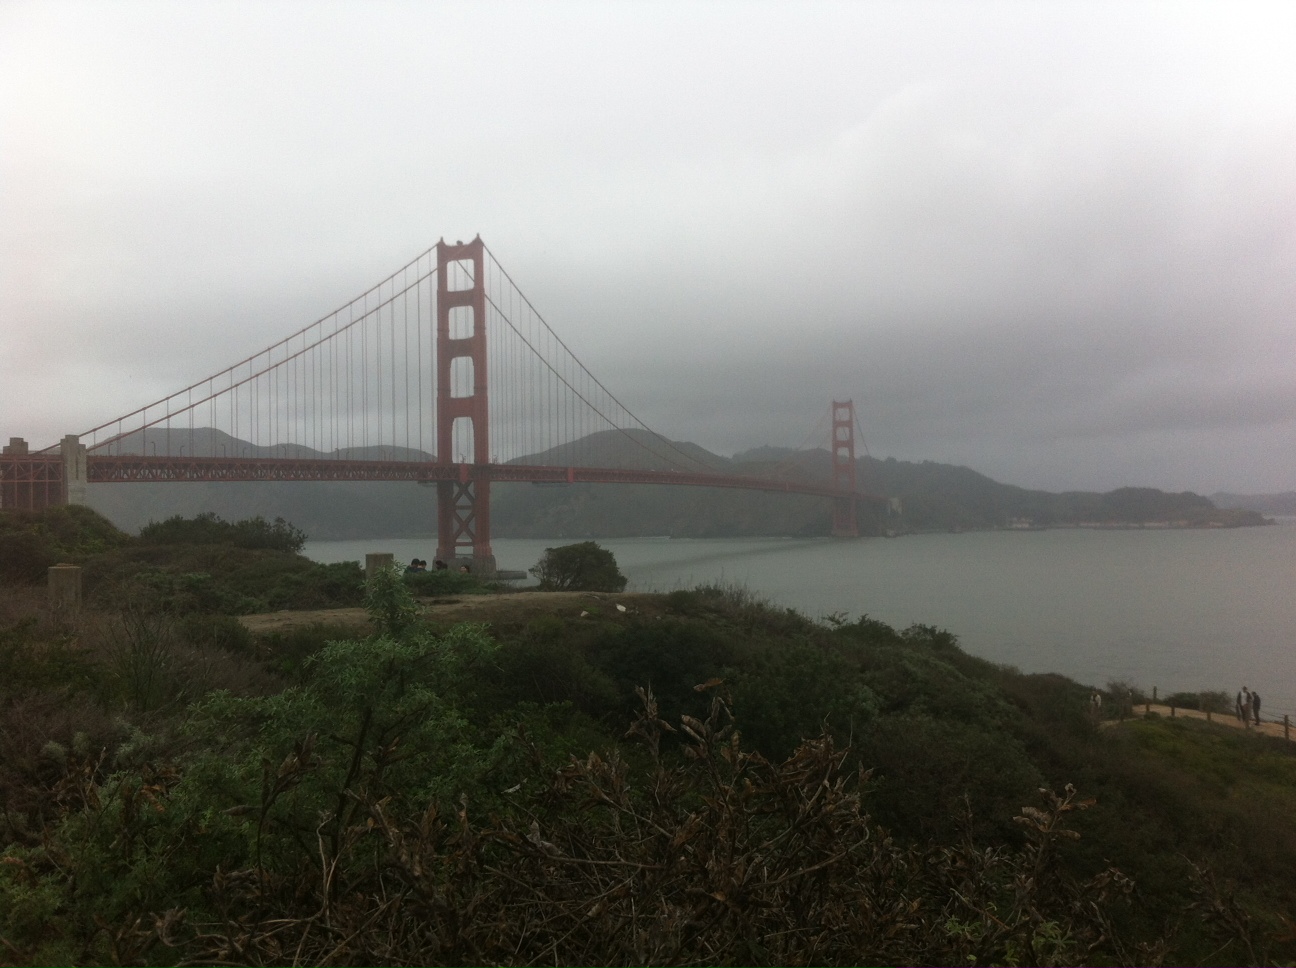
During my only previous visit to the AGU FAll Meeting in 2006, I was unfortunate enough to encounter a week of incessant torrential rain. However, California has been experiencing drought conditions for quite some time, and prospects this year looked more encouraging (for me at least, if not for Californian farmers…). I was hoping for an escape from the cold, icy conditions which had gripped Newcastle in the early weeks of December. Some mild Californian sunshine would have been most welcome. My hopes were dashed however; the grey and misty, but initially dry skies which greeted my arrival at San Francisco International Airport were as good as it got – the rain quickly moved in as the conference got underway, and stayed put for the whole week. Nevertheless, San Francisco is a pretty special place to experience under any conditions, and with my imminent departure from Newcastle to a new job at the James Hutton Institute in Aberdeen, this final trip as an ambassador of Newcastle’s Geomatics group to AGU 2014 will stay with me for a long time to come.
Autumn in the PhD office
To begin with, in September we welcomed three new PhD’ students to our group, Ben Grayson, Lyndsey Graham and Mustafa Hameed. The former, Ben, is used to the surroundings having completed our surveying and mapping science degree (BSc), graduating over the summer. Lyndsey and Mustafa join us from other institutions, adding to the diverse range of students currently amongst the cohort of PhD students. They will soon submit their proposals so look out here for updates on their research subjects.
Back to the more experienced PhD students, Daniel Caparros-Midwood (4th year) attended and presented at a conference in Taiwan on his work in finding the optimal spatial locations for developments given the changing climatic conditions. Also, this week Andrew McClune is attending and presenting in Southampton at an Ordnance Survey’s research event for their researchers, affiliated researchers (including PhD students) and invited guests.
Looking forward within the past month a number of PhD students, researchers and staff have submitted abstracts for the GISRUK (GIS Research UK) conference, being hosted by the University of Leeds in 2015. Being an annual dedicated GIS conference in the UK it usually attracts a good mix of presenters and attendees from a spectrum of backgrounds, with our group usually well represented at the conference. If interested, the conference is still open to submissions for presentations and posters.
Finally, Andrew McClune has been working hard over the past few months in arranging the annual RSPSOC (Remote Sensing and Photogrammetry Society) student and early career researchers conference, wavelength, which is to be hosted by our department in the spring, March 30th – April 1st. The abstract deadline for submissions is 9th January, and for those wishing to attend and/or experience Newcastle, recently voted the UK’s best city (which to be honest we already new!), details will be released closer to the event so keep an eye on this blog, the website, @rspsoc_wlength or @GeospatialNCL.
International Symposium for Next Generation Infrastructure 2013 Conference Proceedings Released
Following attendance by researchers and students alike from the School and group at the first International Symposium for Next Generation Infrastructure 2013, the conference proceedings have now (finally) been released. Please find relevant link to the proceedings, videos, individual papers and more below:
http://ro.uow.edu.au/isngi2013/
Watch this space for more information about the groups attendance at ISNGI 2014…
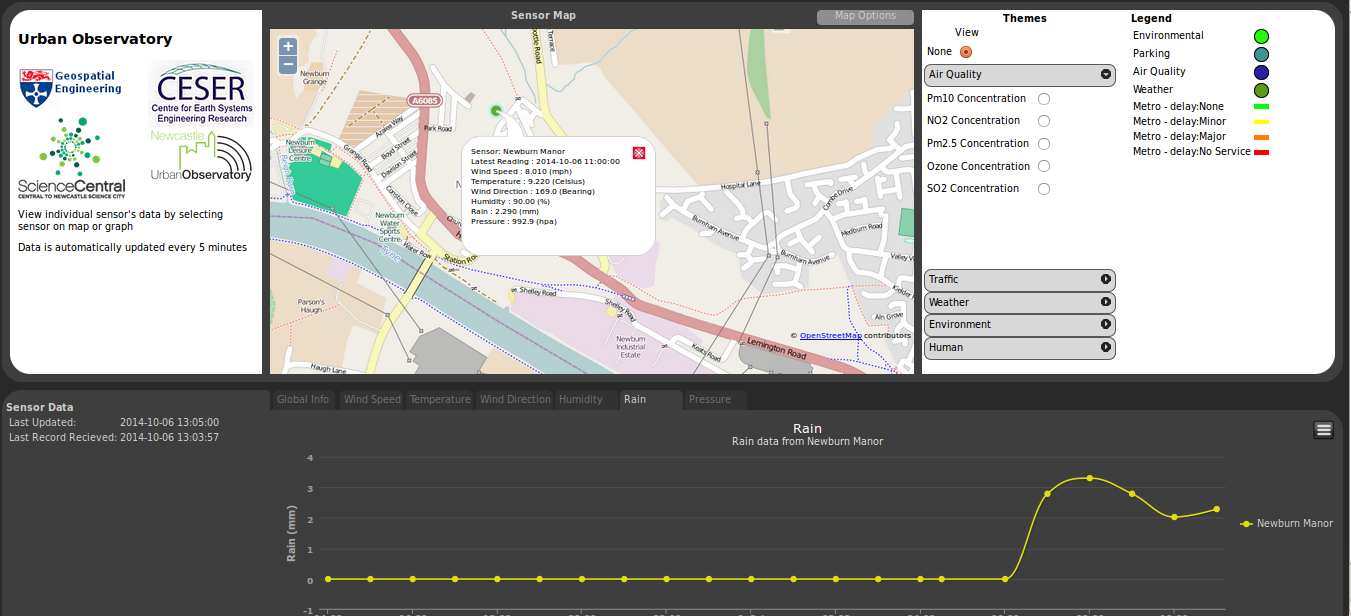
Urban Observatory Portal goes live.
The Urban Observatory programme is deploying sensors and exploring the use of data to help inform the public about city services, and to help researchers better understand how cities work.
The data for this comes from a number of different streams and is held in a schemaless data structure. A python based middleware layer has been developed to ease the interactions with this structure. Facilitating the storing of data, the management of data and also creating different views onto the data.
It is through this middleware layer that a portal has been developed. By using django, the Python Web framework tool. That allows data to be extracted that works with a number of JavaScript libraries e.g openlayers , highcharts.
The portal itself show the location of the sensors, provides graphs of the sensor data. As well as some extra functionality like heat mapping.
 |
 |
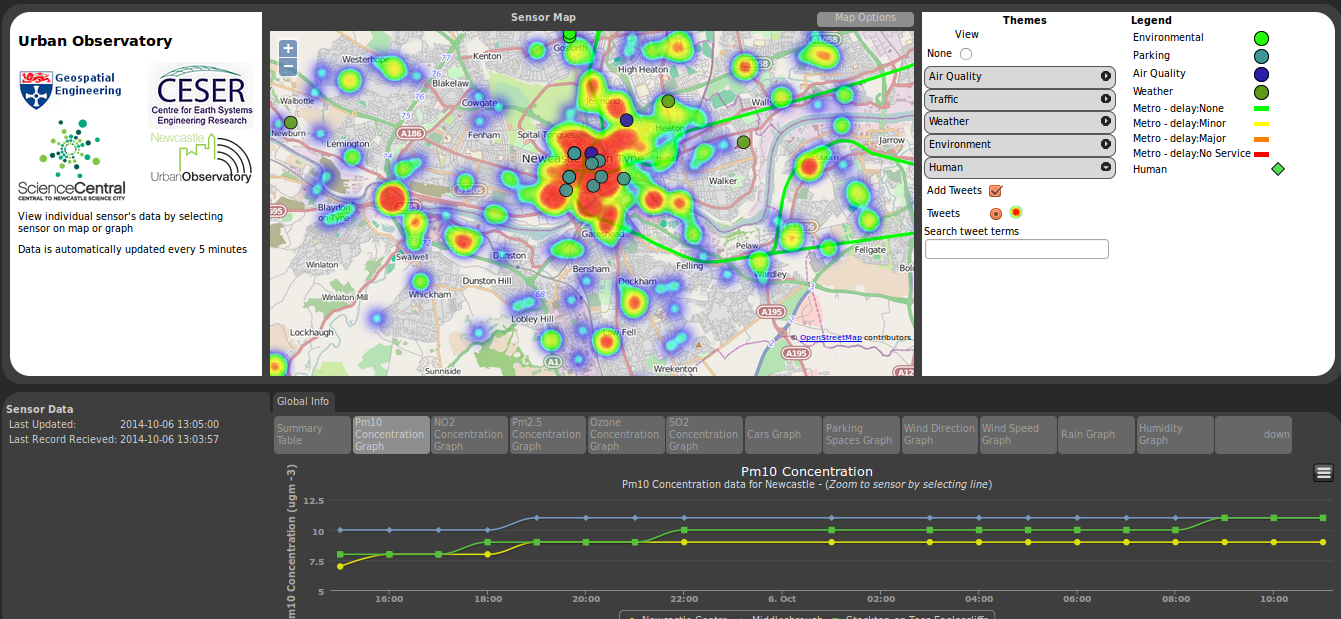 |
With the deployment of a wave of new sensors being planned in the next few months. You should see a few more dots appearing on this map shortly.
The portal is available http://ceg-sense.ncl.ac.uk/lturf/public/
Neil – @neil_py_harris
New PhD students join Geospatial Engineering
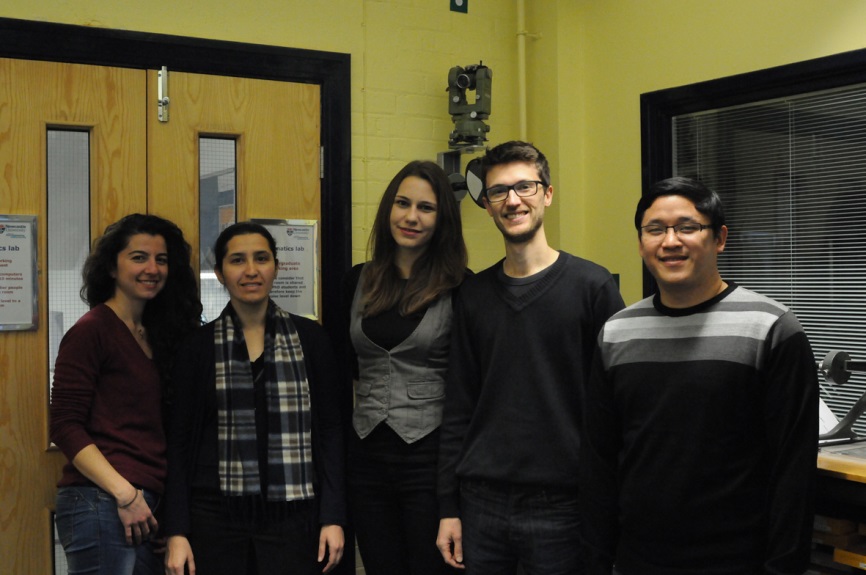
This September saw 5 new PhD students join the Geospatial Engineering group, working in the field of remote sensing and photogrammetry. Magdalena Smigaj is a NERC-funded student working with Forest Research and examining ways to improve early detection of tree health problems, with a focus on detection of disease in UK forests using airborne imagery, LiDAR and data from an unmanned aerial vehicle (UAV). Originally from Poland, Magdalena obtained a BSc in Surveying and Mapping Science from Newcastle University before commencing her PhD. Maria Peppa is jointly funded by the British Geological Survey and EPSRC, and is investigating the potential of UAVs for landslide monitoring, with focus on photogrammetric aspects. Originally a native of Athens, Greece, Maria recently completed a two year MSc in Geodesy and Geoinformatics at The Royal Institute of Technology, Stockholm, so has traded one chilly climate for another in her move to Newcastle. Elias Berra has come to Newcastle following a Masters in Remote Sensing at Universidade Federal do Rio Grande do Sol (UFRGS) in Brazil. Elias is funded by the Science Without Borders programme and will be developing methods for monitoring woodland phenology (seasonal changes) using the School’s UAV. Elias, Maria and Magda will be working together over the coming weeks and months to develop more practical skills related to piloting and planning UAV flights. Polpreecha Chidburee, who goes by the nickname of Aun, is a Thai-sponsored PhD student who will be developing a close range photogrammetric system for rapid assessment of slope instability hazard. Aun is expected to work closely with Maria and a number of other CEG PhDs focusing on slope failure challenges. Finally, Afrah Daham is the latest in a line of PhD students to join the group from Iraq. Afrah, who is sponsored by the Iraqi government, joined the group from the University of Baghdad, where she was a lecturer in photogrammetry. Afrah will be researching the field of feature extraction and building reconstruction from mobile laser scanning data, exploiting a unique mobile mapping dataset acquired for the Newcastle University campus over the summer of 2013.
A summer of SALCA
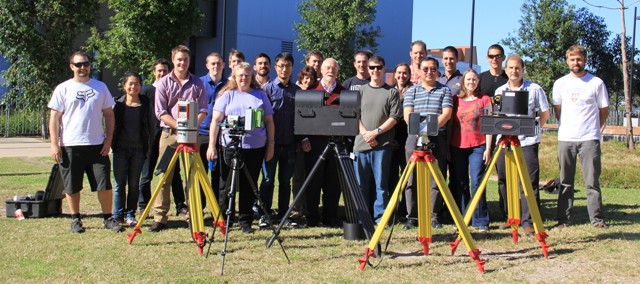
Geospatial Engineering researchers recently took a trip ‘Down Under’ to participate in a unique terrestrial laser scanning inter-comparison exercise. Dr Rachel Gaulton and Dr Steve Hancock joined almost 30 leading researchers from the UK, Australia and the U.S. at field sites near Brisbane in early August to evaluate and compare how five different laser scanners and a range of other measurement approaches can help to measure and monitor forest canopy structure. These scanners included the Salford Advanced Laser Canopy Analyser (or SALCA) , the subject of on-going NERC-funded research at Newcastle, in collaboration with University of Salford and UCL, examining the potential of dual-wavelength laser scanning for assessing forest canopy health.
The exercise, organised by John Armston and colleagues at DSITIA Queensland and CSIRO, was an activity of the Terrestrial Laser Scanning International Interest Group (TLSIIG), a recently formed network of scientists with an interest in forest laser scanning. Alongside SALCA, measurements of three field plots were made with the World’s only other dual-wavelength TLS, DWEL (developed by Prof. Alan Strahler at Boston University with collaborators at CSIRO, UMass Boston and UMass Lowell), the low-cost Canopy Biomass Lidars (named Candi and Bruno and developed by UMass Boston and RIT) and two commercial systems. Photogrammetric techniques also played a part with co-incident measurements made with the AusPlots ‘Photopoint’ method, a system designed to obtain 3D forest structure information from photo panoramas. A report on the exercise featured on Australian TV News .
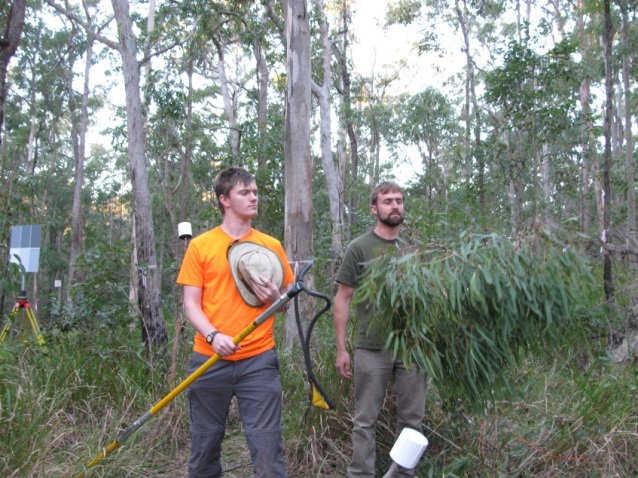
Alongside the high-tech methods, leaf samples from the tree canopies were needed to allow measurement of spectral properties and to test the ability of dual-wavelength data to distinguish leaves and bark – a key factor in producing accurate estimates of canopy structure. Steve joined the destructive sampling team in using a ‘line thrower’ (or big slingshot) to collect the samples and undertook additional sampling to estimate the true leaf area index of a section of heavily laser scanned tree canopy. Work is now on-going to calibrate and compare the data sets, with early results presented by TLSIIG members (John Armston, Crystal Schaaf and Alan Strahler) at the Silvilaser 2013 conference in Beijing.
 |
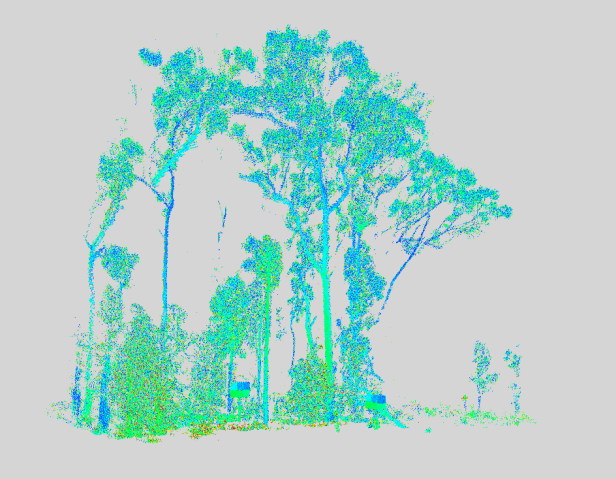 |
| Ian Paynter (UMass) and Steve with canopy samples and the line thrower (left) and a subset of SALCA data from Brisbane Forest Park (right). | |
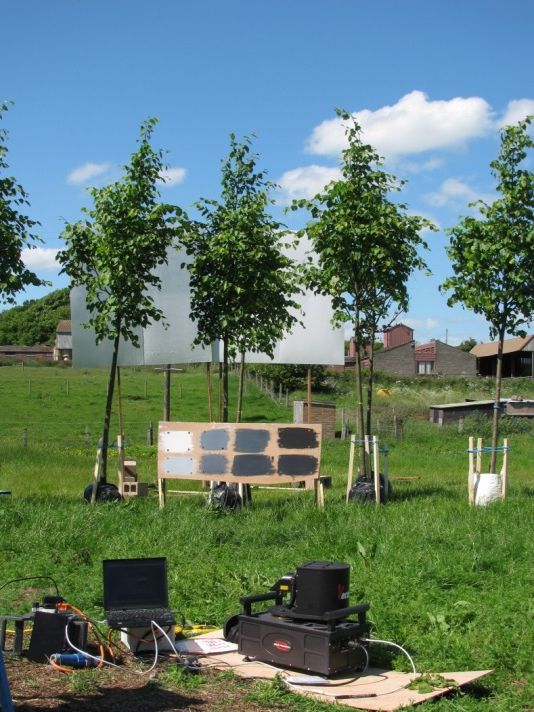
The work in Brisbane followed a month-long field experiment with the SALCA instrument at the University’s Cockle Park Farm. The experiment, part of a NERC-funded research project examining the potential of dual-wavelength laser scanning in forest health monitoring, was focussed on testing the sensitivity of the instrument to changes in canopy water content – an indicator of drought or disease. The canopy-scale experiment at Cockle Park involved subjecting 22 trees to drought stress, whilst making extensive physiological, spectral and laser scanner measurements and preliminary results have recently been presented by Rachel at the RSPSoc 2013 Annual Conference in Glasgow and the 9th EARSeL Forest Fire Special Interest Group Workshop held in Warwickshire.
More information about the SALCA instrument and on-going research can be found in the SALCA Diaries.
 |
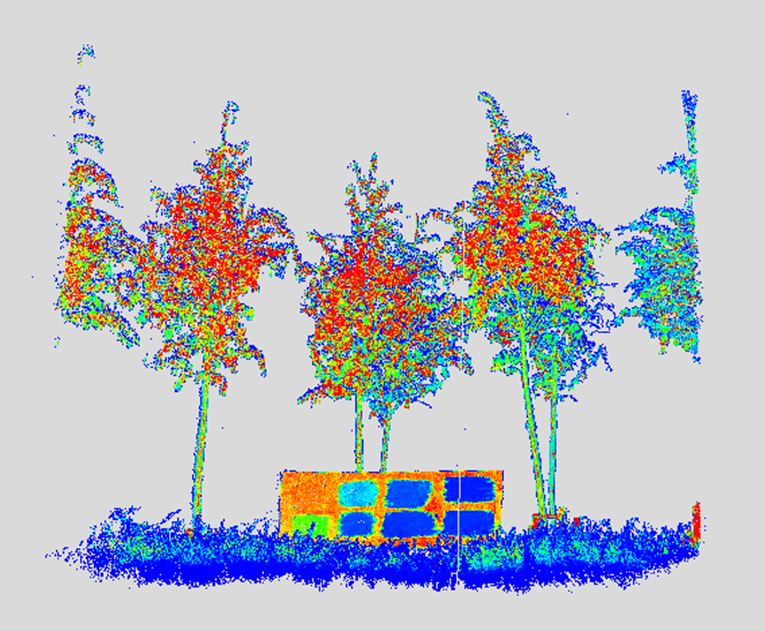 |
| Scanning small-leaved lime at Cockle Park farm and SALCA data from a group of trees suffering drought stress (colours indicate reflectance at 1545 nm). | |
Many thanks are due to John Armston and colleagues for their hard work organising the Brisbane field work. Steve Hancock’s travel to the inter-comparison exercise was funded by a small grant from the Douglas Bomford Trust.
September.. it must be Kielder
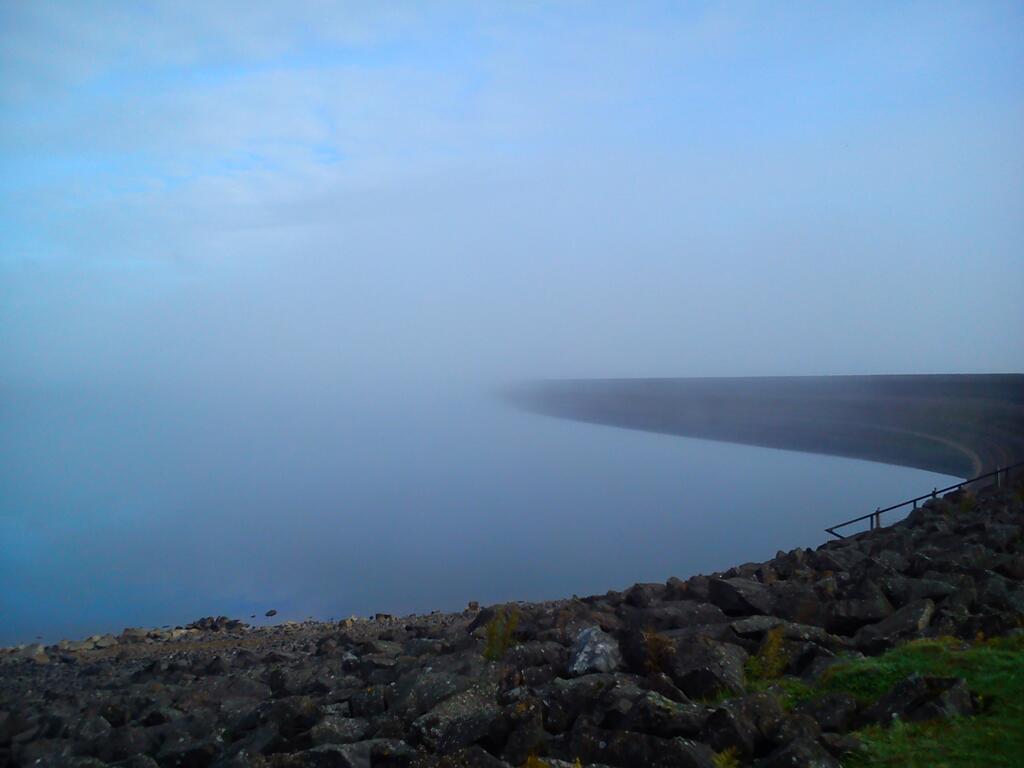
As the leaves darken and the weather worsens, the new academic year starts with a bang as 50 students go off grid in Kielder, Northumberland to develop practical mapping and analysis skills in a realistic setting.
Students from our Geographical Information Science, Surveying and Mapping Science, Physical Geography and Geography programmes spend 9 days collecting and analysing geospatial data using the latest technology. We are based in the Calvert Trust Centre on the shores of Kielder Water surrounded by trees, midges and (well that’s about it…)
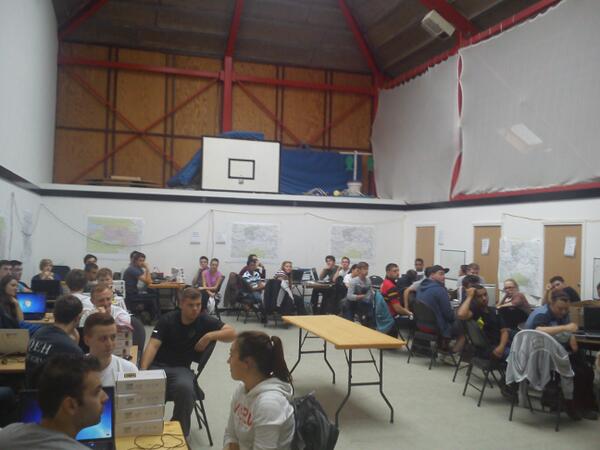
Halfway through the fieldcourse, our students are “in the groove” , occasionally hampered by tricky conditions! Students carry out a mix of detailed topographic survey tasks, DEM creation, Landuse mapping using remote sensed imagery and planning a new residential development site. We are very grateful to the landowners and people of the Kielder valley who make us welcome each year. So far, the torrential downpours of 2012 have been absent and conditions have been more benign, but there is time yet…
Google API-powered heatmap viewer of student visitor numbers at Newcastle University Open and Visit Days
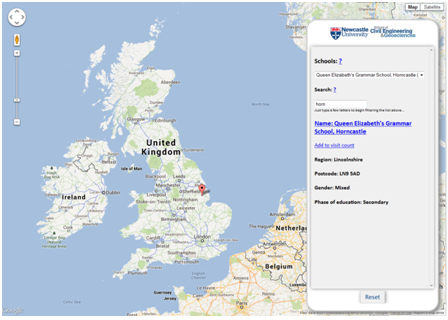
As part of the School of Civil Engineering and Geosciences involvement in University student recruitment activities, prospective 6th form and college students can attend Open and Visit Days. These days give students the opportunity to come and learn a little bit more about the courses that are offered at the University, including those taught within the School. Within Geomatics, prospective students are given some experiences of what it might be like to study Geographic Information Science (GIS), or Surveying and Mapping Science (SMS) Undergraduate courses via a handful of taster exercises. These exercises are designed to enable staff members to talk about some of the basic concepts that a prospective student might learn about should they decide to apply and study GIS or SMS.
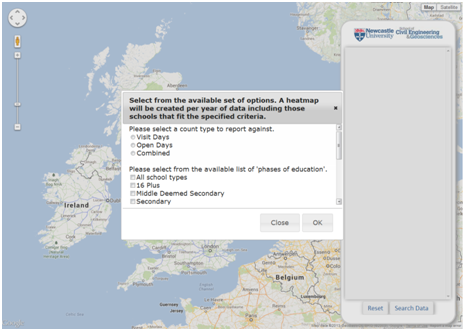
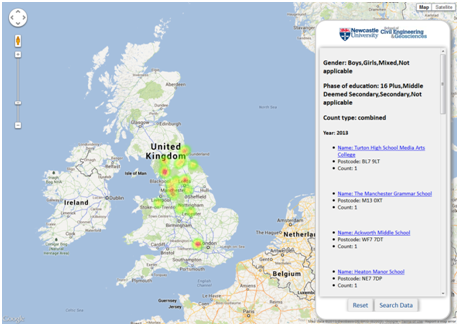
A key student recruitment activity within the School and more widely the University, involves the coordinated marketing and distribution of promotional materials focussed on Undergraduate courses to different colleges and schools around the UK. In order to better understand how the School’s involvement in this activity leads to prospective students attending the University Open and Visit Days, thus showing an interest in the courses on offer from the School, a very simple web-based tool has been developed to record where prospective students are travelling from on Visit and Open Days, by recording against the school or college at which the student attends. However not only does this begin to allow recruitment staff to understand how marketing activities are leading to prospective students attending the Visit and Open Days, it also doubles as a taster exercise in explaining some of the basic concepts of data capture, management and visualisation that a student would learn more about within the GIS and SMS courses. A prospective student is able to search for the school or college that they attend from a geocoded set of more than 60,000 schools, and then subsequently increment a count against that particular school for the particular year in which they attended a Visit or Open Day. All this information is stored within a PostGIS-enabled PostgreSQL relational database, and is served out to the webpage via JSON following the use of standard SQL queries to query the underlying data. As a result a prospective student, as well as recruitment staff, are able to create custom Heat Maps (intensity, not temperature!), all powered by the Google Maps API, of their data, or data from previous years. The query interface allows different HeatMaps to be created based on sub-selections of school type, gender (boys only, girls only, or mixed gender schools) and years of interest.
For clarification the database stores no other information about the student other than a count against a particular school or college at which the prospective student attends, and the addition of new information is protected behind a username and password. The following images give some illustrations of this interface and tool: