In August 2020, we sent out a tweet on the new GEDI Forest Canopy Height map. https://glad.earthengine.app/view/global-forest-canopy-height-2019
We have been asking ecologists to check how well the map captures vegetation height variation in their study landscape. And if they can, to send feedback on the map. Simple steps as example: Download the data from here: https://glad.umd.edu/dataset/gedi/. Aggregate tree height data collected on the ground in 30 x 30 m plots (or 20 m x 20 m if that is what you have) – as mean and max. Extract the height value from the map (GEDI Height) and compare to your field derived height values at plot scale (In situ height).
Remember that pixels seem to code: forest height (pixel values between 0 and 60), water (pixel value: 101), snow/ice (102), no data (103).
Why? Understanding key constraints of a map derived using earth observation data is crucial for ecologists. Prior to designing their study as well as for interpreting following data collection.
Below you will see the feedback shared by the community. And at the bottom of the page, we highlight the tutorial pointing to GEDI GLA2 data products, from which you can derive your own height data for further analyses or even validation (thank you to @ArmstonJohn).
Key summary points will updated here, as we go along (if it takes off that is :)).
- map producers: GEDI data overestimate forest height on slopes within temperate and subtropical mountain grasslands, e.g. in New Zealand and Lesotho. Tree height over cities and suburbs may be confounded with building height, as GEDI data do not discriminate between the height of vegetation and man-made objects.
- @lauraduncanson: the GLAD product is a landsat prediction of GEDI heights, with a caveat that the model saturates (Duncanson et al. 2010. https://www.tandfonline.com/doi/abs/10.5589/m10-037 . @mikewulder: request copy at researchgate for researcher to researcher use.
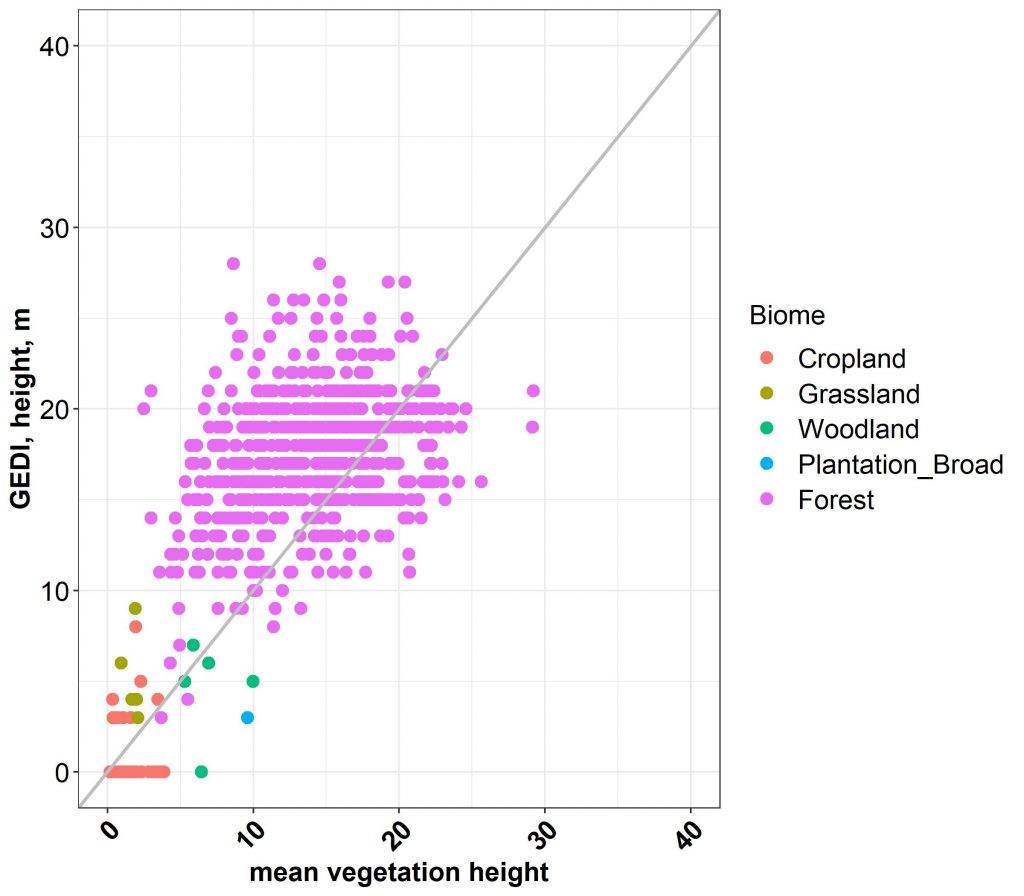
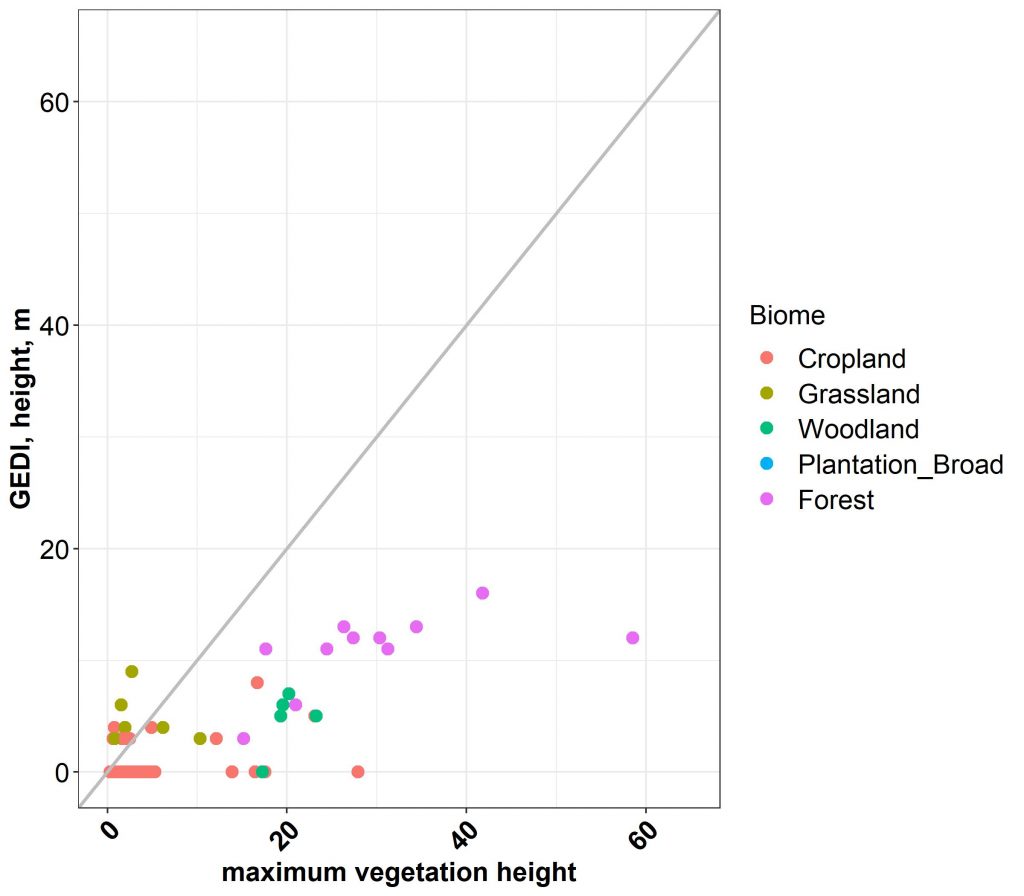
- for our landscape in Tanzania (fig. 2): GEDI overestimates vegetation height in low height stands such as shrub/bush/Miombo woodland. It underestimates tree height in taller forest stands, even in the lowlands
Owner: AgrisysTanzania project & Force project
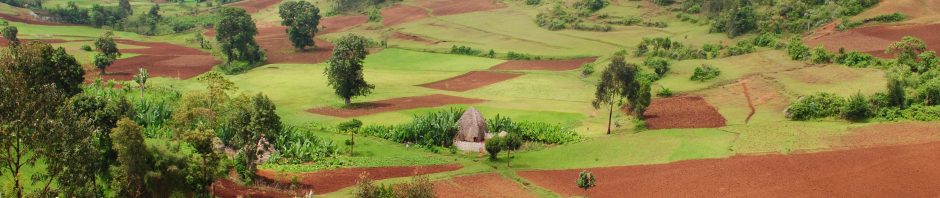
Location/Time: Kilombero Valley (northern part), Tanzania. 72 plots across range of vegetation types (Agrisys Tanzania project) in the valley and remaining plots located in the Udzungwa Mountains forests and the lowland Magombera Forest Reserve. Field data collected between 2015 and April 2020.
What is shown: plot (20 m x 20 m) derived vegetation height (m) compared to GEDI top of canopy height (m). Forests plot located in the valley and on the slopes of the Udzungwa Mountains.
Owner: AgrisysTanzania project
Location/Time: Kilombero Valley (northern part), Tanzania. 72 plots across range of vegetation types (Agrisys Tanzania project) in the valley. Field data collected between October 2019 and April 2020.
What is shown: plot (20 m x 20 m) derived vegetation height (m) compared to GEDI height (m). Across cropland with tree/shrub plots, grassland with tree/shrub plots, plantation forest and lowland forest. All located in the valley (no pronounced topographic gradient).
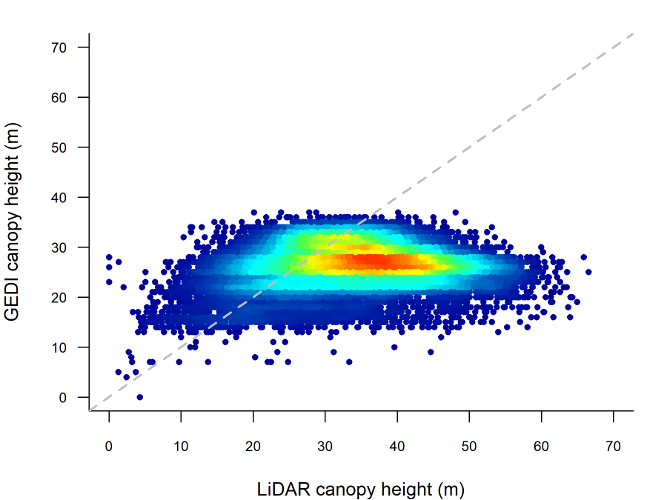
Location: Sepilok, Sabah, Malaysian Borneo
What is shown: Comparison shows ‘GEDI’ vs airborne LiDAR resampled at 30 x 30 m. Mature tropical forest with large local variation in canopy height driven by a steep soil gradient.
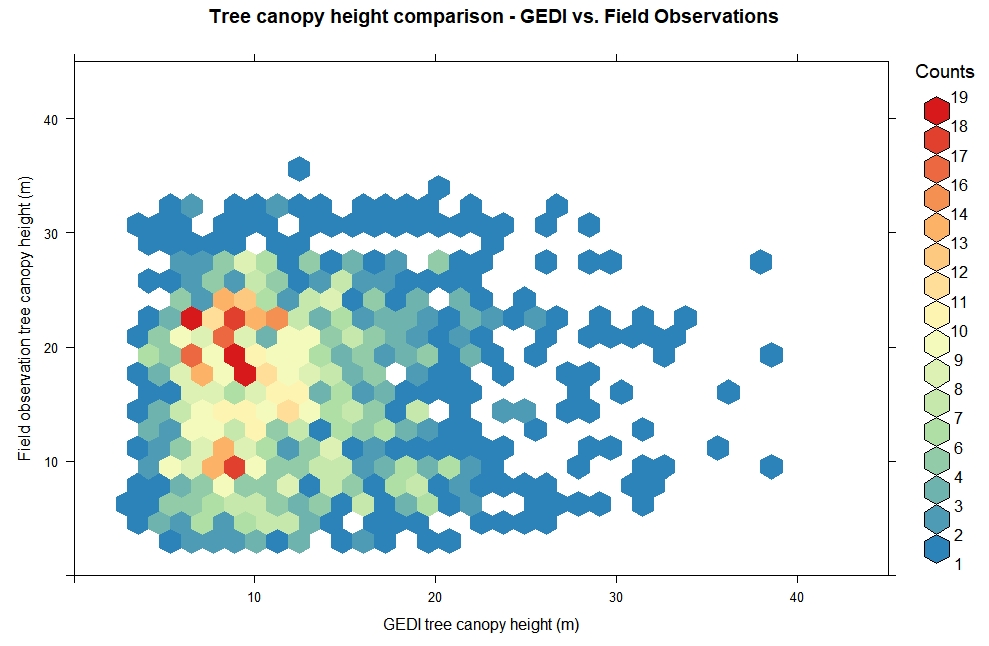
Location/Time: Sample plots (N = 1,414) in the western and central Himalayas (Nepal and Pakistan). Field data collected between 2014 and 2016.
What is shown: Comparison shows ‘GEDI top of canopy height map’ vs field derived tree height measurements (circular plots of ~1 ha).
If you want to work with the GEDI Height data (GLA2 data) directly instead of using above created (modelled) top of canopy height map: @ArmstonJohn recommends this tutorial.
LP DAAC have made available Python Jupyter Notebooks that provide some guidance : https://lpdaac.usgs.gov/resources/e-learning/getting-started-gedi-l2a-data-python/#L2A (see 4.4 for extracting alternative height metrics)