

What is Knovel?
Knovel is a technical reference database that provides access to core engineering handbooks and tools. It allows students, researchers and professionals to take material and property data, and to analyse it quickly and intuitively.
Our previous blog gives a general overview of Knovel’s main features and content, describing how it empowers engineers by offering a trustworthy source of information and data. But there is so much more you can do with Knovel using the interactive and visualization analysis tools. Alongside their data and technical information the tools let you manipulate and extrapolate data from within your browser and export it into your work in whatever format is most appropriate for your requirements. These tools allow you to interact more with the materials data within Knovel, so the data becomes much more discoverable and useful for your studies and research.
Creating a free, personal Knovel account allows you to save the work you do with these tools too. You can also save searches, graphs, tables and more, picking up right where you left off if you need to take a break.
What are the interactive tools?
There are several powerful tools that allow you to interact directly with the huge sets of data and properties in Knovel. Carrying out a simple search of material properties will give the option to select interactive tables or graphs. This video from Knovel gives an overview of the interactive tools available.
Interactive Tables
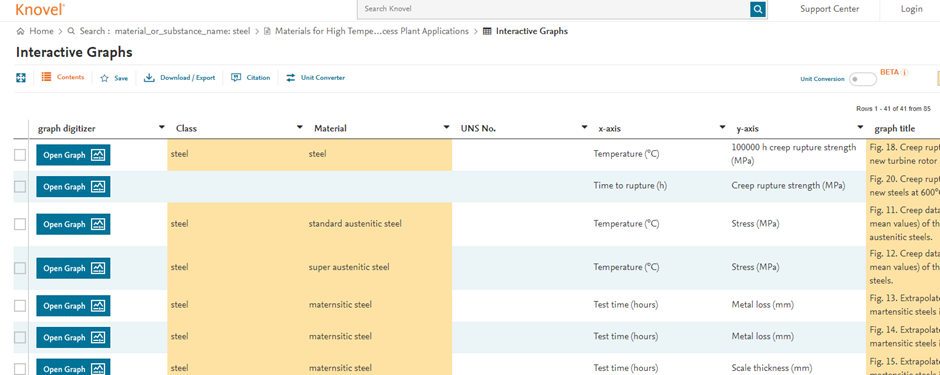
The tables within Knovel can be overwhelmingly huge in scope, needing filtering to start to work the data into something useful. The interactive table tool allows you to filter and sort columns of large datasets, as you would a spreadsheet, but within your browser. You can hide, move, and lock columns, and quickly go from a broad search looking at the property of a material, for example steel, to a table you can adjust and save or export for inclusion in your work.
Graph digitizer
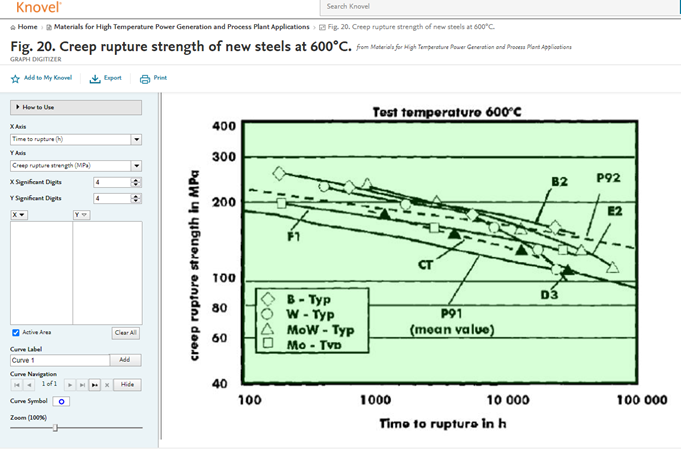
Knovel includes a wealth of crucial engineering handbooks and has digitised the graphs in these titles. This allows you to extract and export data from digitized curves, enabling you to open any graphs in a separate view where you can extract data points, adjusting the parameters to get the information you are interested in. You can define points on the curve by clicking directly on the line, or by using the navigation panel to specify exact points, and you can define the axis with the other axis adjusting automatically. You can then add points, curves, or elongation data, and manipulate as needed before saving or exporting in a format suited to your output.
Equation plotter
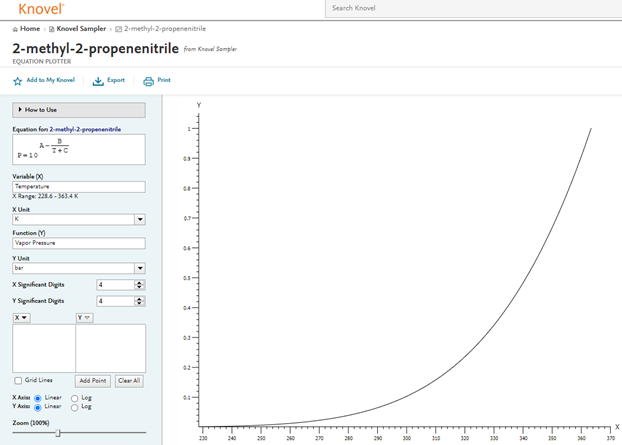
With so many example equations in Knovel the plotter function lets you visualise parametric equations and then manipulate them in several ways, such as plotting curves from the equation. When you run a search for material properties and choose a table, then selecting the equation icon will open the plotted equation for you to work with. You can then add points to particular values, change units, and work the data.
Interactive equations
Knovel includes vast collections of example equations for application in engineering. You can navigate all disciplines by specialty, browse the full collection, or filter by equations in the general search.
The interactive equation tool is browser-based calculation software. It can help you get the solutions to problems faster, by letting you work with the online equation as you would in your own workbook. The equation worksheet functions as a space to explore and relate data back to your own work. You can also create worksheets for searches, combining text with images and plots. Watch the video from Knovel below for more information on interactive equations.
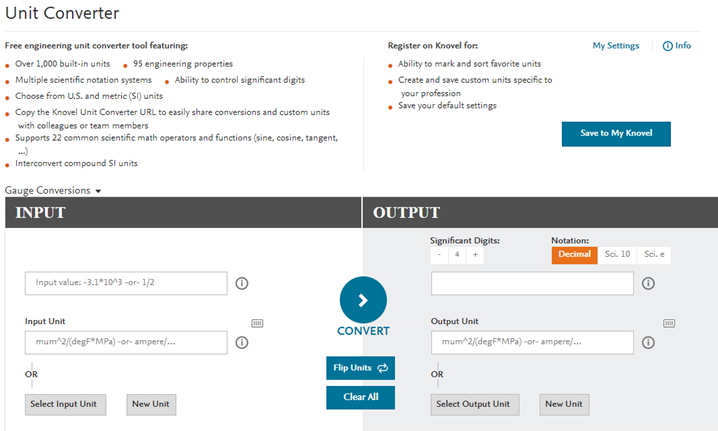
Unit converter
This is a simple tool, but especially useful as it is integrated throughout Knovel to help you work with the data. It draws on a range of units, properties, and scientific notations systems. Easy to access and to use, it will help make sure you are working to the correct equivalents.
Steam calculators
Presented as a series of 8 calculators, this recent addition allows fine control of a full range of thermodynamic variables, under a variety of conditions, for results determining steam table data. With support for ranges of temperature, pressure, and quality, it lets you work out the required conditions for achieving the quality of steam needed. Watch this video from Knovel to learn more about Steam Calculators.

More information
You can get further help with Knovel on the Knovel LibGuide. You’ll also find links to Knovel, and additional support within the Library’s Subject Guides for all Engineering, Science and Computing disciplines.
Contact your Liaison Librarian for any further questions around getting the most from Knovel, and for other ways we can help support you in your studies.