Following a successful trial of the resources in 2022-23, we have added two additional modules to our SAGE Research Methods collection. Through the Library you now have access to a host of guidance, worked examples, teaching resources and practice materials from SAGE Research Methods, SAGE Research Methods Video, SAGE Research Methods Datasets and SAGE Research Methods Data Visualisation.
Datasets
SAGE Research Methods Datasets is a collection of hundreds of teaching datasets and instructional guides that give you the chance to learn data analysis through hands-on practice.
This new resource is a bank of topical, practice datasets, indexed by method and data type. For academic staff, the datasets have been optimised for use in your teaching and can be used for in person teaching or within Canvas materials. This will save you the time of sourcing and cleaning data for use by you and your students.
The decisions researchers make when analysing data can be a mystery to students embarking on research for the first time. Through practicing analysis using real data from SAGE Research Methods Datasets, you can see how analytic decisions are made, helping you become confident researchers.
- Quantitative datasets are taken from surveys and experiments and come with instructions to analyze the data in SPSS or R.
- Qualitative datasets are taken from academic research projects, providing bite-size examples from interviews, focus groups, documentary sources, and more, plus advice on how to approach analysis.
You will find lots of guidance on how to get the most out of the datasets module on the SAGE Research Methods LibGuide.
Data Visualisation
SAGE Research Methods Data Visualisation will help all researchers, from beginners to more advanced practitioners develop the fundamentals of data and design necessary to create impactful visualisations. Through a series of practical video tutorials, text guides and practice datasets, the resources will help you identify the chart types that best fit your specific data story.
Researchers increasingly grapple with complex or big data and need to present their data in an understandable, easy to interpret, and informative way to disseminate their research successfully. Mastering the skills and techniques of data visualisation is, therefore, key for any researcher. This new resource will help you and your students to communicate data with impact so that audiences can grasp difficult concepts or identify new patterns and relationships easily.
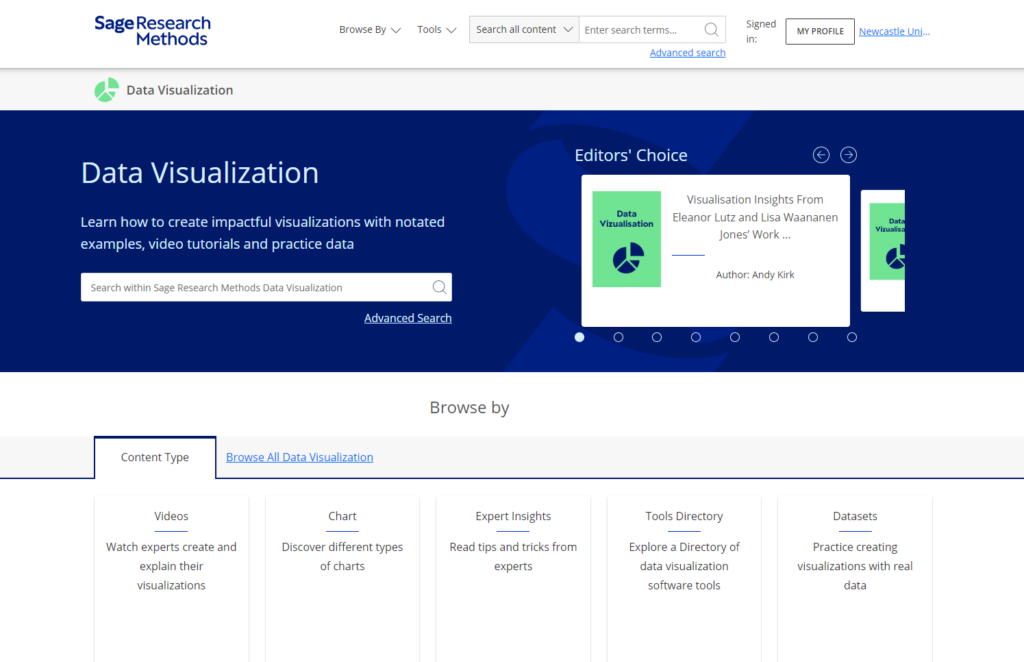
You are able to search and browse by data and chart type to find how to guides and explainer videos, explore a directory of data visualisation software and access datasets to help you practice communicating data.