Toilet Trouble is the must-have family game this festive season. Determined not to be flushed away by their families, our Mathematics lecturers, Dr Andrew Baggaley and Dr Nick Parker got ahead of the game to analyse the seemingly random sequence of flushes and squirts.
On Christmas morning many families will wake up to a rather unexpected gift from Santa Claus: “Toilet Trouble”. This does not involve an emergency call to your local plumber or your GP, but is rather a family game devised by Santa’s most mischievous elves.
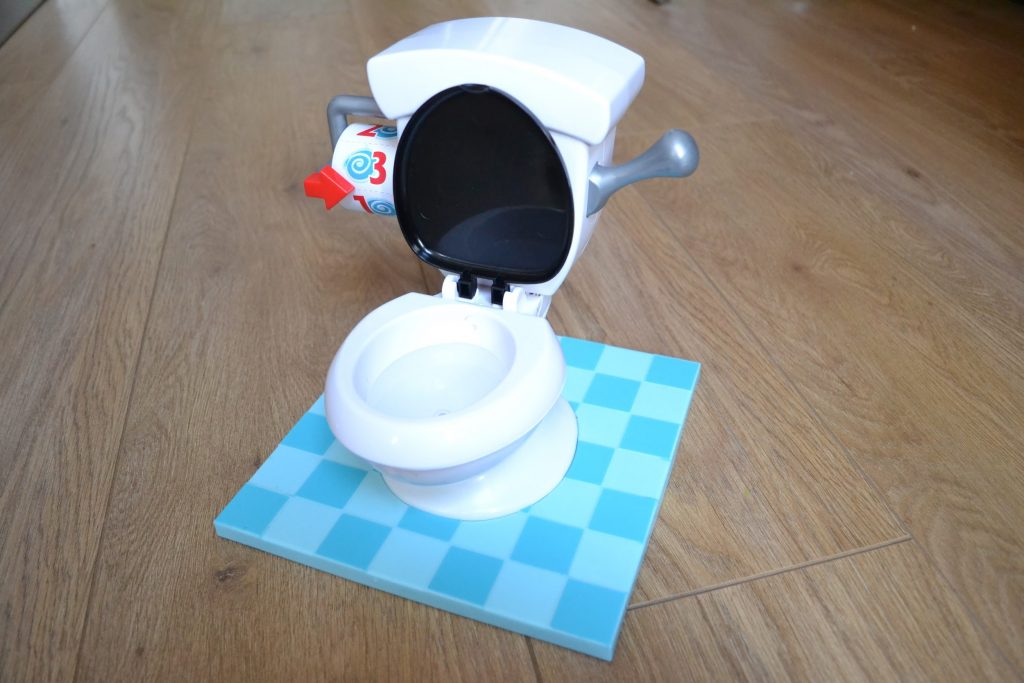
Each player nervously awaits their fate as they place their face over the toilet bowl and flush the handle. If they are lucky, they breathe a sigh of relief at staying dry and the suspense moves to the next player; if they are unlucky, a jet of toilet water comes to greet them. Is this squirting truly random or is there some hidden order? Can the occurrence of the next tinkle be predicted? And can you beat the odds to stay dry, while soaking your nearest and dearest? Here we self-proclaimed wizz kids combine scientific experimentation and mathematical analysis to give you the edge in this festive problem.
We put the game to the test by flushing the toilet over 1000 times and noting whether the jet squirted or not. The data was conveniently recorded in binary format as a series of zeros ( = no squirt, dry) or ones (= squirt, wet). The dataset, shown below, appears random with no evident pattern. However, just because it looks random, is it random? A large area of mathematics is devoted to analysing such patterns, seeking out hidden order and the information that this may carry, from identifying the trends in stock markets to deciphering information embodied in secret communications. On the flip side of this latter example is the branch of mathematics which creates the codes in the first place; cryptography designs tricks to hide information in a jumble of numbers. Central to this are the “pseudo-random-number generators”, mathematical functions which produce a seemingly random series of numbers but which are nonetheless orderly mathematical functions – if we start the function from the same number we will always get the same random-looking series of numbers being produced. In this sense, the numbers only appear random. An everyday example of pseudo-random-number generation is when we play our music tracks on shuffle. Interestingly, however, a good generator would mean that there was a chance that the same number (music track) would be produced twice in a row, or within a short interval. For example if you create a random playlist from a 10 track album, there is a 10% chance that you would have to listen to the same track twice in a row. To avoid this unwanted effect, the original number generators used for shuffling had to be tweaked to prevent the same track arising in close succession.
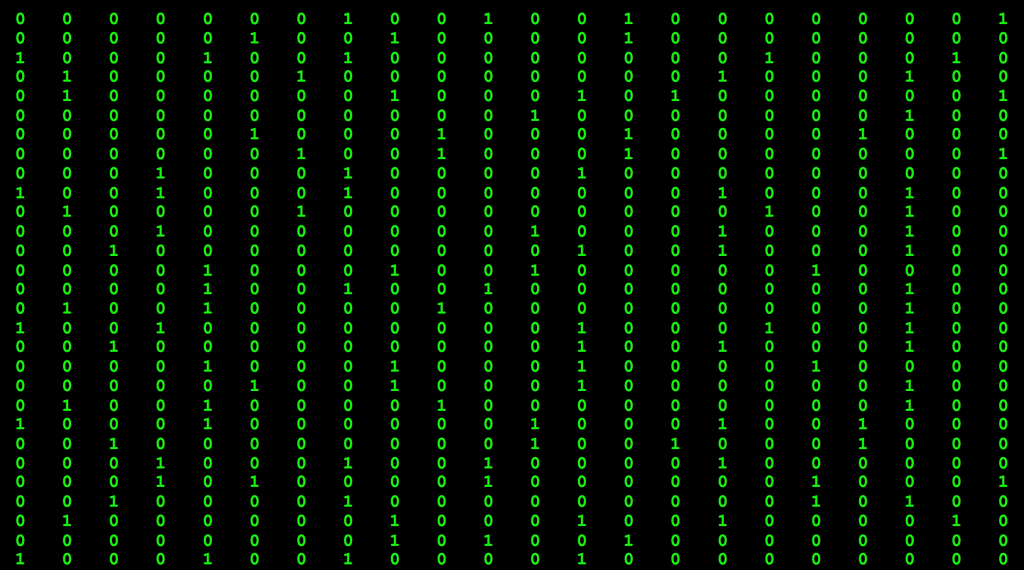
We return to the matter at hand – the “random” squirting of the toilet. As is typical of scientific analyses, we begin our analysis at the most basic level, before drilling down to increasing detail until we reach a required level of understanding of the problem. From the data (see image) it is evident that the squirts (ones) are relatively spaced out. In other words, at each flush there is not an equal 50:50 chance between squirt or no squirt – the chance is biased towards not being squirted, which is some good news for the players. Our 1000 flushes produce 196 squirts, informing us that, on average, there are 5.1 flushes between squirts. This doesn’t help us to identify whether or not there is a pattern to the squirts, and so next we look at the number of flushes between squirts, shown below. Several important features now become evident. There is not an equal chance of a squirt for all number of flushes, and this allows us to ascribe a confidence/concern scale. If it is your turn to flush immediately after a squirt has taken place, you can give your most cocky grin at the toilet bowl and your fellow players – no squirts arise on this turn. If you flush on the second, sixth or eighth flush after the previous squirt, you can smile with a confidence at the bowl – these turns have less than 5% chance of squirting. If you take the fourth flush, then have your towel handy – this leads to the highest chance of squirting, over 30%. Finally, if you are about the take the tenth flush then brace yourself for a guaranteed soaking since all squirts happen within ten flushes.
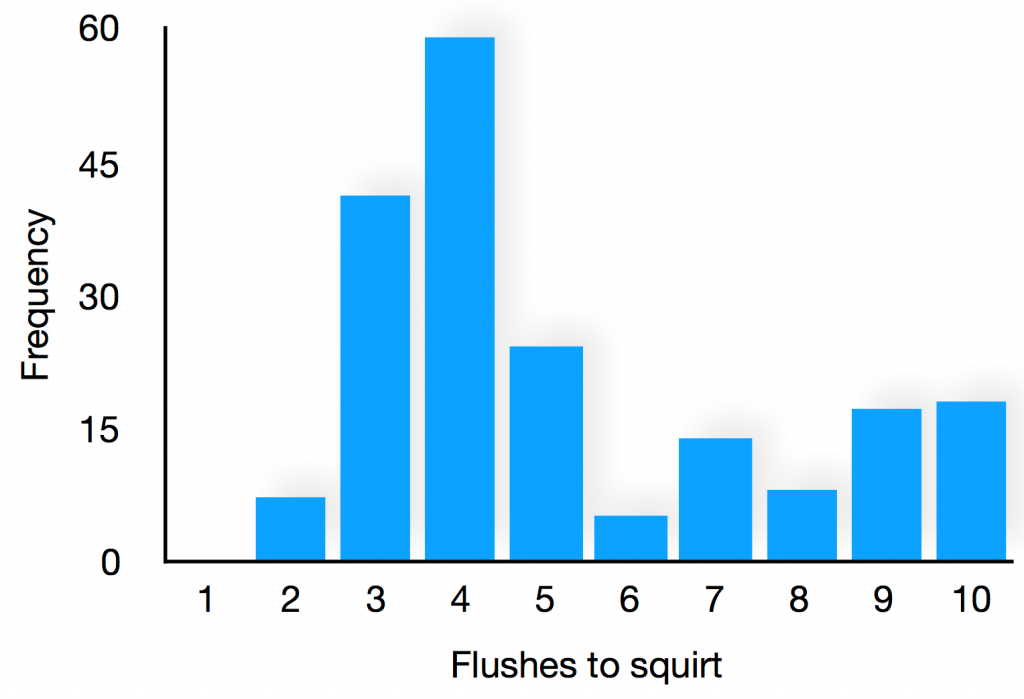
If the squirting were entirely random, then the distribution in the histogram would be flat; the fact that it varies indicates that there is some hidden order which, for example, favours the fourth flush and suppresses the first, second, sixth and eighth flushes. Closer examination of the squirting reveals a pattern in which the squirting fires around the 10th, 3rd, 4th, 8th, 4th, 4th and 5th flushes. This pattern then repeats. So the squirting is orderly after all, it is just the irregularity of this pattern that creates an illusion of randomness.
So how random is our game? In order to understand this we can compute the entropy of the squirt signal, a single number which will quantify this. If you have met the idea of entropy before then it was probably in the context of disorder. Indeed one of the most important laws of physics tells us that the natural tendency of any isolated system is to become more disordered. Leave a young child in a tidy bedroom and they will soon provide a definitive proof of this.
However we can also apply this idea to a random signal. Imagine flipping a fair coin lots of times and noting down a 1 if it is heads and 0 if it is tails. This would build up a signal of 1’s and 0’s which is completely random. If we computed the entropy of this signal we would find it is one. On the other hand imagine a coin which is completely biased, it always landed showing the head. This signal would be completely predictable, it would always be a 1, and the entropy would be zero. From our data we expect a squirt roughly with a probability of around 1 in 5, a truly random signal of 1s and 0s with this probability has an entropy of 0.72. What about our game? We find the entropy of our signal is a little lower, almost exactly 0.7, expressing the fact that our data has some intrinsic pattern.
Will this understanding allow us to stay dry on Christmas morning? Well no. The number of flushes that a player must make is random, decided by spinning a wheel numbered from 1 to 3. This serves to ensure that each player has no control over their own destiny. You can predict when the squirts will fire but you can’t control whether they will fire on you!